

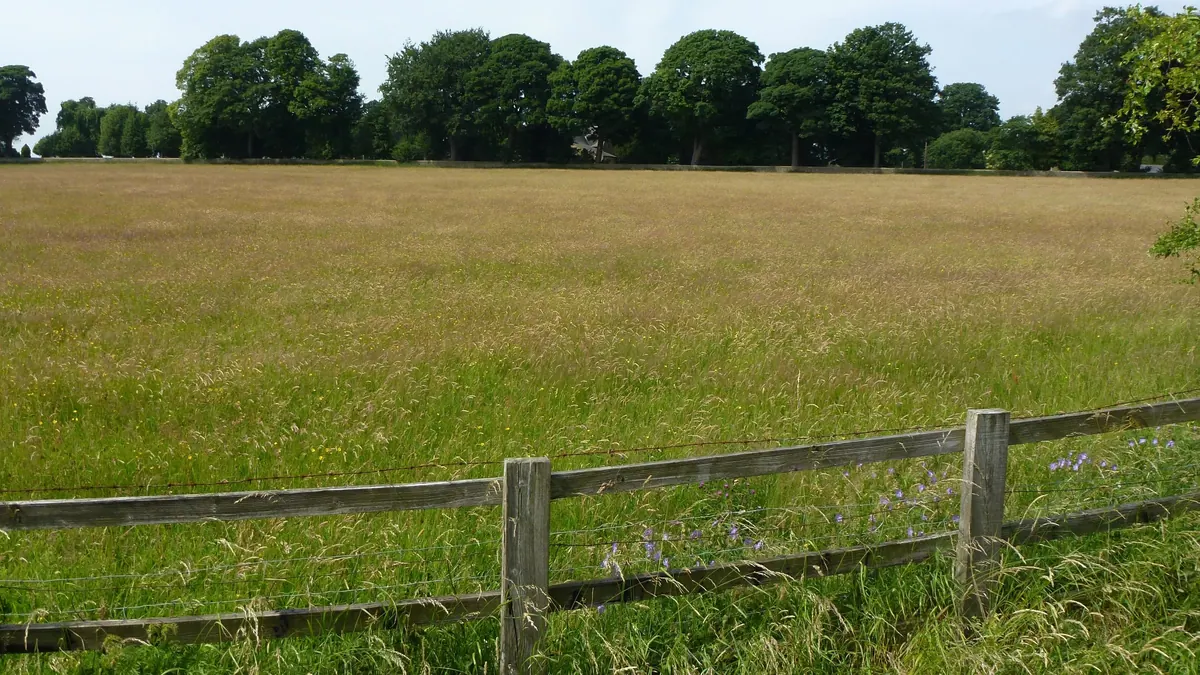
Test BMPErbe, foraggi verdi e piante foraggere
Meadow hay — BMP: 16 studi, media ponderata 279 m³ CH₄/t SV
Meadow hay: 16 record di dati BMP tratti da 7 pubblicazioni, media ponderata 279 m³ CH₄/t SV, intervallo 180–380.
valutazione: molto buonaCH₄ 53 %
Foto John H Darch / Wikimedia Commons, licenza CC BY-SA 2.0, file di origine; modifiche: ritaglio

- Media ponderata
- 279m³ CH₄/t SV
- Intervallo
- 180–380m³ CH₄/t SV
- Record
- 16studi
- Pubblicazioni
- 7fonti
- Temperature
- 35 °C, 36 °C, 37 °C, 38 °Cdel test
Metano nel biogas
Contenuto medio di metano · ≈ 5,3 kWh/m³ di biogas
misurata media di 1 studio BMP; in un test in batch la quota di CH₄ tende a essere più alta che in un impianto.
Valutazione per gli impianti di biogas
molto buona — valutazione redazionale per gli impianti di biogasConviene accettarlo anche gratuitamente o con un compenso al fornitore
Potenziale per tonnellata di sostanza fresca: molto alto (213 m³ CH₄/t); nessuna minaccia particolare per la stabilità. Costi di gestione: fibre, strato galleggiante.
Perché? Fattori della valutazione
Potenziale per tonnellata +3
- +3potenziale 213 m³ CH₄/t di sostanza fresca (BMP 279 × SS 82,4 % × SV 92,5 %)
Stabilità del processo 0
- 0nessun fattore
Gestione e costi −0,5
- −0,5fibre, strato galleggiante — triturazione e miscelazione intensa
Punteggio totale: 2,5 · soglie: ≥ 2,5 molto buona, ≥ 1 buona, sotto — neutra; negativa in caso di rischio di processo cumulativo.
Aggiungi al calcolatore di codigestione Dati CSV
Curve BMP da 16 studi
Media ponderata Singoli record
Le linee tratteggiate sono una curva del modello (cinetica del primo ordine, B(t) = B₀·(1 − e−kt)); il punto finale proviene dalla pubblicazione. Tutte le curve sono curve del modello.
Produzione cumulata di metano nel corso del test [m³ CH₄/t SV]. La linea spessa è la media ponderata di tutti i record (279); i punti indicano i valori finali riportati nelle pubblicazioni. Posizionare il puntatore sul grafico per leggere i valori; fare clic su una voce della legenda per nascondere o mostrare un record.
Mostra i restanti record nella legenda (4)
Record e fonti
Scarica il CSV| Fonte | BMP m³ CH₄/t SV | CH₄ nel biogas % vol., misurato | Temperatura | Campione | Curva |
|---|---|---|---|---|---|
| Lehtomaki (2005) · 1 | 180 | — | 35 °C · mesofilo | Grass hay (75% thymothy 25% meadow fescue) | punto finale (curva del modello) |
| Lehtomaki (2005) · 2 | 230 | — | 35 °C · mesofilo | Grass hay (75% thymothy 25% meadow fescue) | punto finale (curva del modello) |
| Lehtomaki (2006) · 1 | 370 | — | 35 °C · mesofilo | Grass hay 67.5% timothy 22.5% meadow fescue 10% Red clover | punto finale (curva del modello) |
| Lehtomaki (2006) · 2 | 380 | — | 35 °C · mesofilo | Grass hay 67.5% timothy 22.5% meadow fescue 10% Red clover | punto finale (curva del modello) |
| Lehtomaki (2004) | 230 | — | 35 °C · mesofilo | Grass hay (75% thymothy 25% meadow fescue) | punto finale (curva del modello) |
| Kaiser (2007) · 1 | 188 | — | 37 °C · mesofilo | grass hay | punto finale (curva del modello) |
| Kaiser (2007) · 2 | 191 | — | 37 °C · mesofilo | grass hay | punto finale (curva del modello) |
| Kaiser (2007) · 3 | 198 | — | 37 °C · mesofilo | grass hay | punto finale (curva del modello) |
| Kaiser (2007) · 4 | 219 | — | 37 °C · mesofilo | grass hay | punto finale (curva del modello) |
| Kaiser (2007) · 5 | 230 | — | 37 °C · mesofilo | grass hay | punto finale (curva del modello) |
| Kaiser (2007) · 6 | 268 | — | 37 °C · mesofilo | grass hay | punto finale (curva del modello) |
| Lallement et al. (2023) DOI | 289 | — | 38 °C · mesofilo | hay meadow | punto finale (curva del modello) |
| Luna-delRisco et al. (2011) · 1 | 253 | — | 36 °C · mesofilo | hay | punto finale (curva del modello) |
| Luna-delRisco et al. (2011) · 2 | 286 | — | 36 °C · mesofilo | hay | punto finale (curva del modello) |
| Luna-delRisco et al. (2011) · 3 | 319 | — | 36 °C · mesofilo | hay | punto finale (curva del modello) |
| Dubrovskis et al. (2018) DOI | 355 | 53,3 % | 38 °C · mesofilo | Grass hay pellets | punto finale (curva del modello) |
| Media ponderata | 279 | 53,3 % | media aritmetica 262, SD 66 | ||
Composizione tipica
- Sostanza secca (SS)
- 82,4% (intervallo 20,2–91,3)
- Solidi volatili (SV)
- 92,5 % SS (intervallo 91,4–94,2)
- Azoto
- 2,6 % SS
- Rapporto C/N
- 26
Mediana e intervallo delle determinazioni riportate nelle pubblicazioni alla base dei record BMP di questo substrato (lette da: CROPGEN D4, MY-D); sostanza secca: 13 determinazioni, solidi volatili: 8 determinazioni. Il rapporto C/N è stato calcolato come rapporto tra il contenuto di C e di N (% SS) dalla stessa fonte. L’intervallo di SS comprende sia campioni freschi sia campioni parzialmente essiccati o essiccati prima del test: per il materiale fresco vale la parte inferiore dell’intervallo, meglio ancora una misurazione propria.
Fonti: Lehtomaki (2005); Lehtomaki (2006); Lehtomaki (2004); Kaiser (2007); Lallement et al. (2023); Luna-delRisco et al. (2011).
La composizione della materia prima varia da un lotto all’altro: per i calcoli dell’impianto utilizzare l’analisi di un campione proprio. Il calcolatore inserisce automaticamente valori tipici.
Proprietà di processo
Codigestione — con che cosa abbinarlo, a che cosa prestare attenzione
- si abbina bene
Dosaggio
Fonti dei dati di processo
- Dubrovskis, V.; Plume, I.; Straume, I. (2018) Investigations of biogas production potential from grass hay pellets. Engineering for Rural Development
- Weiland, P. (2010) Biogas production: current state and perspectives. Applied Microbiology and Biotechnology
- Lehtomaki, A. Ronkainen, O.M. Rintala, J.A. (2005) Developing storage methods for optimised methane production from energy crops in northern conditions. ADSW 2005 Conference Proceedings Vol 1. 101-108
- Lehtomaki, A. Viinikainen, T.A. Rintala, J.A (2006) Screening boreal energy crops and crop residues for methane biofuel production. Submitted to Biomass and Bioenergy
- Lehtomaki, A. Viinikainen, T.A. Ronkainen, O.M. Alen, R. Rintala, J.A. (2004) Effect of pretreatments on methane production potential of energy crops and crop residues. Proceedings Anaerobic Digestion Conference 1016-1021
- Hendriks, A.T.W.M.; Zeeman, G. (2009) Pretreatments to enhance the digestibility of lignocellulosic biomass. Bioresource Technology
- Kaiser, F.L. (2007) Einfluss der stofflichen Zusammensetzung auf die Verdaulichkeit nachwachsender Rohstoffe beim anaeroben Abbau in Biogasreaktoren. Dissertation, Technische Universität München, Wissenschaftszentrum Weihenstephan
- Lallement, A.; Peyrelasse, C.; Lagnet, C.; Barakat, A.; Schraauwers, B.; Maunas, S.; Monlau, F. (2023) A Detailed Database of the Chemical Properties and Methane Potential of Biomasses Covering a Large Range of Common Agricultural Biogas Plant Feedstocks. Waste 1(1), 195–227
- Luna-delRisco, M.; Normak, A.; Orupõld, K. (2011) Biochemical methane potential of different organic wastes and energy crops from Estonia. Agronomy Research 9(1–2), 331–342
- FNR (2010). Guía sobre el Biogás – Desde la producción hasta el uso (hiszp. wydanie „Leitfaden Biogas”, GIZ 2013)
Il calcolatore di codigestione valuterà una specifica miscela contenente questo substrato.
Che cosa mostra la raccolta
La raccolta comprende 16 record del potenziale metanigeno (BMP) per il substrato “Meadow hay” tratti da 7 pubblicazioni relativi al periodo 2004–2023. I risultati vanno da 180 a 380 m³ CH₄/t SV e la media ponderata è 279 m³ CH₄/t SV (media aritmetica 262, deviazione standard 66).
I test sono stati condotti a 35, 36, 37, 38 °C (regime: mesofilo). Le differenze di temperatura, inoculo, durata del test e preparazione del campione sono cause tipiche della dispersione dei risultati tra i laboratori.
Per 16 record la pubblicazione riporta solo il valore finale. La linea nel grafico è allora una curva del modello (cinetica del primo ordine) e serve solo a confrontare le forme: dalla pubblicazione proviene soltanto il punto finale.
Come utilizzare questi dati
Il BMP descrive il potenziale ottenuto in un test in batch in condizioni di laboratorio. In un impianto a scala reale la resa dipende inoltre dal tempo di ritenzione, dal carico del digestore, dalla miscelazione e dalla composizione dell’alimentazione. Per i calcoli preliminari conviene utilizzare la media ponderata, mentre per la valutazione del rischio l’intero intervallo dei risultati. Nella pianificazione di una specifica alimentazione conviene commissionare un proprio test BMP su un campione rappresentativo.
La metodologia in breve
Il BMP è la quantità di metano ottenuta dai solidi volatili (SV) in un test in batch, espressa in m³ CH₄ per tonnellata di SV (numericamente uguale a NmL CH₄/g SV nelle pubblicazioni) e convertita in condizioni normali (0 °C, 101,325 kPa). La media ponderata attribuisce a ogni pubblicazione un peso complessivo pari a 1, ripartito in parti uguali tra i suoi risultati per il substrato: un articolo che testa venti varietà non pesa più di un articolo con un solo campione. Nei programmi interlaboratorio l’unità è il laboratorio (peso complessivo 1) e, al suo interno, il peso di una prova cresce con il numero di bottiglie (repliche). I risultati dopo pretrattamento (ad es. termico, chimico, enzimatico) sono presentati separatamente e non rientrano nella media.
Le linee continue sono curve misurate nei test. Quando una pubblicazione riporta solo il risultato finale, tracciamo un modello cinetico del primo ordine, B(t) = B₀·(1 − e−kt): dalla pubblicazione proviene soltanto il punto finale e la forma della curva serve unicamente come visualizzazione: da essa non si deve ricavare la produzione di un determinato giorno. Per questo substrato si è assunto k = 0,091 d−1 (nessun dato cinetico per il gruppo – è stata utilizzata la mediana di tutte le costanti di velocità k disponibili (93 valori)).
Le statistiche descrivono la dispersione dei risultati pubblicati: una raccolta descrittiva, non una meta-analisi né una garanzia della resa dell’impianto.
Risultati dopo pretrattamento (38) — esclusi dalla media
| Fonte | BMP m³ CH₄/t SV | Pretrattamento | Campione |
|---|---|---|---|
| Lehtomaki (2004) | 270 | — | Grass hay (75% thymothy 25% meadow fescue) |
| Lehtomaki (2004) | 270 | — | Grass hay (75% thymothy 25% meadow fescue) |
| Lehtomaki (2004) | 260 | — | Grass hay (75% thymothy 25% meadow fescue) |
| Lehtomaki (2004) | 190 | — | Grass hay (75% thymothy 25% meadow fescue) |
| Lehtomaki (2004) | 130 | — | Grass hay (75% thymothy 25% meadow fescue) |
| Lehtomaki (2004) | 240 | — | Grass hay (75% thymothy 25% meadow fescue) |
| Lehtomaki (2004) | 100 | — | Grass hay (75% thymothy 25% meadow fescue) |
| Lehtomaki (2004) | 140 | — | Grass hay (75% thymothy 25% meadow fescue) |
| Lehtomaki (2004) | 130 | — | Grass hay (75% thymothy 25% meadow fescue) |
| Lehtomaki (2004) | 260 | — | Grass hay (75% thymothy 25% meadow fescue) |
| Lehtomaki (2004) | 250 | — | Grass hay (75% thymothy 25% meadow fescue) |
| Lehtomaki (2004) | 270 | — | Grass hay (75% thymothy 25% meadow fescue) |
| Lehtomaki (2004) | 230 | — | Grass hay (75% thymothy 25% meadow fescue) |
| Lehtomaki (2004) | 140 | — | Grass hay (75% thymothy 25% meadow fescue) |
| Lehtomaki (2004) | 210 | — | Grass hay (75% thymothy 25% meadow fescue) |
| Lehtomaki (2004) | 170 | — | Grass hay (75% thymothy 25% meadow fescue) |
| Lehtomaki (2004) | 240 | — | Grass hay (75% thymothy 25% meadow fescue) |
| Lehtomaki (2004) | 270 | — | Grass hay (75% thymothy 25% meadow fescue) |
| Lehtomaki (2004) | 200 | — | Grass hay (75% thymothy 25% meadow fescue) |
| Lehtomaki (2004) | 230 | — | Grass hay (75% thymothy 25% meadow fescue) |
| Lehtomaki (2004) | 250 | — | Grass hay (75% thymothy 25% meadow fescue) |
| Lehtomaki (2004) | 230 | — | Grass hay (75% thymothy 25% meadow fescue) |
| Lehtomaki (2005) | 280 | — | Grass hay (75% thymothy 25% meadow fescue) |
| Lehtomaki (2005) | 280 | — | Grass hay (75% thymothy 25% meadow fescue) |
| Lehtomaki (2005) | 310 | — | Grass hay (75% thymothy 25% meadow fescue) |
| Lehtomaki (2005) | 280 | — | Grass hay (75% thymothy 25% meadow fescue) |
| Lehtomaki (2005) | 240 | — | Grass hay (75% thymothy 25% meadow fescue) |
| Lehtomaki (2005) | 240 | — | Grass hay (75% thymothy 25% meadow fescue) |
| Lehtomaki (2005) | 260 | — | Grass hay (75% thymothy 25% meadow fescue) |
| Lehtomaki (2005) | 240 | — | Grass hay (75% thymothy 25% meadow fescue) |
| Lehtomaki (2005) | 170 | — | Grass hay (75% thymothy 25% meadow fescue) |
| Lehtomaki (2005) | 240 | — | Grass hay (75% thymothy 25% meadow fescue) |
| Lehtomaki (2005) | 240 | — | Grass hay (75% thymothy 25% meadow fescue) |
| Lehtomaki (2005) | 240 | — | Grass hay (75% thymothy 25% meadow fescue) |
| Lehtomaki (2005) | 270 | — | Grass hay (75% thymothy 25% meadow fescue) |
| Lehtomaki (2005) | 230 | — | Grass hay (75% thymothy 25% meadow fescue) |
| Lehtomaki (2005) | 230 | — | Grass hay (75% thymothy 25% meadow fescue) |
| Lehtomaki (2005) | 240 | — | Grass hay (75% thymothy 25% meadow fescue) |
Bibliografia
- Lehtomaki, A. Ronkainen, O.M. Rintala, J.A. (2005). Developing storage methods for optimised methane production from energy crops in northern conditions. ADSW 2005 Conference Proceedings Vol 1. 101-108.
- Lehtomaki, A. Viinikainen, T.A. Rintala, J.A (2006). Screening boreal energy crops and crop residues for methane biofuel production. Submitted to Biomass and Bioenergy.
- Lehtomaki, A. Viinikainen, T.A. Ronkainen, O.M. Alen, R. Rintala, J.A. (2004). Effect of pretreatments on methane production potential of energy crops and crop residues. Proceedings Anaerobic Digestion Conference 1016-1021.
- Kaiser, F.L. (2007). Einfluss der stofflichen Zusammensetzung auf die Verdaulichkeit nachwachsender Rohstoffe beim anaeroben Abbau in Biogasreaktoren. Dissertation, Technische Universität München, Wissenschaftszentrum Weihenstephan. https://mediatum.ub.tum.de/631394 fonte
- Lallement, A.; Peyrelasse, C.; Lagnet, C.; Barakat, A.; Schraauwers, B.; Maunas, S.; Monlau, F. (2023). A Detailed Database of the Chemical Properties and Methane Potential of Biomasses Covering a Large Range of Common Agricultural Biogas Plant Feedstocks. Waste 1(1), 195–227. DOI: 10.3390/waste1010014 DOI
- Luna-delRisco, M.; Normak, A.; Orupõld, K. (2011). Biochemical methane potential of different organic wastes and energy crops from Estonia. Agronomy Research 9(1–2), 331–342. https://www.semanticscholar.org/paper/25cf2d7bba4758136830a9a02caf3ecd997173bb fonte
- Dubrovskis, V.; Plume, I.; Straume, I. (2018). Investigations of biogas production potential from grass hay pellets. Engineering for Rural Development. DOI: 10.22616/erdev2018.17.n413 DOI
Tutte le fonti del sito: bibliografia.
Altri substrati del gruppo “Erbe, foraggi verdi e piante foraggere”
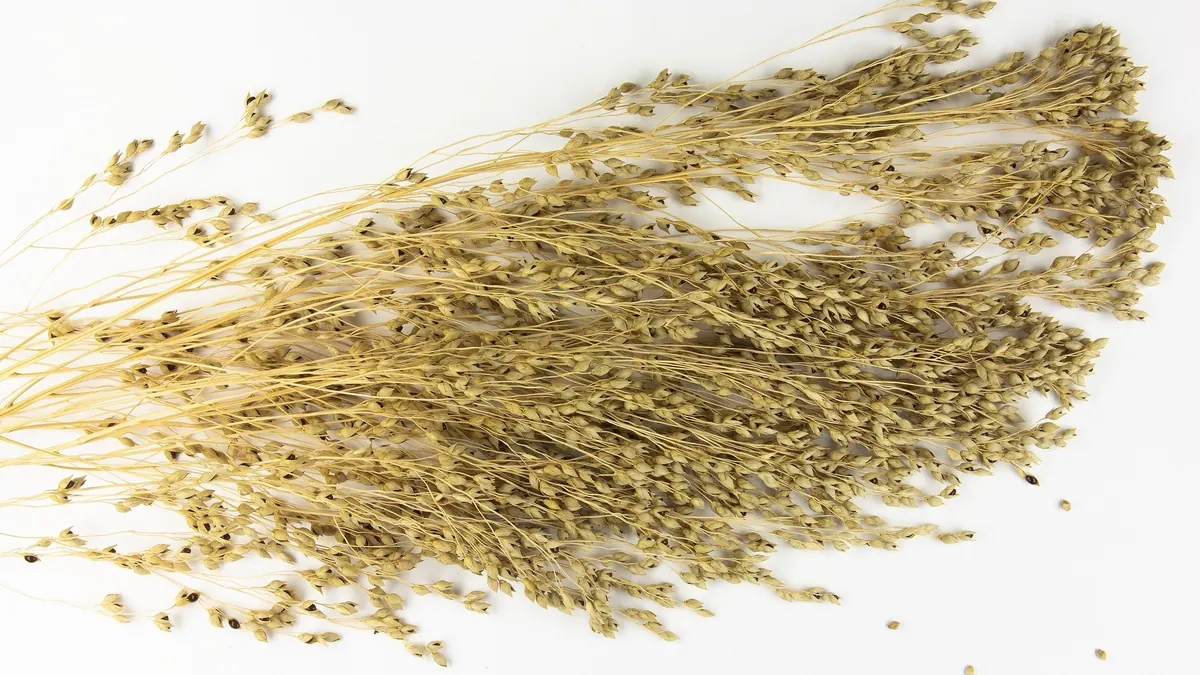
Proso millet, whole crop — BMP: 2 studi, media ponderata 260 m³ CH₄/t SV
260 m³ CH₄/t SV media ponderata da 2 studi
buona — valutazione redazionale per gli impianti di biogas≈52 %
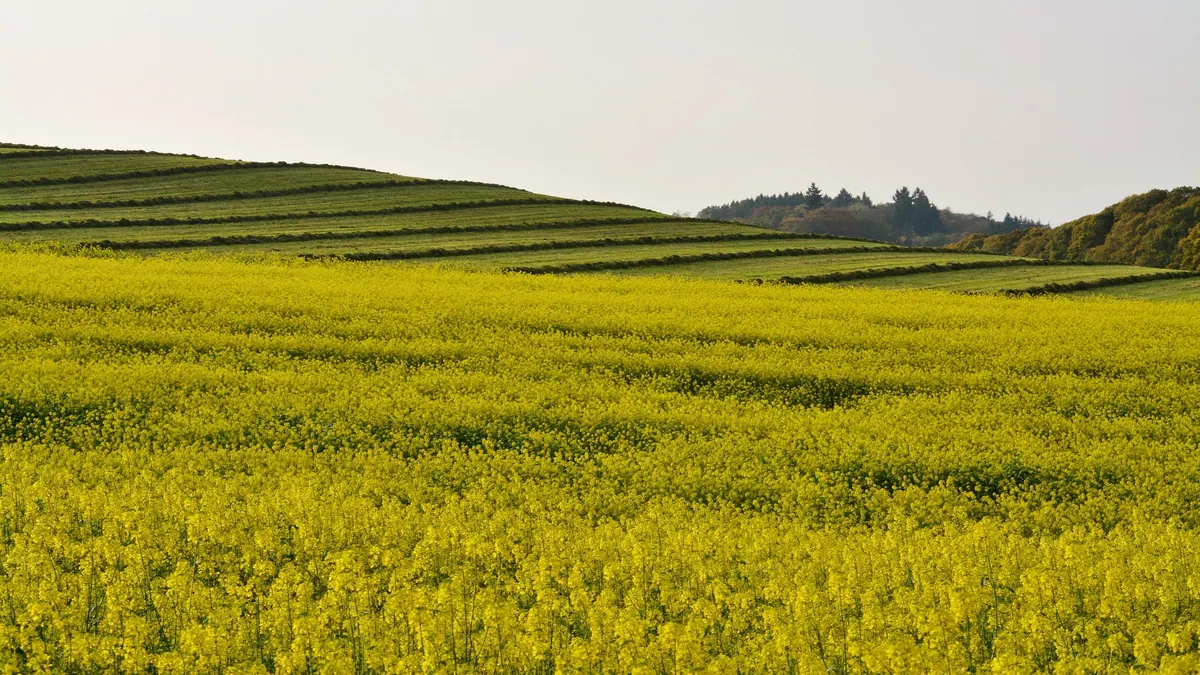
White mustard (tops) — BMP: 2 studi, media ponderata 313 m³ CH₄/t SV
313 m³ CH₄/t SV media ponderata da 2 studi
buona — valutazione redazionale per gli impianti di biogas68 %
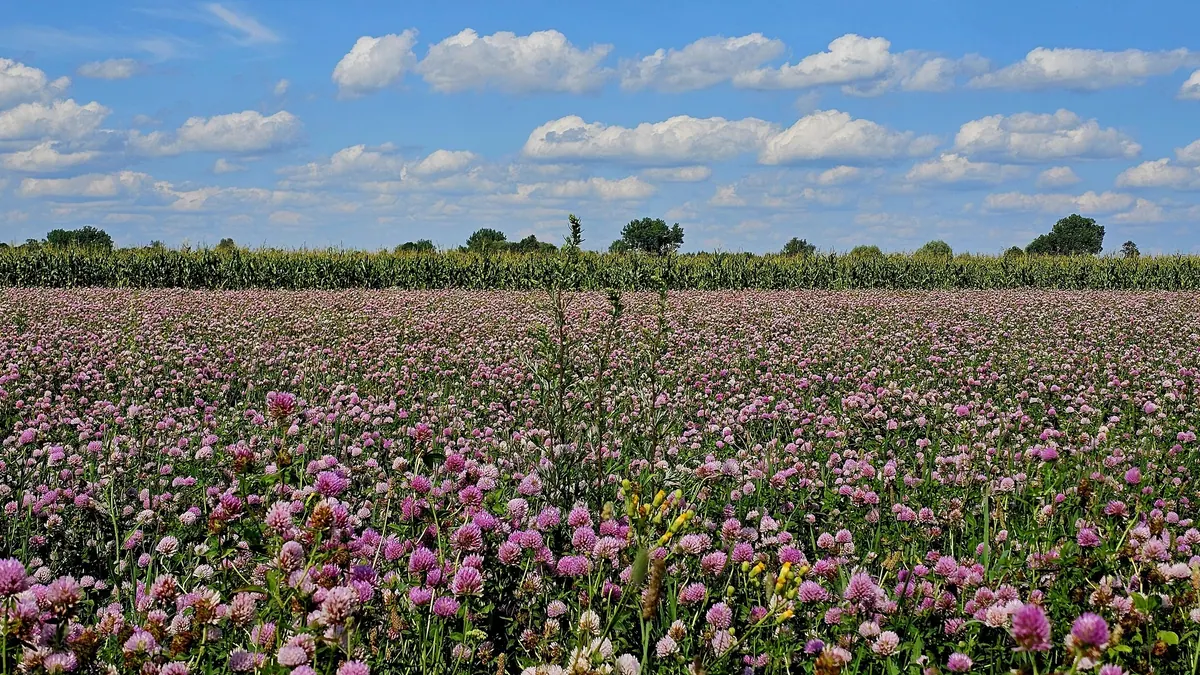
Millet/foxtail millet and clover mixtures — BMP: 5 studi, media ponderata 304 m³ CH₄/t SV
304 m³ CH₄/t SV media ponderata da 5 studi
buona — valutazione redazionale per gli impianti di biogas≈53 %
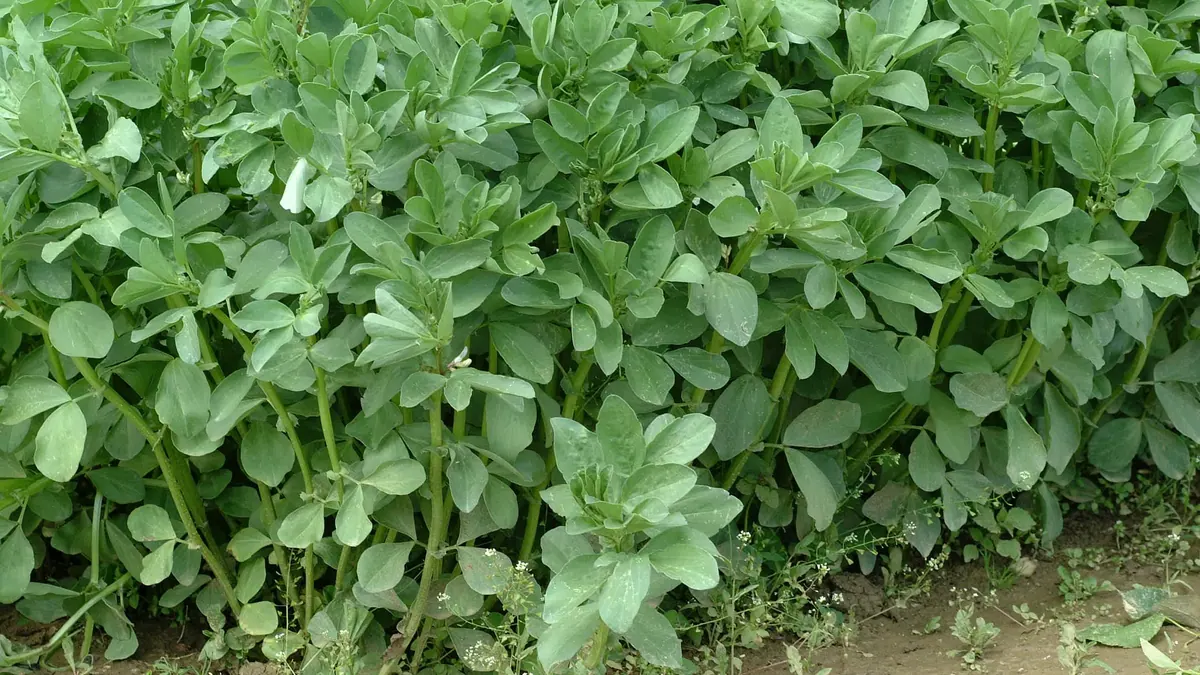
Faba bean, whole crop — BMP: 2 studi, media ponderata 296 m³ CH₄/t SV
296 m³ CH₄/t SV media ponderata da 2 studi
≈52 %