

BMP-onderzoekEnergiegewassen en hele-plantgewassen (WCS)
Maize silage (whole crop) — BMP: 82 onderzoeken, gewogen gemiddelde 341 m³ CH₄/t oDS
Maize silage (whole crop): 82 records aan BMP-gegevens uit 17 publicaties, gewogen gemiddelde 341 m³ CH₄/t oDS, bereik 245–480.
beoordeling: zeer goedCH₄ 59 %
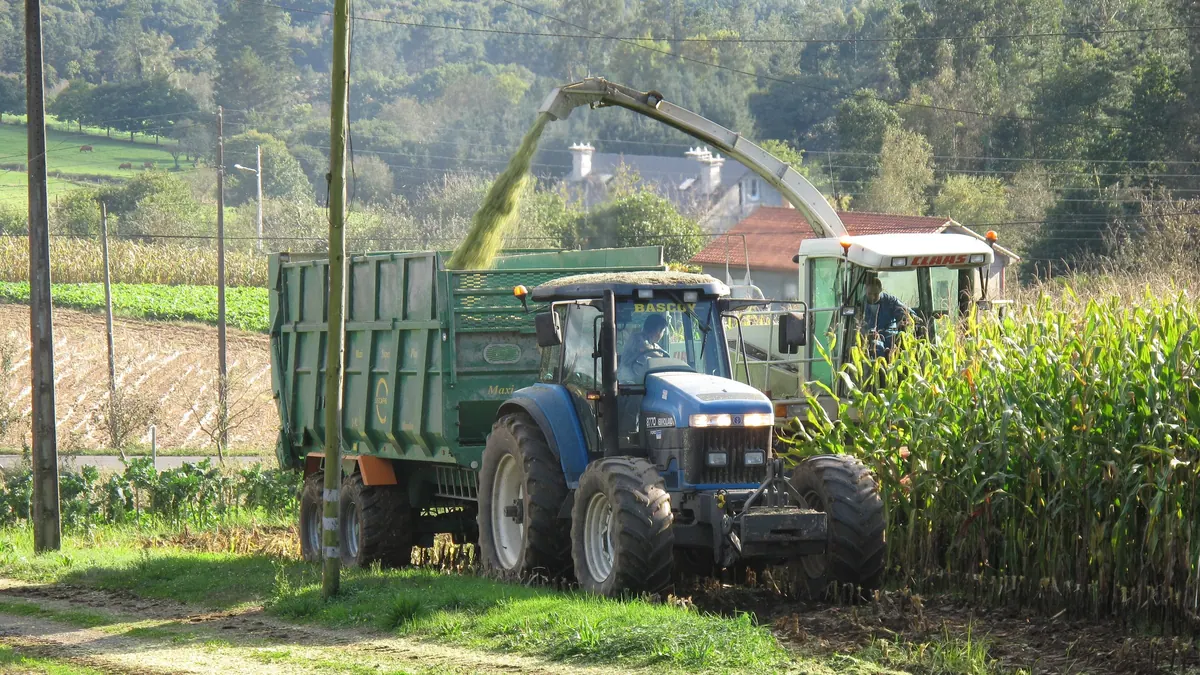
Foto Luis Miguel Bugallo Sánchez (user Lmbuga) / Wikimedia Commons, licentie CC BY-SA 3.0, bronbestand; wijzigingen: bijsnijding

- Gewogen gemiddelde
- 341m³ CH₄/t oDS
- Bereik
- 245–480m³ CH₄/t oDS
- Records
- 82onderzoeken
- Publicaties
- 17bronnen
- Temperaturen
- 35 °C, 36 °C, 37 °C, 38 °C, 40 °Cvan de test
Methaan in biogas
Gemiddeld methaangehalte · ≈ 5,9 kWh/m³ biogas
gemeten gemiddelde van 1 onderzoek BMP; in een batchtest is het CH₄-aandeel doorgaans hoger dan in een installatie.
Beoordeling voor biogasinstallaties
zeer goed — redactionele beoordeling voor biogasinstallatiesHet waard om te accepteren, zelfs gratis of tegen betaling aan de leverancier
Potentieel per ton vers materiaal: zeer hoog (110 m³ CH₄/t); procesrisico: verzuring. Geen aanvullende verwerkingseisen.
Waarom? Beoordelingsfactoren
Potentieel per ton +3
- +3potentieel 110 m³ CH₄/t vers materiaal (BMP 341 × DS 33,6% × oDS 95,8%)
Processtabiliteit −0,5
- −0,5verzuring: snelle afbraak / zure pH, risico op ophoping van VVZ, buffering nodig
Verwerking en kosten 0
- 0geen factoren
Totaal aantal punten: 2,5 · drempels: ≥ 2,5 zeer goed, ≥ 1 goed, daaronder — neutraal; negatief bij cumulatief procesrisico.
Toevoegen aan de covergistingsrekentool CSV-gegevens
BMP-curves uit 82 onderzoeken
Gewogen gemiddelde Afzonderlijke records
Gestippelde lijnen zijn een modelcurve (kinetiek van de eerste orde, B(t) = B₀·(1 − e−kt)); het eindpunt is afkomstig uit de publicatie. Alle curves zijn modelcurves.
Cumulatieve methaanproductie gedurende de test [m³ CH₄/t oDS]. De dikke lijn is het gewogen gemiddelde van alle records (341); punten markeren de in de publicaties vermelde eindwaarden. Wijs naar de grafiek om waarden af te lezen; klik op een item in de legenda om een record te verbergen of te tonen.
De overige records in de legenda tonen (70)
Records en bronnen
CSV downloaden| Bron | BMP m³ CH₄/t oDS | CH₄ in biogas % vol., gemeten | Temperatuur | Monster | Curve |
|---|---|---|---|---|---|
| Amon et al. (2007) · 1 DOI | 268 | — | 38 °C · mesofiel | Maize | eindpunt (modelcurve) |
| Amon et al. (2007) · 2 DOI | 280 | — | 38 °C · mesofiel | Maize | eindpunt (modelcurve) |
| Amon et al. (2007) · 3 DOI | 283 | — | 38 °C · mesofiel | Maize | eindpunt (modelcurve) |
| Amon et al. (2007) · 4 DOI | 287 | — | 38 °C · mesofiel | Maize | eindpunt (modelcurve) |
| Amon et al. (2007) · 5 DOI | 302 | — | 38 °C · mesofiel | Maize | eindpunt (modelcurve) |
| Amon et al. (2007) · 6 DOI | 313 | — | 38 °C · mesofiel | Maize | eindpunt (modelcurve) |
| Amon et al. (2007) · 7 DOI | 326 | — | 38 °C · mesofiel | Maize | eindpunt (modelcurve) |
| Amon et al. (2007) · 8 DOI | 334 | — | 38 °C · mesofiel | Maize | eindpunt (modelcurve) |
| Amon et al. (2007) · 9 DOI | 366 | — | 38 °C · mesofiel | Maize | eindpunt (modelcurve) |
| Amon et al. (2007) · 10 DOI | 390 | — | 38 °C · mesofiel | Maize Silage | eindpunt (modelcurve) |
| Neureiter (2005) · 1 | 338 | — | 35 °C · mesofiel | Maize · voorbehandeling: Silage 44 days | eindpunt (modelcurve) |
| Neureiter (2005) · 2 | 355 | — | 35 °C · mesofiel | Maize · voorbehandeling: Silage 44 days Not compressed | eindpunt (modelcurve) |
| Neureiter (2005) · 3 | 383 | — | 35 °C · mesofiel | Maize | eindpunt (modelcurve) |
| Neureiter (2005) · 4 | 405 | — | 35 °C · mesofiel | Maize · voorbehandeling: Silage 119 days Not compressed | eindpunt (modelcurve) |
| Neureiter (2005) · 5 | 480 | — | 35 °C · mesofiel | Maize · voorbehandeling: Silage 119 days | eindpunt (modelcurve) |
| Perez Lopez (2005) · 1 | 319 | — | 35 °C · mesofiel | Corn ((Whole crop maize silage)) · voorbehandeling: Silage | eindpunt (modelcurve) |
| Perez Lopez (2005) · 2 | 335 | — | 35 °C · mesofiel | Corn ((Whole crop maize silage)) · voorbehandeling: Silage | eindpunt (modelcurve) |
| Perez Lopez (2005) · 3 | 350 | — | 35 °C · mesofiel | Corn ((Whole crop maize silage)) · voorbehandeling: Silage | eindpunt (modelcurve) |
| Perez Lopez (2005) · 4 | 391 | — | 35 °C · mesofiel | Corn ((Whole crop maize silage)) | eindpunt (modelcurve) |
| Perez Lopez (2005) · 5 | 435 | — | 35 °C · mesofiel | Corn ((Whole crop maize silage)) | eindpunt (modelcurve) |
| Pouech (b.r.) | 397 | 58,9 % | 40 °C · mesofiel | Corn | eindpunt (modelcurve) |
| Dubrovskis i Plume (2017) DOI | 335 | — | 38 °C · mesofiel | Corn silage (IN+CS, no additives) | eindpunt (modelcurve) |
| Kaiser (2007) · 1 | 245 | — | 37 °C · mesofiel | maize | eindpunt (modelcurve) |
| Kaiser (2007) · 2 | 248 | — | 37 °C · mesofiel | maize | eindpunt (modelcurve) |
| Kaiser (2007) · 3 | 272 | — | 37 °C · mesofiel | maize | eindpunt (modelcurve) |
| Kaiser (2007) · 4 | 275 | — | 37 °C · mesofiel | maize | eindpunt (modelcurve) |
| Kaiser (2007) · 5 | 278 | — | 37 °C · mesofiel | maize | eindpunt (modelcurve) |
| Kaiser (2007) · 6 | 284 | — | 37 °C · mesofiel | maize | eindpunt (modelcurve) |
| Kaiser (2007) · 7 | 288 | — | 37 °C · mesofiel | maize | eindpunt (modelcurve) |
| Kaiser (2007) · 8 | 290 | — | 37 °C · mesofiel | maize | eindpunt (modelcurve) |
| Kaiser (2007) · 9 | 293 | — | 37 °C · mesofiel | maize | eindpunt (modelcurve) |
| Kaiser (2007) · 10 | 298 | — | 37 °C · mesofiel | maize | eindpunt (modelcurve) |
| Kaiser (2007) · 11 | 319 | — | 37 °C · mesofiel | maize | eindpunt (modelcurve) |
| Kaiser (2007) · 12 | 324 | — | 37 °C · mesofiel | maize | eindpunt (modelcurve) |
| Kaiser (2007) · 13 | 327 | — | 37 °C · mesofiel | maize | eindpunt (modelcurve) |
| Kaiser (2007) · 14 | 328 | — | 37 °C · mesofiel | maize | eindpunt (modelcurve) |
| Kaiser (2007) · 15 | 331 | — | 37 °C · mesofiel | maize | eindpunt (modelcurve) |
| Kaiser (2007) · 16 | 332 | — | 37 °C · mesofiel | maize | eindpunt (modelcurve) |
| Kaiser (2007) · 17 | 339 | — | 37 °C · mesofiel | maize | eindpunt (modelcurve) |
| Kaiser (2007) · 18 | 344 | — | 37 °C · mesofiel | maize | eindpunt (modelcurve) |
| Kaiser (2007) · 19 | 345 | — | 37 °C · mesofiel | maize | eindpunt (modelcurve) |
| Kaiser (2007) · 20 | 346 | — | 37 °C · mesofiel | maize | eindpunt (modelcurve) |
| Kaiser (2007) · 21 | 348 | — | 37 °C · mesofiel | maize | eindpunt (modelcurve) |
| Kaiser (2007) · 22 | 349 | — | 37 °C · mesofiel | maize | eindpunt (modelcurve) |
| Kaiser (2007) · 23 | 351 | — | 37 °C · mesofiel | maize | eindpunt (modelcurve) |
| Kaiser (2007) · 24 | 352 | — | 37 °C · mesofiel | maize | eindpunt (modelcurve) |
| Kaiser (2007) · 25 | 353 | — | 37 °C · mesofiel | maize | eindpunt (modelcurve) |
| Kaiser (2007) · 26 | 360 | — | 37 °C · mesofiel | maize | eindpunt (modelcurve) |
| Kaiser (2007) · 27 | 362 | — | 37 °C · mesofiel | maize | eindpunt (modelcurve) |
| Kaiser (2007) · 28 | 374 | — | 37 °C · mesofiel | maize | eindpunt (modelcurve) |
| Kaiser (2007) · 29 | 396 | — | 37 °C · mesofiel | maize | eindpunt (modelcurve) |
| Kaiser (2007) · 30 | 398 | — | 37 °C · mesofiel | maize | eindpunt (modelcurve) |
| Kaiser (2007) · 31 | 421 | — | 37 °C · mesofiel | maize | eindpunt (modelcurve) |
| Kaiser (2007) · 32 | 432 | — | 37 °C · mesofiel | maize | eindpunt (modelcurve) |
| Koch et al. (2017) · 1 DOI | 332 | — | 38 °C · mesofiel | maize | eindpunt (modelcurve) |
| Koch et al. (2017) · 2 DOI | 335 | — | 38 °C · mesofiel | maize | eindpunt (modelcurve) |
| Koch et al. (2017) · 3 DOI | 340 | — | 38 °C · mesofiel | maize | eindpunt (modelcurve) |
| Koch et al. (2017) · 4 DOI | 345 | — | 38 °C · mesofiel | maize | eindpunt (modelcurve) |
| Koch et al. (2017) · 5 DOI | 350 | — | 38 °C · mesofiel | maize | eindpunt (modelcurve) |
| Koch et al. (2017) · 6 DOI | 355 | — | 38 °C · mesofiel | maize | eindpunt (modelcurve) |
| Kolbl et al. (2014) DOI | 256 | — | 38 °C · mesofiel | Silo Maize | eindpunt (modelcurve) |
| Kolbl (2014) | 438 | — | 38 °C · mesofiel | Maize Silage | eindpunt (modelcurve) |
| Labatut et al. (2011) DOI | 296 | — | 35 °C · mesofiel | corn silage | eindpunt (modelcurve) |
| Lallement et al. (2023) · 1 DOI | 272 | — | 38 °C · mesofiel | maize | eindpunt (modelcurve) |
| Lallement et al. (2023) · 2 DOI | 301 | — | 38 °C · mesofiel | Maize | eindpunt (modelcurve) |
| Lallement et al. (2023) · 3 DOI | 319 | — | 38 °C · mesofiel | Maize | eindpunt (modelcurve) |
| Lallement et al. (2023) · 4 DOI | 335 | — | 38 °C · mesofiel | Maize | eindpunt (modelcurve) |
| Lallement et al. (2023) · 5 DOI | 336 | — | 38 °C · mesofiel | maize | eindpunt (modelcurve) |
| Lallement et al. (2023) · 6 DOI | 376 | — | 38 °C · mesofiel | Maize | eindpunt (modelcurve) |
| Lallement et al. (2023) · 7 DOI | 384 | — | 38 °C · mesofiel | Maize | eindpunt (modelcurve) |
| Lallement et al. (2023) · 8 DOI | 418 | — | 38 °C · mesofiel | Maize | eindpunt (modelcurve) |
| Luna-delRisco et al. (2011) · 1 | 286 | — | 36 °C · mesofiel | maize silage | eindpunt (modelcurve) |
| Luna-delRisco et al. (2011) · 2 | 307 | — | 36 °C · mesofiel | maize silage | eindpunt (modelcurve) |
| Luna-delRisco et al. (2011) · 3 | 328 | — | 36 °C · mesofiel | maize silage | eindpunt (modelcurve) |
| Mast et al. (2014) DOI | 349 | — | 37 °C · mesofiel | maize | eindpunt (modelcurve) |
| Baute et al. (2018) DOI | 335 | — | 38 °C · mesofiel | Zea mays silage | eindpunt (modelcurve) |
| Barbot et al. (2015) DOI | 303 | — | 37 °C · mesofiel | Maize silage, untreated (MS-untreated, experiment E3) | eindpunt (modelcurve) |
| Ruf i Emmerling (2018) · 1 DOI | 282 | — | 38 °C · mesofiel | maize | eindpunt (modelcurve) |
| Ruf i Emmerling (2018) · 2 DOI | 288 | — | 38 °C · mesofiel | maize | eindpunt (modelcurve) |
| Ruf i Emmerling (2018) · 3 DOI | 335 | — | 38 °C · mesofiel | maize | eindpunt (modelcurve) |
| Ruf i Emmerling (2018) · 4 DOI | 347 | — | 38 °C · mesofiel | maize | eindpunt (modelcurve) |
| Vervaeren et al. (2010) DOI | 378 | — | 37 °C · mesofiel | untreated Maize | eindpunt (modelcurve) |
| Gewogen gemiddelde | 341 | 58,9 % | rekenkundig gemiddelde 337, SD 47 | ||
Typische samenstelling
- Droge stof (DS)
- 33,6% (bereik 8,2–89,6)
- Organische droge stof (oDS)
- 95,8 % DS (bereik 75,9–98)
- Stikstof
- 1,1 % DS
- C/N-verhouding
- 44
Mediaan en bereik van de bepalingen die in de publicaties achter de BMP-records van dit substraat zijn vermeld (afgelezen uit: CROPGEN D4, MY-D); droge stof: 57 bepalingen, organische droge stof: 43 bepalingen. C/N is berekend als de verhouding van het C- en N-gehalte (% DS) uit dezelfde bron. Het DS-bereik omvat zowel verse monsters als monsters die vóór de test gedeeltelijk zijn gedroogd of gedroogd – voor vers materiaal geldt het onderste deel van het bereik, bij voorkeur uw eigen meting.
Bronnen: Neureiter (2005); Perez Lopez (2005); Pouech, P. Fruteau, H. Bewa, H.. Agricultural crops for…; Kaiser (2007); Koch e.a. (2017); Kolbl e.a. (2014); Kolbl (2014); Labatut e.a. (2011); Lallement e.a. (2023); Luna-delRisco e.a. (2011); Ruf e.a. (2018); Vervaeren e.a. (2010).
De samenstelling van de grondstof verschilt per partij — gebruik voor berekeningen voor een installatie een analyse van uw eigen monster. De rekentool vult automatisch typische waarden in.
Proceseigenschappen
Covergisting — waarmee te combineren, waar op te letten
- combineert goed
- voorzichtigheid
substraten: vetrijk — bijv. Food waste, Spent coffee grounds, Primary sludge, Sunflower seeds, Olive pomace / olive mill solid waste
Dosering
Bronnen van de procesgegevens
- Weiland, P. (2010) Biogas production: current state and perspectives. Applied Microbiology and Biotechnology
- Chen, Y.; Cheng, J.J.; Creamer, K.S. (2008) Inhibition of anaerobic digestion process: A review. Bioresource Technology
- Palatsi, J. et al. (2009) Strategies for recovering inhibition caused by long chain fatty acids on anaerobic thermophilic biogas reactors. Bioresource Technology
- Amon, T.; Amon, B.; Kryvoruchko, V.; Machmüller, A.; Hopfner-Sixt, K.; Bodiroza, V.; Hrbek, R.; Friedel, J.; Pötsch, E.; Wagentristl, H.; Schreiner, M.; Zollitsch, W. (2007) Methane production through anaerobic digestion of various energy crops grown in sustainable crop rotations. Bioresource Technology 98(17), 3204–3212
- Neureiter,M. Teixeira Pereira dos Santos, J. Perez Lopez, C. Pichler, H. Kirchmayr, R and Braun, R. (2005) Effect of silage preparation on methane yields of whole crop maize silages. ADSW 2005 Conference Proceedings Vol 1. 109-115
- Perez Lopez, C. Kirchmayr, R. Neureiter, M. Braun, R. (2005) Effect of physical and chemical pretreatments on methane yield from maize silage and grains. ADSW 2005 Conference Proceedings Vol 2. 204-208
- Pouech, P. Fruteau, H. Bewa, H. (None) Agricultural crops for biogas production on anaerobic digestion plants. Biomass for energy and industry 163-165
- Dubrovskis, V.; Plume, I. (2017) Enzymatic and catalystic enchancement of methane production from corn silage and grain residues. Engineering for Rural Development
- Kaiser, F.L. (2007) Einfluss der stofflichen Zusammensetzung auf die Verdaulichkeit nachwachsender Rohstoffe beim anaeroben Abbau in Biogasreaktoren. Dissertation, Technische Universität München, Wissenschaftszentrum Weihenstephan
- Koch, K.; Lippert, T.; Drewes, J.E. (2017) The role of inoculum’s origin on the methane yield of different substrates in biochemical methane potential (BMP) tests. Bioresource Technology 243, 457–463
- Kolbl, S.; Paloczi, A.; Panjan, J.; Stres, B. (2014) Addressing case specific biogas plant tasks: Industry oriented methane yields derived from 5L Automatic Methane Potential Test Systems in batch or semi-continuous tests using realistic inocula, substrate particle sizes and organic loading. Bioresource Technology 153, 180–188
- Kolbl, S. (2014) Izboljšava anaerobne presnove blata iz komunalnih čistilnih naprav in lignoceluloznih substratov pri pridobivanju bioplina. Rozprawa doktorska, Univerza v Ljubljani, Fakulteta za gradbeništvo in geodezijo
- Labatut, R.A.; Angenent, L.T.; Scott, N.R. (2011) Biochemical methane potential and biodegradability of complex organic substrates. Bioresource Technology 102(3), 2255–2264
- Lallement, A.; Peyrelasse, C.; Lagnet, C.; Barakat, A.; Schraauwers, B.; Maunas, S.; Monlau, F. (2023) A Detailed Database of the Chemical Properties and Methane Potential of Biomasses Covering a Large Range of Common Agricultural Biogas Plant Feedstocks. Waste 1(1), 195–227
- Luna-delRisco, M.; Normak, A.; Orupõld, K. (2011) Biochemical methane potential of different organic wastes and energy crops from Estonia. Agronomy Research 9(1–2), 331–342
- Mast, B.; Lemmer, A.; Oechsner, H.; Reinhardt-Hanisch, A.; Claupein, W.; Graeff-Hönninger, S. (2014) Methane yield potential of novel perennial biogas crops influenced by harvest date. Industrial Crops and Products 58, 194–203
- Baute, K.; Van Eerd, L.L.; Robinson, D.E.; Sikkema, P.H.; Mushtaq, M.; Gilroyed, B.H. (2018) Comparing the Biomass Yield and Biogas Potential of Phragmites australis with Miscanthus x giganteus and Panicum virgatum Grown in Canada. Energies 11(9), 2198
- Barbot, Y.; Thomsen, C.; Thomsen, L.; Benz, R. (2015) Anaerobic Digestion of Laminaria japonica Waste from Industrial Production Residues in Laboratory- and Pilot-Scale. Marine Drugs 13(9), 5947–5975
- Ruf, T.; Emmerling, C. (2018) Site-adapted production of bioenergy feedstocks on poorly drained cropland through the cultivation of perennial crops. A feasibility study on biomass yield and biochemical methane potential. Biomass and Bioenergy 119, 429–435
- Vervaeren, H.; Hostyn, K.; Ghekiere, G.; Willems, B. (2010) Biological ensilage additives as pretreatment for maize to increase the biogas production. Renewable Energy 35(9), 2089–2093
- Herrmann et al. (2011). Effects of ensiling, silage additives and storage period on methane formation of biogas crops. Bioresour. Technol.
De covergistingsrekentool beoordeelt een specifiek mengsel dat dit substraat bevat.
Wat de compilatie laat zien
De compilatie omvat 82 records van het methaanpotentieel (BMP) voor het substraat “Maize silage (whole crop)” uit 17 publicaties gepubliceerd in 2005–2023. De resultaten lopen uiteen van 245 tot 480 m³ CH₄/t oDS en het gewogen gemiddelde bedraagt 341 m³ CH₄/t oDS (rekenkundig gemiddelde 337, standaardafwijking 47).
De tests zijn uitgevoerd bij 35, 36, 37, 38, 40 °C (regime: mesofiel). Verschillen in temperatuur, inoculum, testduur en monstervoorbereiding zijn typische oorzaken van de spreiding van resultaten tussen laboratoria.
Voor 82 records vermeldt de publicatie alleen de eindwaarde. De lijn in de grafiek is dan een modelcurve (kinetiek van de eerste orde) en dient alleen om vormen te vergelijken — alleen het eindpunt is afkomstig uit de publicatie.
Hoe u deze gegevens gebruikt
BMP beschrijft het potentieel dat in een batchtest onder laboratoriumomstandigheden wordt verkregen. In een installatie op ware grootte hangt het rendement bovendien af van de verblijftijd, de belasting van de vergister, de menging en de samenstelling van het voer. Gebruik voor voorlopige berekeningen het best het gewogen gemiddelde en voor risicobeoordeling het hele bereik van de resultaten. Bij de planning van een specifiek voer is het raadzaam een eigen BMP-test op een representatief monster te laten uitvoeren.
Methodologie in het kort
BMP is de hoeveelheid methaan die in een batchtest uit organische droge stof (oDS) wordt verkregen, uitgedrukt in m³ CH₄ per ton oDS (numeriek gelijk aan NmL CH₄/g oDS in de publicaties) en omgerekend naar normaalomstandigheden (0 °C, 101,325 kPa). Bij het gewogen gemiddelde krijgt elke publicatie een totaalgewicht van 1, gelijkmatig verdeeld over haar resultaten voor het substraat — een artikel dat twintig variëteiten test, weegt dus niet zwaarder dan een artikel met één monster. Bij interlaboratoriumprogramma’s is het laboratorium de eenheid (totaalgewicht 1), en binnen het laboratorium neemt het gewicht van een test toe met het aantal flessen (herhalingen). Resultaten na voorbehandeling (bijv. thermisch, chemisch, enzymatisch) worden apart getoond en tellen niet mee in het gemiddelde.
Doorgetrokken lijnen zijn in de tests gemeten curves. Wanneer een publicatie alleen het eindresultaat vermeldt, tekenen wij een kinetisch model van de eerste orde, B(t) = B₀·(1 − e−kt): alleen het eindpunt is afkomstig uit de publicatie en de vorm van de curve dient uitsluitend ter visualisatie — lees er niet de productie op een bepaalde dag uit af. Voor dit substraat is k = 0,085 d−1 aangenomen (mediaan van de in de bronnen vermelde en/of aan de gemiddelde gemeten curves gefitte snelheidsconstanten k).
De statistieken beschrijven de spreiding van gepubliceerde resultaten — een beschrijvende compilatie, geen meta-analyse en geen garantie voor het rendement van een installatie.
Resultaten na voorbehandeling (17) — uitgesloten van het gemiddelde
| Bron | BMP m³ CH₄/t oDS | Voorbehandeling | Monster |
|---|---|---|---|
| Perez Lopez (2005) | 538 | — | Corn |
| Perez Lopez (2005) | 530 | — | Corn |
| Perez Lopez (2005) | 431 | — | Corn ((Whole crop maize silage)) |
| Perez Lopez (2005) | 409 | — | Corn ((Whole crop maize silage)) |
| Perez Lopez (2005) | 422 | — | Corn ((Whole crop maize silage)) |
| Perez Lopez (2005) | 538 | — | Corn ((Whole crop maize silage)) |
| Perez Lopez (2005) | 584 | — | Corn ((Whole crop maize silage)) |
| Perez Lopez (2005) | 597 | — | Corn ((Whole crop maize silage)) |
| Perez Lopez (2005) | 539 | — | Corn ((Whole crop maize silage)) |
| Neureiter (2005) | 348 | — | Maize |
| Neureiter (2005) | 377 | — | Maize |
| Neureiter (2005) | 414 | — | Maize |
| Neureiter (2005) | 423 | — | Maize |
| Neureiter (2005) | 419 | — | Maize |
| Neureiter (2005) | 486 | — | Maize |
| Neureiter (2005) | 427 | — | Maize |
| Neureiter (2005) | 537 | — | Maize |
Bibliografie
- Amon, T.; Amon, B.; Kryvoruchko, V.; Machmüller, A.; Hopfner-Sixt, K.; Bodiroza, V.; Hrbek, R.; Friedel, J.; Pötsch, E.; Wagentristl, H.; Schreiner, M.; Zollitsch, W. (2007). Methane production through anaerobic digestion of various energy crops grown in sustainable crop rotations. Bioresource Technology 98(17), 3204–3212. DOI: 10.1016/j.biortech.2006.07.007 DOI
- Neureiter,M. Teixeira Pereira dos Santos, J. Perez Lopez, C. Pichler, H. Kirchmayr, R and Braun, R. (2005). Effect of silage preparation on methane yields of whole crop maize silages. ADSW 2005 Conference Proceedings Vol 1. 109-115.
- Perez Lopez, C. Kirchmayr, R. Neureiter, M. Braun, R. (2005). Effect of physical and chemical pretreatments on methane yield from maize silage and grains. ADSW 2005 Conference Proceedings Vol 2. 204-208.
- Pouech, P. Fruteau, H. Bewa, H.. Agricultural crops for biogas production on anaerobic digestion plants. Biomass for energy and industry 163-165.
- Dubrovskis, V.; Plume, I. (2017). Enzymatic and catalystic enchancement of methane production from corn silage and grain residues. Engineering for Rural Development. DOI: 10.22616/erdev2017.16.n088 DOI
- Kaiser, F.L. (2007). Einfluss der stofflichen Zusammensetzung auf die Verdaulichkeit nachwachsender Rohstoffe beim anaeroben Abbau in Biogasreaktoren. Dissertation, Technische Universität München, Wissenschaftszentrum Weihenstephan. https://mediatum.ub.tum.de/631394 bron
- Koch, K.; Lippert, T.; Drewes, J.E. (2017). The role of inoculum’s origin on the methane yield of different substrates in biochemical methane potential (BMP) tests. Bioresource Technology 243, 457–463. DOI: 10.1016/j.biortech.2017.06.142 DOI
- Kolbl, S.; Paloczi, A.; Panjan, J.; Stres, B. (2014). Addressing case specific biogas plant tasks: Industry oriented methane yields derived from 5L Automatic Methane Potential Test Systems in batch or semi-continuous tests using realistic inocula, substrate particle sizes and organic loading. Bioresource Technology 153, 180–188. DOI: 10.1016/j.biortech.2013.12.010 DOI
- Kolbl, S. (2014). Izboljšava anaerobne presnove blata iz komunalnih čistilnih naprav in lignoceluloznih substratov pri pridobivanju bioplina. Rozprawa doktorska, Univerza v Ljubljani, Fakulteta za gradbeništvo in geodezijo.
- Labatut, R.A.; Angenent, L.T.; Scott, N.R. (2011). Biochemical methane potential and biodegradability of complex organic substrates. Bioresource Technology 102(3), 2255–2264. DOI: 10.1016/j.biortech.2010.10.035 DOI
- Lallement, A.; Peyrelasse, C.; Lagnet, C.; Barakat, A.; Schraauwers, B.; Maunas, S.; Monlau, F. (2023). A Detailed Database of the Chemical Properties and Methane Potential of Biomasses Covering a Large Range of Common Agricultural Biogas Plant Feedstocks. Waste 1(1), 195–227. DOI: 10.3390/waste1010014 DOI
- Luna-delRisco, M.; Normak, A.; Orupõld, K. (2011). Biochemical methane potential of different organic wastes and energy crops from Estonia. Agronomy Research 9(1–2), 331–342. https://www.semanticscholar.org/paper/25cf2d7bba4758136830a9a02caf3ecd997173bb bron
- Mast, B.; Lemmer, A.; Oechsner, H.; Reinhardt-Hanisch, A.; Claupein, W.; Graeff-Hönninger, S. (2014). Methane yield potential of novel perennial biogas crops influenced by harvest date. Industrial Crops and Products 58, 194–203. DOI: 10.1016/j.indcrop.2014.04.017 DOI
- Baute, K.; Van Eerd, L.L.; Robinson, D.E.; Sikkema, P.H.; Mushtaq, M.; Gilroyed, B.H. (2018). Comparing the Biomass Yield and Biogas Potential of Phragmites australis with Miscanthus x giganteus and Panicum virgatum Grown in Canada. Energies 11(9), 2198. DOI: 10.3390/en11092198 DOI
- Barbot, Y.; Thomsen, C.; Thomsen, L.; Benz, R. (2015). Anaerobic Digestion of Laminaria japonica Waste from Industrial Production Residues in Laboratory- and Pilot-Scale. Marine Drugs 13(9), 5947–5975. DOI: 10.3390/md13095947 DOI
- Ruf, T.; Emmerling, C. (2018). Site-adapted production of bioenergy feedstocks on poorly drained cropland through the cultivation of perennial crops. A feasibility study on biomass yield and biochemical methane potential. Biomass and Bioenergy 119, 429–435. DOI: 10.1016/j.biombioe.2018.10.007 DOI
- Vervaeren, H.; Hostyn, K.; Ghekiere, G.; Willems, B. (2010). Biological ensilage additives as pretreatment for maize to increase the biogas production. Renewable Energy 35(9), 2089–2093. DOI: 10.1016/j.renene.2010.02.010 DOI
Alle bronnen van de site: bibliografie.
Andere substraten in de groep “Energiegewassen en hele-plantgewassen (WCS)”
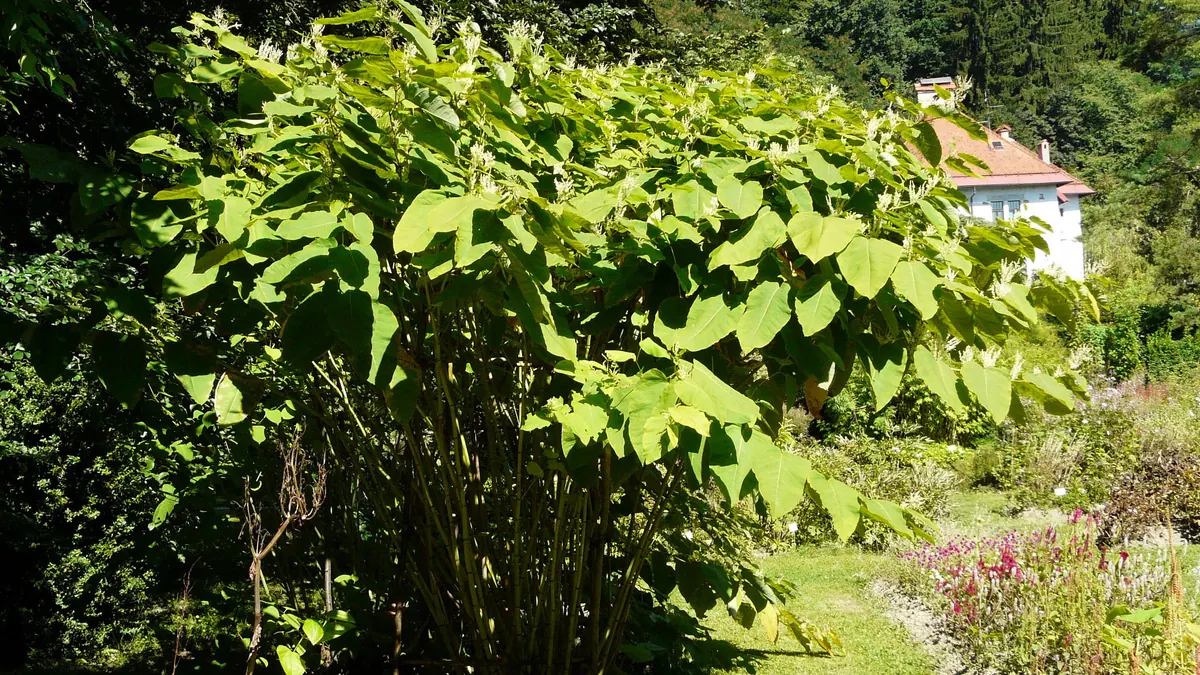
Giant knotweed (incl. Igniscum) — BMP: 10 onderzoeken, gewogen gemiddelde 192 m³ CH₄/t oDS
192 m³ CH₄/t oDS gewogen gemiddelde uit 10 onderzoeken
neutraal — redactionele beoordeling voor biogasinstallaties≈53 %
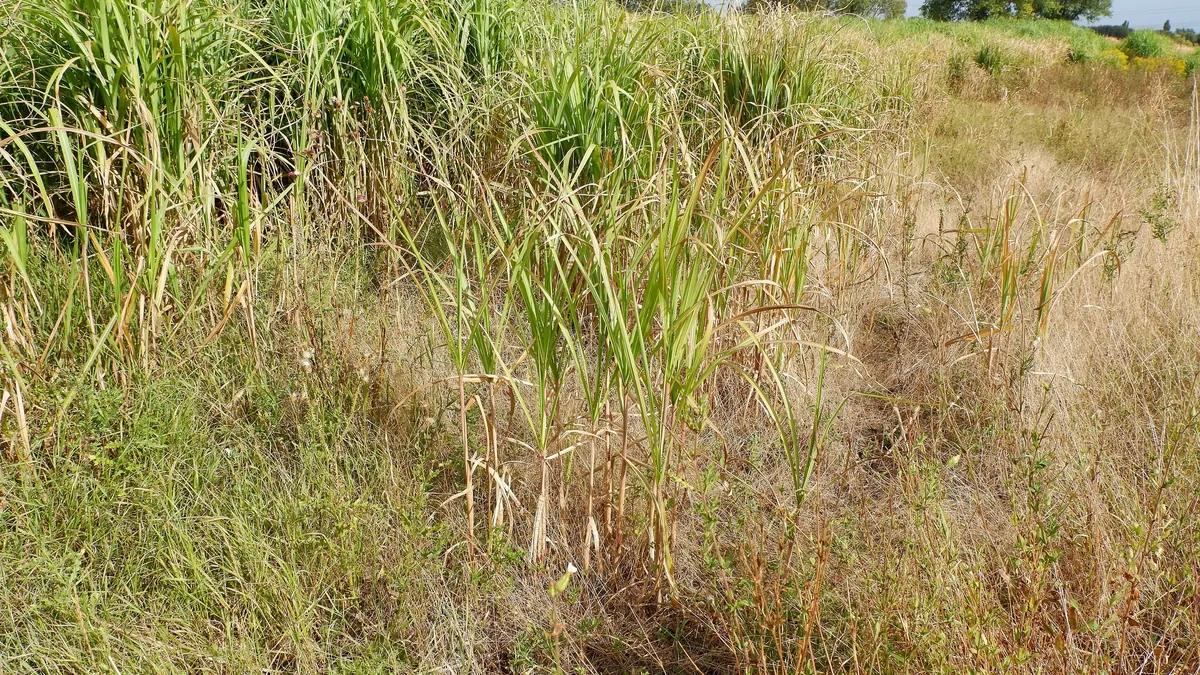
Miscanthus (silvergrass) — BMP: 8 onderzoeken, gewogen gemiddelde 229 m³ CH₄/t oDS
229 m³ CH₄/t oDS gewogen gemiddelde uit 8 onderzoeken
goed — redactionele beoordeling voor biogasinstallaties≈52 %
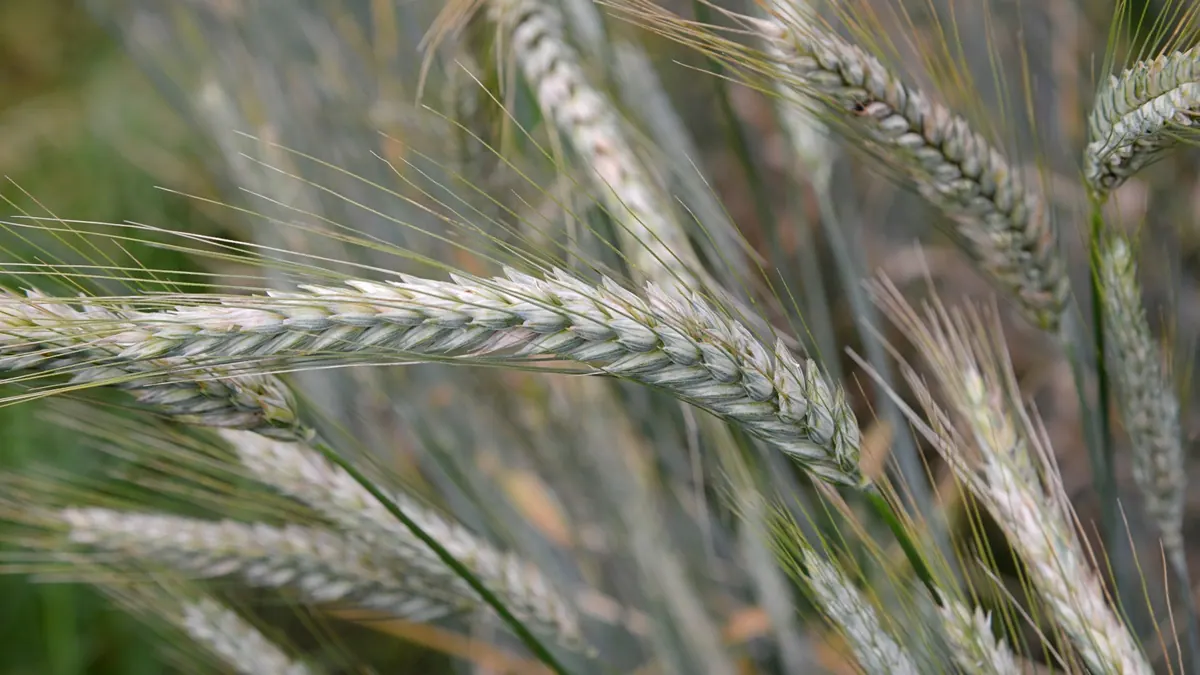
Triticale, whole crop — BMP: 19 onderzoeken, gewogen gemiddelde 315 m³ CH₄/t oDS
315 m³ CH₄/t oDS gewogen gemiddelde uit 19 onderzoeken
zeer goed — redactionele beoordeling voor biogasinstallaties64 %
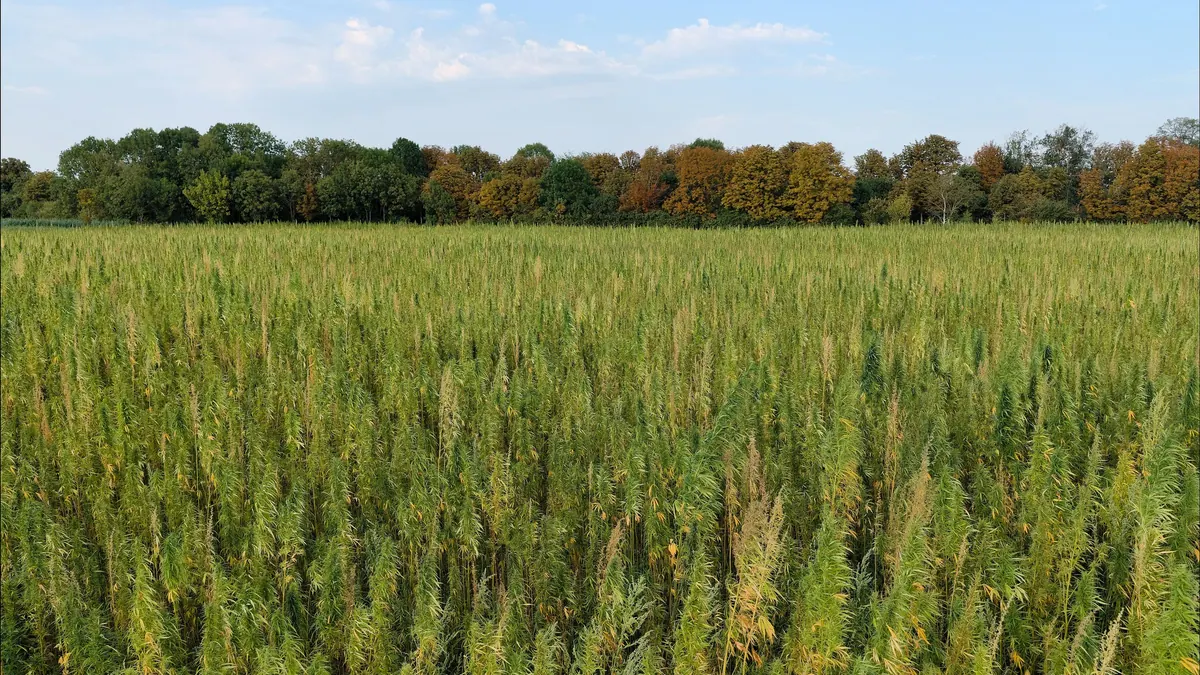
Hemp, stalks and whole plant — BMP: 3 onderzoeken, gewogen gemiddelde 242 m³ CH₄/t oDS
242 m³ CH₄/t oDS gewogen gemiddelde uit 3 onderzoeken
≈52 %