

BMP testingEnergy crops and whole-crop plants (WCS)
Maize silage (whole crop) — BMP: 82 studies, weighted mean 341 m³ CH₄/t VS
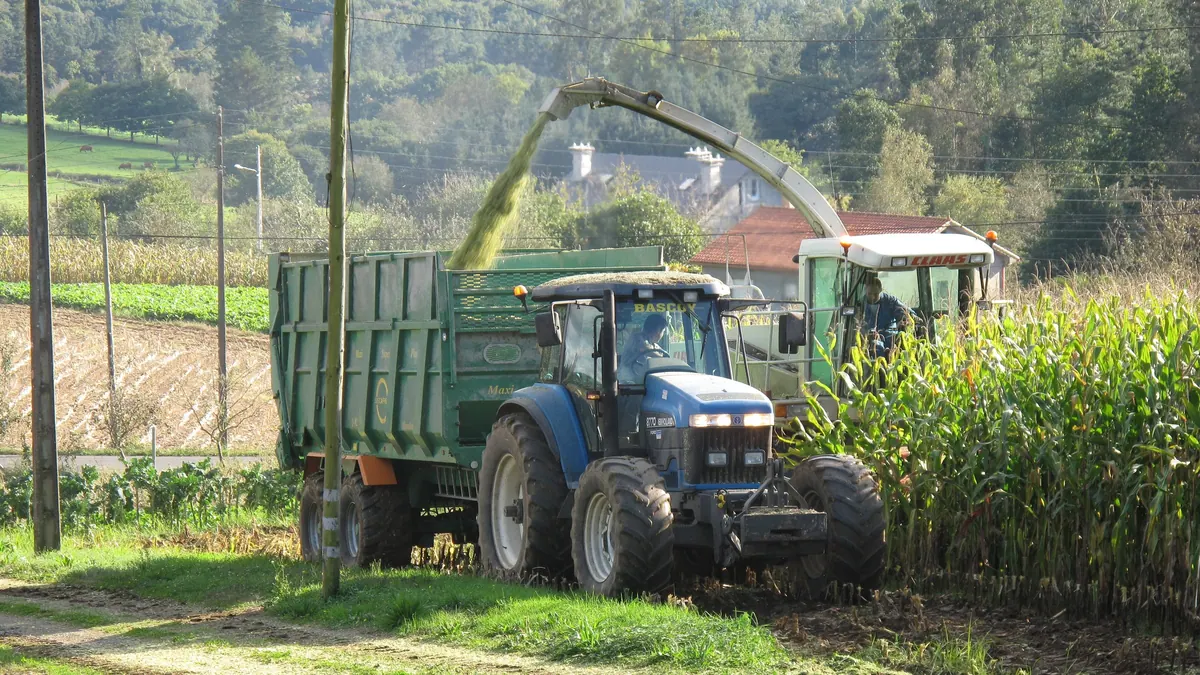
Maize silage is the basic energy substrate of agricultural biogas plants in Europe. Rich in starch and readily available compounds, with stable parameters and good storability.
Photo Luis Miguel Bugallo Sánchez (user Lmbuga) / Wikimedia Commons, licence CC BY-SA 3.0, source file; changes: cropping

- Weighted mean
- 341m³ CH₄/t VS
- Range
- 245–480m³ CH₄/t VS
- Records
- 82studies
- Publications
- 17sources
- Temperatures
- 35 °C, 36 °C, 37 °C, 38 °C, 40 °Cof the test
Methane in biogas
Medium methane content · ≈ 5.9 kWh/m³ of biogas
measured mean of 1 study BMP; in a batch test the CH₄ share tends to be higher than in a plant.
Rating for biogas plants
very good — editorial rating for biogas plantsWorth accepting even for free or with a payment to the supplier
Potential per tonne of fresh matter: very high (110 m³ CH₄/t); process risk: acidification. No additional handling requirements.
Why? Rating factors
Potential per tonne +3
- +3potential 110 m³ CH₄/t fresh matter (BMP 341 × DM 33.6 % × VS 95.8 %)
Process stability −0.5
- −0.5acidification: rapid degradation / acidic pH, risk of VFA accumulation, needs buffering
Handling and costs 0
- 0no factors
Total points: 2.5 · thresholds: ≥ 2.5 very good, ≥ 1 good, below — neutral; negative with cumulative process risk.
Add to the co-digestion calculator CSV data
BMP curves from 82 studies
Weighted mean Individual records
Dashed lines are a model curve (first-order kinetics, B(t) = B₀·(1 − e−kt)); the end point comes from the publication. All curves are model curves.
Cumulative methane production over the test [m³ CH₄/t VS]. The thick line is the weighted mean of all records (341); dots mark the end values given in the publications. Point at the chart to read values; click a legend item to hide or show a record.
Show the remaining records in the legend (70)
Records and sources
Download CSV| Source | BMP m³ CH₄/t VS | CH₄ in biogas % vol., measured | Temperature | Sample | Curve |
|---|---|---|---|---|---|
| Amon et al. (2007) · 1 DOI | 268 | — | 38 °C · mesophilic | Maize | end point (model curve) |
| Amon et al. (2007) · 2 DOI | 280 | — | 38 °C · mesophilic | Maize | end point (model curve) |
| Amon et al. (2007) · 3 DOI | 283 | — | 38 °C · mesophilic | Maize | end point (model curve) |
| Amon et al. (2007) · 4 DOI | 287 | — | 38 °C · mesophilic | Maize | end point (model curve) |
| Amon et al. (2007) · 5 DOI | 302 | — | 38 °C · mesophilic | Maize | end point (model curve) |
| Amon et al. (2007) · 6 DOI | 313 | — | 38 °C · mesophilic | Maize | end point (model curve) |
| Amon et al. (2007) · 7 DOI | 326 | — | 38 °C · mesophilic | Maize | end point (model curve) |
| Amon et al. (2007) · 8 DOI | 334 | — | 38 °C · mesophilic | Maize | end point (model curve) |
| Amon et al. (2007) · 9 DOI | 366 | — | 38 °C · mesophilic | Maize | end point (model curve) |
| Amon et al. (2007) · 10 DOI | 390 | — | 38 °C · mesophilic | Maize Silage | end point (model curve) |
| Neureiter (2005) · 1 | 338 | — | 35 °C · mesophilic | Maize · pretreatment: Silage 44 days | end point (model curve) |
| Neureiter (2005) · 2 | 355 | — | 35 °C · mesophilic | Maize · pretreatment: Silage 44 days Not compressed | end point (model curve) |
| Neureiter (2005) · 3 | 383 | — | 35 °C · mesophilic | Maize | end point (model curve) |
| Neureiter (2005) · 4 | 405 | — | 35 °C · mesophilic | Maize · pretreatment: Silage 119 days Not compressed | end point (model curve) |
| Neureiter (2005) · 5 | 480 | — | 35 °C · mesophilic | Maize · pretreatment: Silage 119 days | end point (model curve) |
| Perez Lopez (2005) · 1 | 319 | — | 35 °C · mesophilic | Corn ((Whole crop maize silage)) · pretreatment: Silage | end point (model curve) |
| Perez Lopez (2005) · 2 | 335 | — | 35 °C · mesophilic | Corn ((Whole crop maize silage)) · pretreatment: Silage | end point (model curve) |
| Perez Lopez (2005) · 3 | 350 | — | 35 °C · mesophilic | Corn ((Whole crop maize silage)) · pretreatment: Silage | end point (model curve) |
| Perez Lopez (2005) · 4 | 391 | — | 35 °C · mesophilic | Corn ((Whole crop maize silage)) | end point (model curve) |
| Perez Lopez (2005) · 5 | 435 | — | 35 °C · mesophilic | Corn ((Whole crop maize silage)) | end point (model curve) |
| Pouech (b.r.) | 397 | 58.9 % | 40 °C · mesophilic | Corn | end point (model curve) |
| Dubrovskis i Plume (2017) DOI | 335 | — | 38 °C · mesophilic | Corn silage (IN+CS, no additives) | end point (model curve) |
| Kaiser (2007) · 1 | 245 | — | 37 °C · mesophilic | maize | end point (model curve) |
| Kaiser (2007) · 2 | 248 | — | 37 °C · mesophilic | maize | end point (model curve) |
| Kaiser (2007) · 3 | 272 | — | 37 °C · mesophilic | maize | end point (model curve) |
| Kaiser (2007) · 4 | 275 | — | 37 °C · mesophilic | maize | end point (model curve) |
| Kaiser (2007) · 5 | 278 | — | 37 °C · mesophilic | maize | end point (model curve) |
| Kaiser (2007) · 6 | 284 | — | 37 °C · mesophilic | maize | end point (model curve) |
| Kaiser (2007) · 7 | 288 | — | 37 °C · mesophilic | maize | end point (model curve) |
| Kaiser (2007) · 8 | 290 | — | 37 °C · mesophilic | maize | end point (model curve) |
| Kaiser (2007) · 9 | 293 | — | 37 °C · mesophilic | maize | end point (model curve) |
| Kaiser (2007) · 10 | 298 | — | 37 °C · mesophilic | maize | end point (model curve) |
| Kaiser (2007) · 11 | 319 | — | 37 °C · mesophilic | maize | end point (model curve) |
| Kaiser (2007) · 12 | 324 | — | 37 °C · mesophilic | maize | end point (model curve) |
| Kaiser (2007) · 13 | 327 | — | 37 °C · mesophilic | maize | end point (model curve) |
| Kaiser (2007) · 14 | 328 | — | 37 °C · mesophilic | maize | end point (model curve) |
| Kaiser (2007) · 15 | 331 | — | 37 °C · mesophilic | maize | end point (model curve) |
| Kaiser (2007) · 16 | 332 | — | 37 °C · mesophilic | maize | end point (model curve) |
| Kaiser (2007) · 17 | 339 | — | 37 °C · mesophilic | maize | end point (model curve) |
| Kaiser (2007) · 18 | 344 | — | 37 °C · mesophilic | maize | end point (model curve) |
| Kaiser (2007) · 19 | 345 | — | 37 °C · mesophilic | maize | end point (model curve) |
| Kaiser (2007) · 20 | 346 | — | 37 °C · mesophilic | maize | end point (model curve) |
| Kaiser (2007) · 21 | 348 | — | 37 °C · mesophilic | maize | end point (model curve) |
| Kaiser (2007) · 22 | 349 | — | 37 °C · mesophilic | maize | end point (model curve) |
| Kaiser (2007) · 23 | 351 | — | 37 °C · mesophilic | maize | end point (model curve) |
| Kaiser (2007) · 24 | 352 | — | 37 °C · mesophilic | maize | end point (model curve) |
| Kaiser (2007) · 25 | 353 | — | 37 °C · mesophilic | maize | end point (model curve) |
| Kaiser (2007) · 26 | 360 | — | 37 °C · mesophilic | maize | end point (model curve) |
| Kaiser (2007) · 27 | 362 | — | 37 °C · mesophilic | maize | end point (model curve) |
| Kaiser (2007) · 28 | 374 | — | 37 °C · mesophilic | maize | end point (model curve) |
| Kaiser (2007) · 29 | 396 | — | 37 °C · mesophilic | maize | end point (model curve) |
| Kaiser (2007) · 30 | 398 | — | 37 °C · mesophilic | maize | end point (model curve) |
| Kaiser (2007) · 31 | 421 | — | 37 °C · mesophilic | maize | end point (model curve) |
| Kaiser (2007) · 32 | 432 | — | 37 °C · mesophilic | maize | end point (model curve) |
| Koch et al. (2017) · 1 DOI | 332 | — | 38 °C · mesophilic | maize | end point (model curve) |
| Koch et al. (2017) · 2 DOI | 335 | — | 38 °C · mesophilic | maize | end point (model curve) |
| Koch et al. (2017) · 3 DOI | 340 | — | 38 °C · mesophilic | maize | end point (model curve) |
| Koch et al. (2017) · 4 DOI | 345 | — | 38 °C · mesophilic | maize | end point (model curve) |
| Koch et al. (2017) · 5 DOI | 350 | — | 38 °C · mesophilic | maize | end point (model curve) |
| Koch et al. (2017) · 6 DOI | 355 | — | 38 °C · mesophilic | maize | end point (model curve) |
| Kolbl et al. (2014) DOI | 256 | — | 38 °C · mesophilic | Silo Maize | end point (model curve) |
| Kolbl (2014) | 438 | — | 38 °C · mesophilic | Maize Silage | end point (model curve) |
| Labatut et al. (2011) DOI | 296 | — | 35 °C · mesophilic | corn silage | end point (model curve) |
| Lallement et al. (2023) · 1 DOI | 272 | — | 38 °C · mesophilic | maize | end point (model curve) |
| Lallement et al. (2023) · 2 DOI | 301 | — | 38 °C · mesophilic | Maize | end point (model curve) |
| Lallement et al. (2023) · 3 DOI | 319 | — | 38 °C · mesophilic | Maize | end point (model curve) |
| Lallement et al. (2023) · 4 DOI | 335 | — | 38 °C · mesophilic | Maize | end point (model curve) |
| Lallement et al. (2023) · 5 DOI | 336 | — | 38 °C · mesophilic | maize | end point (model curve) |
| Lallement et al. (2023) · 6 DOI | 376 | — | 38 °C · mesophilic | Maize | end point (model curve) |
| Lallement et al. (2023) · 7 DOI | 384 | — | 38 °C · mesophilic | Maize | end point (model curve) |
| Lallement et al. (2023) · 8 DOI | 418 | — | 38 °C · mesophilic | Maize | end point (model curve) |
| Luna-delRisco et al. (2011) · 1 | 286 | — | 36 °C · mesophilic | maize silage · pretreatment: particle size reduction/sample preparation (MY-D: physical treatment) | end point (model curve) |
| Luna-delRisco et al. (2011) · 2 | 307 | — | 36 °C · mesophilic | maize silage · pretreatment: particle size reduction/sample preparation (MY-D: physical treatment) | end point (model curve) |
| Luna-delRisco et al. (2011) · 3 | 328 | — | 36 °C · mesophilic | maize silage · pretreatment: particle size reduction/sample preparation (MY-D: physical treatment) | end point (model curve) |
| Mast et al. (2014) DOI | 349 | — | 37 °C · mesophilic | maize | end point (model curve) |
| Baute et al. (2018) DOI | 335 | — | 38 °C · mesophilic | Zea mays silage | end point (model curve) |
| Barbot et al. (2015) DOI | 303 | — | 37 °C · mesophilic | Maize silage, untreated (MS-untreated, experiment E3) | end point (model curve) |
| Ruf i Emmerling (2018) · 1 DOI | 282 | — | 38 °C · mesophilic | maize · pretreatment: particle size reduction/sample preparation (MY-D: physical treatment) | end point (model curve) |
| Ruf i Emmerling (2018) · 2 DOI | 288 | — | 38 °C · mesophilic | maize · pretreatment: particle size reduction/sample preparation (MY-D: physical treatment) | end point (model curve) |
| Ruf i Emmerling (2018) · 3 DOI | 335 | — | 38 °C · mesophilic | maize · pretreatment: particle size reduction/sample preparation (MY-D: physical treatment) | end point (model curve) |
| Ruf i Emmerling (2018) · 4 DOI | 347 | — | 38 °C · mesophilic | maize · pretreatment: particle size reduction/sample preparation (MY-D: physical treatment) | end point (model curve) |
| Vervaeren et al. (2010) DOI | 378 | — | 37 °C · mesophilic | untreated Maize | end point (model curve) |
| Weighted mean | 341 | 58.9 % | arithmetic mean 337, SD 47 | ||
Typical composition
- Dry matter (DM)
- 33.6% (range 8.2–89.6)
- Volatile solids (VS)
- 95.8 % DM (range 75.9–98)
- Nitrogen
- 1.1 % DM
- C/N ratio
- 44
Median and range of the determinations reported in the publications behind this substrate's BMP records (read from: CROPGEN D4, MY-D); dry matter: 57 determinations, volatile solids: 43 determinations. C/N was calculated as the ratio of C and N content (% DM) from the same source. The DM range includes fresh samples as well as samples partly dried or dried before the test – for fresh material the lower part of the range applies, ideally your own measurement.
Sources: Neureiter (2005); Perez Lopez (2005); Pouech, P. Fruteau, H. Bewa, H.. Agricultural crops for…; Kaiser (2007); Koch et al. (2017); Kolbl et al. (2014); Kolbl (2014); Labatut et al. (2011); Lallement et al. (2023); Luna-delRisco et al. (2011); Ruf et al. (2018); Vervaeren et al. (2010).
The composition of the raw material varies between batches — for plant calculations use an analysis of your own sample. The calculator inserts typical values automatically.
Process properties
Advantages
- Methane potential in the database: weighted mean 341 m³ CH₄/t VS (median 335; range 245-480; 82 records from 17 sources).
- The basic energy substrate in Europe; the largest database (82 records from 17 sources), easy to store and dose.
- Ensiling, enzymatic additives and pretreatment improve the result (Vervaeren 2010, Dubrovskis 2017, Pérez-López 2005).
- The dominant energy substrate in agricultural biogas plants (review by Weiland 2010).
Drawbacks and risks
- Silage alone as a mono-substrate is often poor in trace elements; the review by Weiland 2010 discusses the need to supplement them.
- A high content of easily degradable carbohydrates loads the system without a buffer (Chen 2008).
Co-digestion — what to combine it with, what to watch out for
- combines well
group: Animal excreta (slurry, manure, poultry litter)
Slurry supplies alkalinity and trace elements.[1]
- caution
substrates: fat-rich — e.g. Food waste, Spent coffee grounds, Primary sludge, Sunflower seeds, Olive pomace / olive mill solid waste
A fat load from other substrates with a large share of easily degradable silage raises the risk of overload (LCFA, Chen 2008, Palatsi 2009).[2][3]
Dosing
No single source limit on the share. The effect of the type of inoculum on the BMP result of dry maize is small (Koch 2017).
Practical requirements
- Ensiling makes it possible to store seasonal biomass; properly ensiled plants (in the study maize, sorghum, forage rye, triticale) can be stored for up to a year without loss of methane production (Herrmann et al. 2011).
Sources of the process data
- Weiland, P. (2010) Biogas production: current state and perspectives. Applied Microbiology and Biotechnology
- Chen, Y.; Cheng, J.J.; Creamer, K.S. (2008) Inhibition of anaerobic digestion process: A review. Bioresource Technology
- Palatsi, J. et al. (2009) Strategies for recovering inhibition caused by long chain fatty acids on anaerobic thermophilic biogas reactors. Bioresource Technology
- Amon, T.; Amon, B.; Kryvoruchko, V.; Machmüller, A.; Hopfner-Sixt, K.; Bodiroza, V.; Hrbek, R.; Friedel, J.; Pötsch, E.; Wagentristl, H.; Schreiner, M.; Zollitsch, W. (2007) Methane production through anaerobic digestion of various energy crops grown in sustainable crop rotations. Bioresource Technology 98(17), 3204–3212
- Neureiter,M. Teixeira Pereira dos Santos, J. Perez Lopez, C. Pichler, H. Kirchmayr, R and Braun, R. (2005) Effect of silage preparation on methane yields of whole crop maize silages. ADSW 2005 Conference Proceedings Vol 1. 109-115
- Perez Lopez, C. Kirchmayr, R. Neureiter, M. Braun, R. (2005) Effect of physical and chemical pretreatments on methane yield from maize silage and grains. ADSW 2005 Conference Proceedings Vol 2. 204-208
- Pouech, P. Fruteau, H. Bewa, H. (None) Agricultural crops for biogas production on anaerobic digestion plants. Biomass for energy and industry 163-165
- Dubrovskis, V.; Plume, I. (2017) Enzymatic and catalystic enchancement of methane production from corn silage and grain residues. Engineering for Rural Development
- Kaiser, F.L. (2007) Einfluss der stofflichen Zusammensetzung auf die Verdaulichkeit nachwachsender Rohstoffe beim anaeroben Abbau in Biogasreaktoren. Dissertation, Technische Universität München, Wissenschaftszentrum Weihenstephan
- Koch, K.; Lippert, T.; Drewes, J.E. (2017) The role of inoculum’s origin on the methane yield of different substrates in biochemical methane potential (BMP) tests. Bioresource Technology 243, 457–463
- Kolbl, S.; Paloczi, A.; Panjan, J.; Stres, B. (2014) Addressing case specific biogas plant tasks: Industry oriented methane yields derived from 5L Automatic Methane Potential Test Systems in batch or semi-continuous tests using realistic inocula, substrate particle sizes and organic loading. Bioresource Technology 153, 180–188
- Kolbl, S. (2014) Izboljšava anaerobne presnove blata iz komunalnih čistilnih naprav in lignoceluloznih substratov pri pridobivanju bioplina. Rozprawa doktorska, Univerza v Ljubljani, Fakulteta za gradbeništvo in geodezijo
- Labatut, R.A.; Angenent, L.T.; Scott, N.R. (2011) Biochemical methane potential and biodegradability of complex organic substrates. Bioresource Technology 102(3), 2255–2264
- Lallement, A.; Peyrelasse, C.; Lagnet, C.; Barakat, A.; Schraauwers, B.; Maunas, S.; Monlau, F. (2023) A Detailed Database of the Chemical Properties and Methane Potential of Biomasses Covering a Large Range of Common Agricultural Biogas Plant Feedstocks. Waste 1(1), 195–227
- Luna-delRisco, M.; Normak, A.; Orupõld, K. (2011) Biochemical methane potential of different organic wastes and energy crops from Estonia. Agronomy Research 9(1–2), 331–342
- Mast, B.; Lemmer, A.; Oechsner, H.; Reinhardt-Hanisch, A.; Claupein, W.; Graeff-Hönninger, S. (2014) Methane yield potential of novel perennial biogas crops influenced by harvest date. Industrial Crops and Products 58, 194–203
- Baute, K.; Van Eerd, L.L.; Robinson, D.E.; Sikkema, P.H.; Mushtaq, M.; Gilroyed, B.H. (2018) Comparing the Biomass Yield and Biogas Potential of Phragmites australis with Miscanthus x giganteus and Panicum virgatum Grown in Canada. Energies 11(9), 2198
- Barbot, Y.; Thomsen, C.; Thomsen, L.; Benz, R. (2015) Anaerobic Digestion of Laminaria japonica Waste from Industrial Production Residues in Laboratory- and Pilot-Scale. Marine Drugs 13(9), 5947–5975
- Ruf, T.; Emmerling, C. (2018) Site-adapted production of bioenergy feedstocks on poorly drained cropland through the cultivation of perennial crops. A feasibility study on biomass yield and biochemical methane potential. Biomass and Bioenergy 119, 429–435
- Vervaeren, H.; Hostyn, K.; Ghekiere, G.; Willems, B. (2010) Biological ensilage additives as pretreatment for maize to increase the biogas production. Renewable Energy 35(9), 2089–2093
- Herrmann et al. (2011). Effects of ensiling, silage additives and storage period on methane formation of biogas crops. Bioresour. Technol.
The co-digestion calculator will assess a specific mixture containing this substrate.
What it is and where it comes from
Maize silage is made from whole plants cut at wax ripeness, chopped with a forage harvester and ensiled in a bunker silo or clamp. It is the basic feed of dairy cattle and at the same time the most commonly used plant substrate in agricultural biogas plants in Europe. In Poland its cultivation for silage is widespread, and its use in biogas plants is linked to a debate about the effect on the land market and the environment. The compilation covers many studies from different countries, varieties and harvest dates.
Properties relevant to digestion
Maize combines starch from the grain and readily available sugars with the fibre of the stalk and leaves. As a result a relatively high and rapid biogas yield is obtained, and the risk of inhibition is small. The material stores well after proper ensiling. Because of the low content of nitrogen and trace elements, co-digestion with slurry is beneficial, and in mono-digestion of maize supplementation with trace elements may be needed. Too high a dry matter content hinders compaction, and unground grains reduce the utilisation of starch. Poorly ensiled silage (with butyric acid or mould) has a lower value.
How to read the spread of results
The spread in the compilation is a widely described phenomenon. It is affected by: the earliness group of the variety, the harvest date (dry matter and share of cobs), cutting height, chop length, the form of the material (green forage, silage, dried material), and the year and region of cultivation. The test methodology is also of great importance: temperature, inoculum, the substrate-to-inoculum ratio, test length and the method of gas measurement. Combining many studies increases the spread, but gives a broader picture than a single test. In practice the differences between varieties and harvest dates can be significant.
In biogas plant practice
Maize silage is often the main component of the ration, mixed with slurry, manure or other silages. Key factors are the quality of ensiling (rapid filling of the silo, compaction, a tight cover), control of dry matter and protection against losses. The price and availability depend on the season, and the legal requirements on the share of energy crops in biogas plants may change, so current regulations should be checked. The yield of a batch is worth confirming with a BMP test, particularly when changing variety or supplier.
Methodology in brief
BMP is the amount of methane obtained from volatile solids (VS) in a batch test, given in m³ CH₄ per tonne of VS (numerically the same as NmL CH₄/g VS in the publications) and converted to normal conditions (0 °C, 101.325 kPa). The weighted mean gives each publication a total weight of 1, split equally between its results for the substrate — a paper testing twenty varieties does not outweigh a paper with a single sample. In inter-laboratory programmes the unit is the laboratory (total weight 1), and within it the weight of a test grows with the number of bottles (replicates). Results after pretreatment (e.g. thermal, chemical, enzymatic) are shown separately and are not included in the mean.
Solid lines are curves measured in the tests. Where a publication gives only the final result, we draw a first-order kinetic model, B(t) = B₀·(1 − e−kt): only the end point comes from the publication, and the shape of the curve serves purely as visualisation — do not read the production on a particular day from it. For this substrate k = 0.085 d−1 was assumed (median of rate constants k reported in the sources and/or fitted to the mean measured curves).
The statistics describe the spread of published results — a descriptive compilation, not a meta-analysis or a guarantee of plant yield.
Results after pretreatment (17) — excluded from the mean
| Source | BMP m³ CH₄/t VS | Pretreatment | Sample |
|---|---|---|---|
| Perez Lopez (2005) | 538 | — | Corn |
| Perez Lopez (2005) | 530 | — | Corn |
| Perez Lopez (2005) | 431 | — | Corn ((Whole crop maize silage)) |
| Perez Lopez (2005) | 409 | — | Corn ((Whole crop maize silage)) |
| Perez Lopez (2005) | 422 | — | Corn ((Whole crop maize silage)) |
| Perez Lopez (2005) | 538 | — | Corn ((Whole crop maize silage)) |
| Perez Lopez (2005) | 584 | — | Corn ((Whole crop maize silage)) |
| Perez Lopez (2005) | 597 | — | Corn ((Whole crop maize silage)) |
| Perez Lopez (2005) | 539 | — | Corn ((Whole crop maize silage)) |
| Neureiter (2005) | 348 | — | Maize |
| Neureiter (2005) | 377 | — | Maize |
| Neureiter (2005) | 414 | — | Maize |
| Neureiter (2005) | 423 | — | Maize |
| Neureiter (2005) | 419 | — | Maize |
| Neureiter (2005) | 486 | — | Maize |
| Neureiter (2005) | 427 | — | Maize |
| Neureiter (2005) | 537 | — | Maize |
Bibliography
- Amon, T.; Amon, B.; Kryvoruchko, V.; Machmüller, A.; Hopfner-Sixt, K.; Bodiroza, V.; Hrbek, R.; Friedel, J.; Pötsch, E.; Wagentristl, H.; Schreiner, M.; Zollitsch, W. (2007). Methane production through anaerobic digestion of various energy crops grown in sustainable crop rotations. Bioresource Technology 98(17), 3204–3212. DOI: 10.1016/j.biortech.2006.07.007 DOI
- Neureiter,M. Teixeira Pereira dos Santos, J. Perez Lopez, C. Pichler, H. Kirchmayr, R and Braun, R. (2005). Effect of silage preparation on methane yields of whole crop maize silages. ADSW 2005 Conference Proceedings Vol 1. 109-115.
- Perez Lopez, C. Kirchmayr, R. Neureiter, M. Braun, R. (2005). Effect of physical and chemical pretreatments on methane yield from maize silage and grains. ADSW 2005 Conference Proceedings Vol 2. 204-208.
- Pouech, P. Fruteau, H. Bewa, H.. Agricultural crops for biogas production on anaerobic digestion plants. Biomass for energy and industry 163-165.
- Dubrovskis, V.; Plume, I. (2017). Enzymatic and catalystic enchancement of methane production from corn silage and grain residues. Engineering for Rural Development. DOI: 10.22616/erdev2017.16.n088 DOI
- Kaiser, F.L. (2007). Einfluss der stofflichen Zusammensetzung auf die Verdaulichkeit nachwachsender Rohstoffe beim anaeroben Abbau in Biogasreaktoren. Dissertation, Technische Universität München, Wissenschaftszentrum Weihenstephan. https://mediatum.ub.tum.de/631394 source
- Koch, K.; Lippert, T.; Drewes, J.E. (2017). The role of inoculum’s origin on the methane yield of different substrates in biochemical methane potential (BMP) tests. Bioresource Technology 243, 457–463. DOI: 10.1016/j.biortech.2017.06.142 DOI
- Kolbl, S.; Paloczi, A.; Panjan, J.; Stres, B. (2014). Addressing case specific biogas plant tasks: Industry oriented methane yields derived from 5L Automatic Methane Potential Test Systems in batch or semi-continuous tests using realistic inocula, substrate particle sizes and organic loading. Bioresource Technology 153, 180–188. DOI: 10.1016/j.biortech.2013.12.010 DOI
- Kolbl, S. (2014). Izboljšava anaerobne presnove blata iz komunalnih čistilnih naprav in lignoceluloznih substratov pri pridobivanju bioplina. Rozprawa doktorska, Univerza v Ljubljani, Fakulteta za gradbeništvo in geodezijo.
- Labatut, R.A.; Angenent, L.T.; Scott, N.R. (2011). Biochemical methane potential and biodegradability of complex organic substrates. Bioresource Technology 102(3), 2255–2264. DOI: 10.1016/j.biortech.2010.10.035 DOI
- Lallement, A.; Peyrelasse, C.; Lagnet, C.; Barakat, A.; Schraauwers, B.; Maunas, S.; Monlau, F. (2023). A Detailed Database of the Chemical Properties and Methane Potential of Biomasses Covering a Large Range of Common Agricultural Biogas Plant Feedstocks. Waste 1(1), 195–227. DOI: 10.3390/waste1010014 DOI
- Luna-delRisco, M.; Normak, A.; Orupõld, K. (2011). Biochemical methane potential of different organic wastes and energy crops from Estonia. Agronomy Research 9(1–2), 331–342. https://www.semanticscholar.org/paper/25cf2d7bba4758136830a9a02caf3ecd997173bb source
- Mast, B.; Lemmer, A.; Oechsner, H.; Reinhardt-Hanisch, A.; Claupein, W.; Graeff-Hönninger, S. (2014). Methane yield potential of novel perennial biogas crops influenced by harvest date. Industrial Crops and Products 58, 194–203. DOI: 10.1016/j.indcrop.2014.04.017 DOI
- Baute, K.; Van Eerd, L.L.; Robinson, D.E.; Sikkema, P.H.; Mushtaq, M.; Gilroyed, B.H. (2018). Comparing the Biomass Yield and Biogas Potential of Phragmites australis with Miscanthus x giganteus and Panicum virgatum Grown in Canada. Energies 11(9), 2198. DOI: 10.3390/en11092198 DOI
- Barbot, Y.; Thomsen, C.; Thomsen, L.; Benz, R. (2015). Anaerobic Digestion of Laminaria japonica Waste from Industrial Production Residues in Laboratory- and Pilot-Scale. Marine Drugs 13(9), 5947–5975. DOI: 10.3390/md13095947 DOI
- Ruf, T.; Emmerling, C. (2018). Site-adapted production of bioenergy feedstocks on poorly drained cropland through the cultivation of perennial crops. A feasibility study on biomass yield and biochemical methane potential. Biomass and Bioenergy 119, 429–435. DOI: 10.1016/j.biombioe.2018.10.007 DOI
- Vervaeren, H.; Hostyn, K.; Ghekiere, G.; Willems, B. (2010). Biological ensilage additives as pretreatment for maize to increase the biogas production. Renewable Energy 35(9), 2089–2093. DOI: 10.1016/j.renene.2010.02.010 DOI
All sources of the site: bibliography.
Other substrates in the group “Energy crops and whole-crop plants (WCS)”
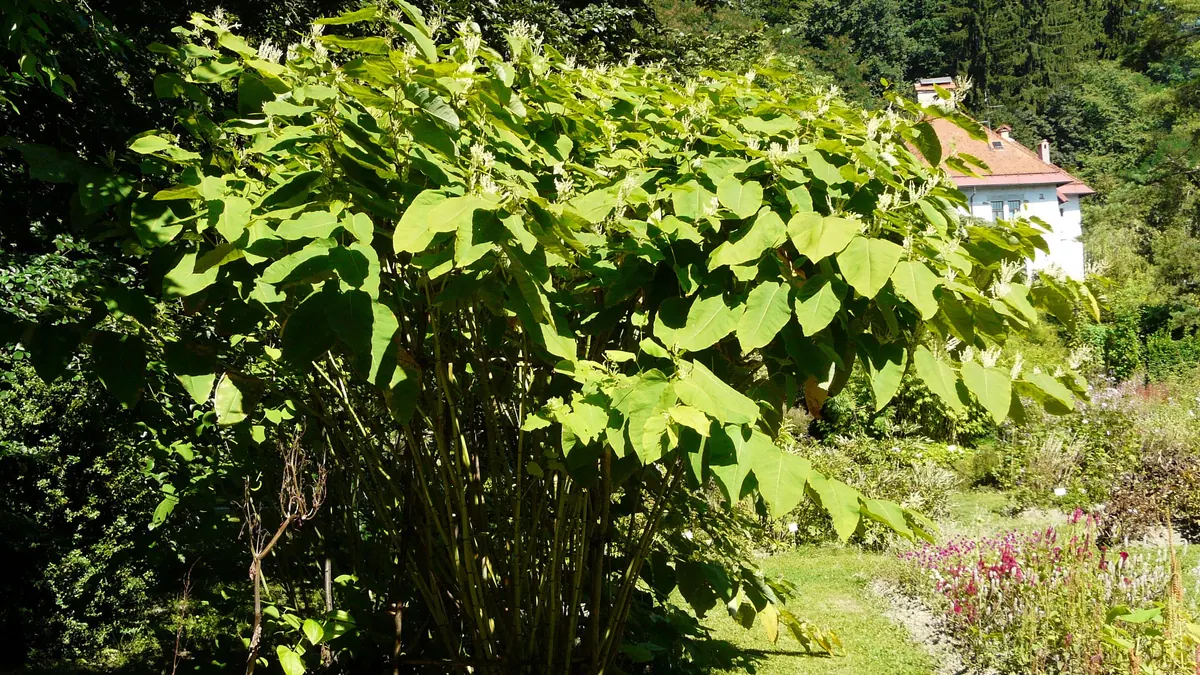
Giant knotweed (incl. Igniscum) — BMP: 10 studies, weighted mean 192 m³ CH₄/t VS
192 m³ CH₄/t VS weighted mean from 10 studies
neutral — editorial rating for biogas plants≈53 %
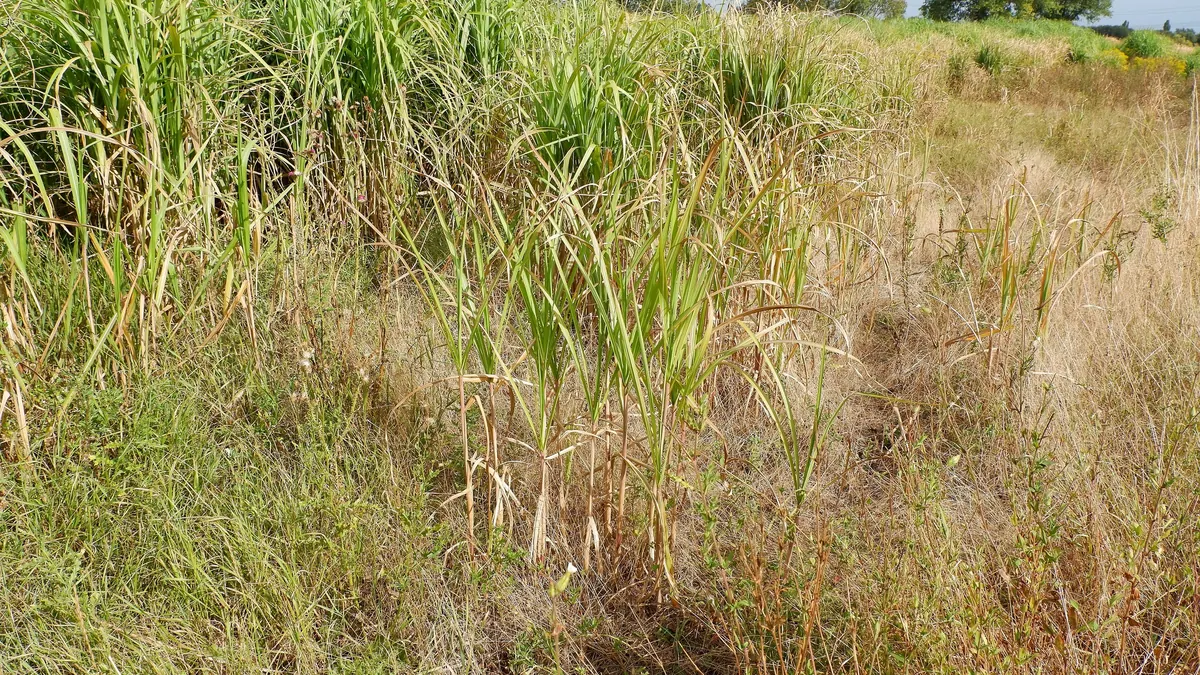
Miscanthus (silvergrass) — BMP: 8 studies, weighted mean 229 m³ CH₄/t VS
229 m³ CH₄/t VS weighted mean from 8 studies
good — editorial rating for biogas plants≈52 %
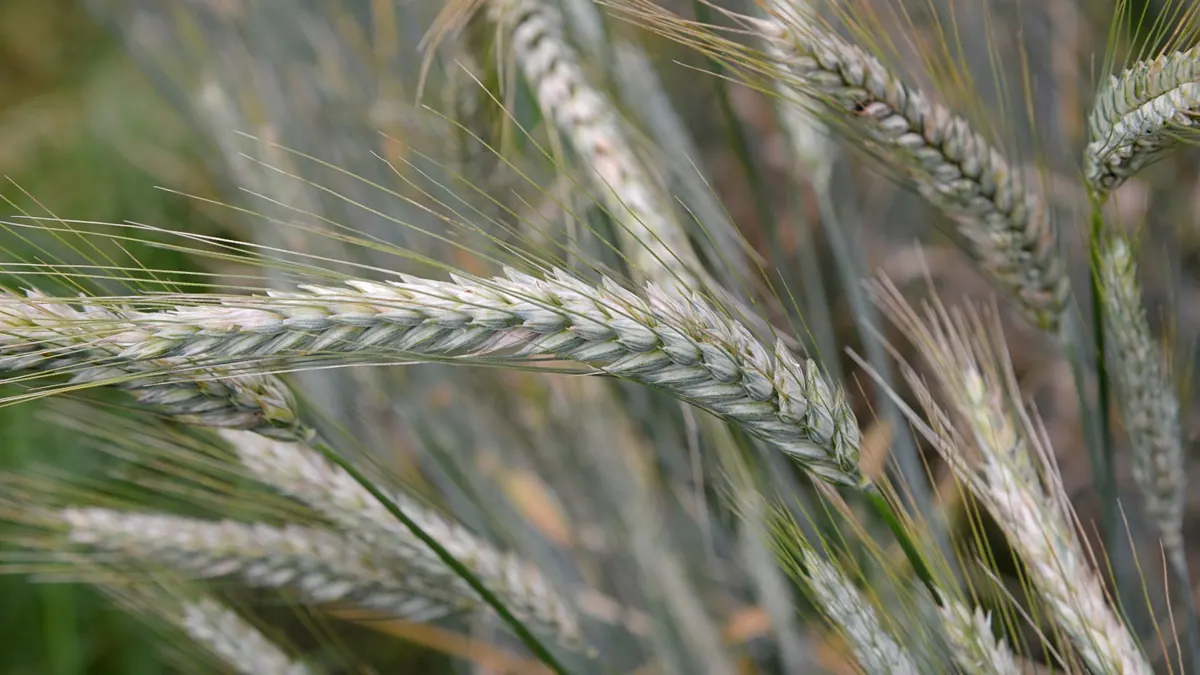
Triticale, whole crop — BMP: 19 studies, weighted mean 315 m³ CH₄/t VS
315 m³ CH₄/t VS weighted mean from 19 studies
very good — editorial rating for biogas plants64 %
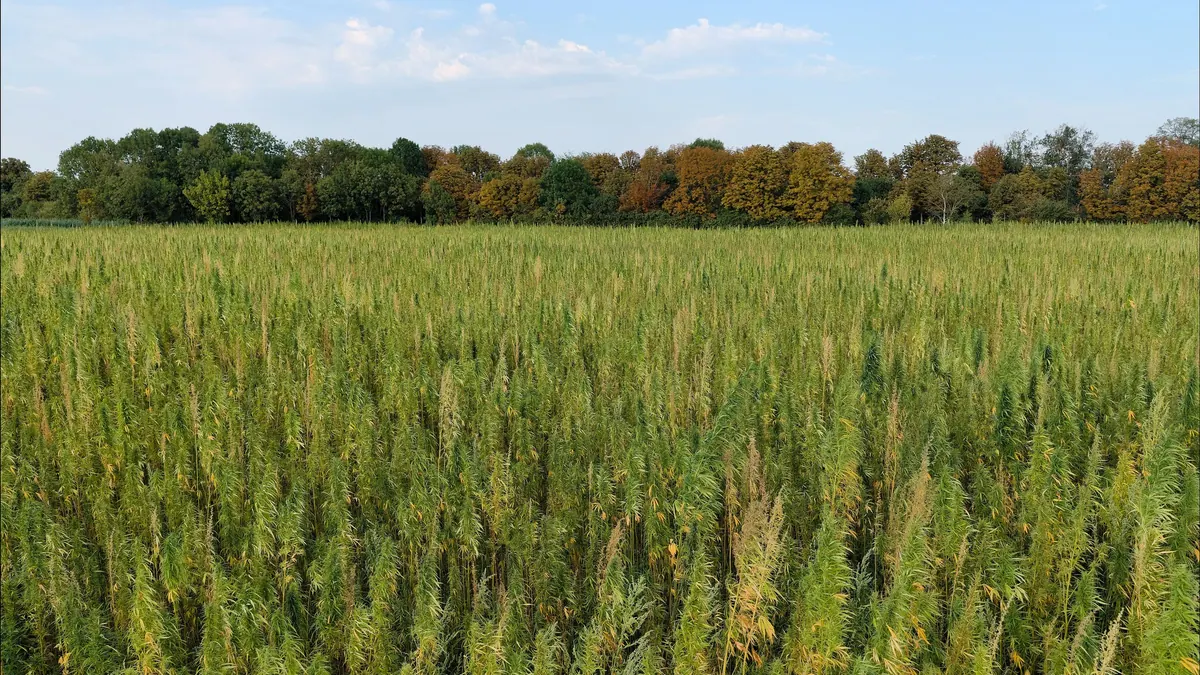
Hemp, stalks and whole plant — BMP: 3 studies, weighted mean 242 m³ CH₄/t VS
242 m³ CH₄/t VS weighted mean from 3 studies
≈52 %