

BMP testingEnergy crops and whole-crop plants (WCS)
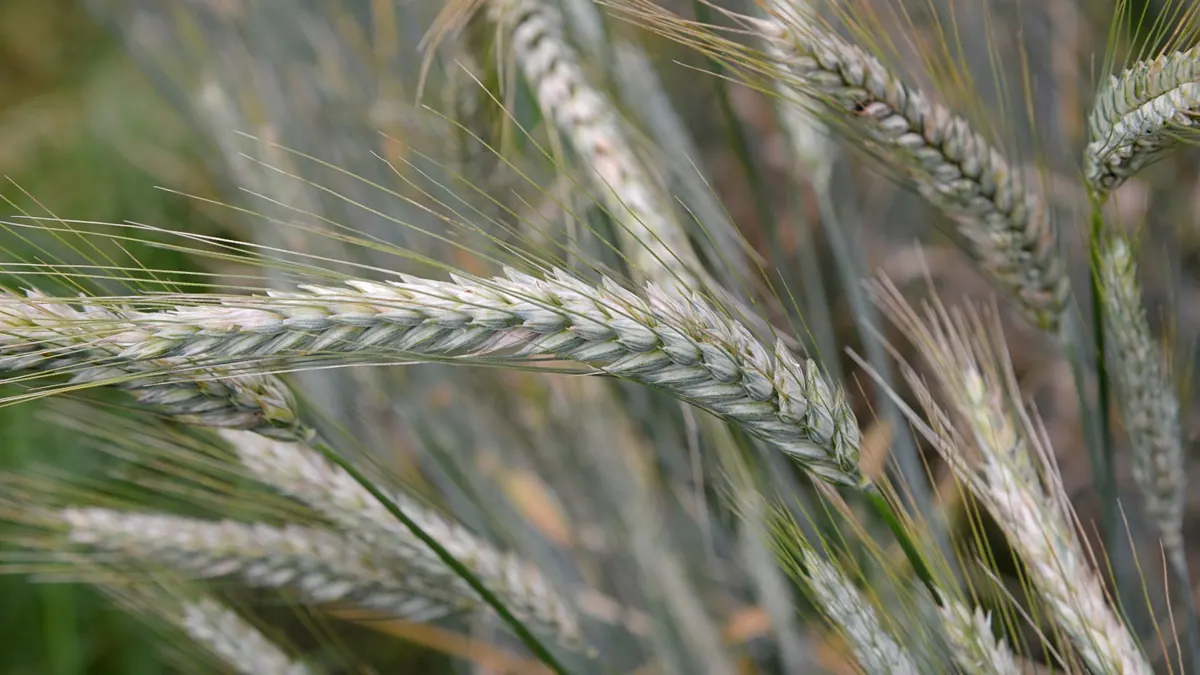
Triticale, whole crop — BMP: 19 studies, weighted mean 315 m³ CH₄/t VS
Triticale as a whole plant (GPS) is green forage harvested before grain maturity, popular in energy crops in colder climates. The records cover different harvest dates.
Photo Rasbak / Wikimedia Commons, licence CC BY-SA 3.0, source file; changes: cropping

- Weighted mean
- 315m³ CH₄/t VS
- Range
- 212–555m³ CH₄/t VS
- Records
- 19studies
- Publications
- 5sources
- Temperatures
- 35 °C, 37 °C, 38 °Cof the test
Methane in biogas
High methane content · ≈ 6.4 kWh/m³ of biogas
measured mean of 5 studies BMP, range 59–69 %; in a batch test the CH₄ share tends to be higher than in a plant.
Rating for biogas plants
very good — editorial rating for biogas plantsWorth accepting even for free or with a payment to the supplier
Potential per tonne of fresh matter: very high (102 m³ CH₄/t); no particular threats to stability. Handling costs: fibres, floating layer.
Why? Rating factors
Potential per tonne +3
- +3potential 102 m³ CH₄/t fresh matter (BMP 315 × DM 34.5 % × VS 94.4 %)
Process stability 0
- 0no factors
Handling and costs −0.5
- −0.5fibres, floating layer — shredding and intensive mixing
Total points: 2.5 · thresholds: ≥ 2.5 very good, ≥ 1 good, below — neutral; negative with cumulative process risk.
Add to the co-digestion calculator CSV data
BMP curves from 19 studies
Weighted mean Individual records
Dashed lines are a model curve (first-order kinetics, B(t) = B₀·(1 − e−kt)); the end point comes from the publication. All curves are model curves.
Cumulative methane production over the test [m³ CH₄/t VS]. The thick line is the weighted mean of all records (315); dots mark the end values given in the publications. Point at the chart to read values; click a legend item to hide or show a record.
Show the remaining records in the legend (7)
Records and sources
Download CSV| Source | BMP m³ CH₄/t VS | CH₄ in biogas % vol., measured | Temperature | Sample | Curve |
|---|---|---|---|---|---|
| Amon et al. (2007) · 1 DOI | 212 | — | 38 °C · mesophilic | Triticale | end point (model curve) |
| Amon et al. (2007) · 2 DOI | 213 | — | 38 °C · mesophilic | Triticale | end point (model curve) |
| Amon et al. (2007) · 3 DOI | 223 | — | 38 °C · mesophilic | Triticale | end point (model curve) |
| Amon et al. (2007) · 4 DOI | 232 | — | 38 °C · mesophilic | Triticale | end point (model curve) |
| Amon et al. (2007) · 5 DOI | 236 | — | 38 °C · mesophilic | Triticale | end point (model curve) |
| Amon et al. (2007) · 6 DOI | 241 | — | 38 °C · mesophilic | Triticale | end point (model curve) |
| Amon et al. (2007) · 7 DOI | 255 | — | 38 °C · mesophilic | Triticale | end point (model curve) |
| Amon et al. (2007) · 8 DOI | 264 | — | 38 °C · mesophilic | Triticale | end point (model curve) |
| Amon et al. (2007) · 9 DOI | 265 | — | 38 °C · mesophilic | Triticale | end point (model curve) |
| Amon et al. (2007) · 10 DOI | 286 | — | 38 °C · mesophilic | Triticale | end point (model curve) |
| Antognoni et al. (2013) · 1 | 324 | — | 37 °C · mesophilic | Triticale Silage harvester | end point (model curve) |
| Antognoni et al. (2013) · 2 | 340 | — | 37 °C · mesophilic | Triticale | end point (model curve) |
| Heiermann (2002) · 1 | 337 | 59.0 % | 35 °C · mesophilic | Triticale | end point (model curve) |
| Heiermann (2002) · 2 | 461 | 63.0 % | 35 °C · mesophilic | Triticale | end point (model curve) |
| Heiermann (2002) · 3 | 509 | 66.0 % | 35 °C · mesophilic | Triticale · pretreatment: Silage in 1L glass vessels packed and sealed for 3 month period | end point (model curve) |
| Heiermann (2002) · 4 | 534 | 69.0 % | 35 °C · mesophilic | Triticale | end point (model curve) |
| Heiermann (2002) · 5 | 555 | 65.0 % | 35 °C · mesophilic | Triticale · pretreatment: Silage in 1L glass vessels packed and sealed for 3 month period | end point (model curve) |
| Kolbl et al. (2014) DOI | 286 | — | 38 °C · mesophilic | Triticale | end point (model curve) |
| Chevalier et al. (2023) DOI | 233 | — | — | Whole triticale (WT), milled control (CM) | end point (model curve) |
| Weighted mean | 315 | 64.4 % | arithmetic mean 316, SD 113 | ||
Typical composition
- Dry matter (DM)
- 34.5% (range 9.1–65.5)
- Volatile solids (VS)
- 94.4 % DM (range 73–97.4)
Median and range of the determinations reported in the publications behind this substrate's BMP records (read from: CROPGEN D4, MY-D); dry matter: 6 determinations, volatile solids: 6 determinations.
Sources: Heiermann (2002); Kolbl et al. (2014).
The composition of the raw material varies between batches — for plant calculations use an analysis of your own sample. The calculator inserts typical values automatically.
Process properties
Advantages
- Methane potential in the database: weighted mean 315 m³ CH₄/t VS (median 265; range 212–555; 19 records from 5 sources).
- Whole-crop cereal silage (WCS) with numerous records (19) and pretreatment studies (Antognoni 2013, Chevalier 2023).
Drawbacks and risks
- Spread of results in the database: standard deviation 113 at a mean of 316 m³ CH₄/t VS (19 records from 5 sources).
Co-digestion — what to combine it with, what to watch out for
- combines well
group: Animal excreta (slurry, manure, poultry litter)
Co-digestion with excreta (slurry/solid manure) is the standard arrangement for plant biomass: they supply alkalinity and microflora.[1][2]
Dosing
No source-based dose limits.
Practical requirements
- Shred: shredding increases the surface available for degradation and speeds it up, but does not necessarily raise the final gas yield (FNR 2010, Ch. 3 “Triturado”).
Sources of the process data
- Amon, T.; Amon, B.; Kryvoruchko, V.; Machmüller, A.; Hopfner-Sixt, K.; Bodiroza, V.; Hrbek, R.; Friedel, J.; Pötsch, E.; Wagentristl, H.; Schreiner, M.; Zollitsch, W. (2007) Methane production through anaerobic digestion of various energy crops grown in sustainable crop rotations. Bioresource Technology 98(17), 3204–3212
- Weiland, P. (2010) Biogas production: current state and perspectives. Applied Microbiology and Biotechnology
- Antognoni, S.; Ragazzi, M.; Rada, E.C.; Plank, R.; Aichinger, P.; Kuprian, M.; Ebner, C. (2013) Potential Effects of Mechanical Pre-treatments on Methane Yield from Solid Waste Anaerobically Digested. International Journal of Environmental Bioremediation & Biodegradation 1(1), 20–25
- Heiermann, M. Plöchl, M. Linke, B. Schelle, H. (2002) Preliminary evaluation of some cereals as energy crops for biogas production. World Renewable Energy Congress VII
- Hendriks, A.T.W.M.; Zeeman, G. (2009) Pretreatments to enhance the digestibility of lignocellulosic biomass. Bioresource Technology
- Kolbl, S.; Paloczi, A.; Panjan, J.; Stres, B. (2014) Addressing case specific biogas plant tasks: Industry oriented methane yields derived from 5L Automatic Methane Potential Test Systems in batch or semi-continuous tests using realistic inocula, substrate particle sizes and organic loading. Bioresource Technology 153, 180–188
- Chevalier, A.; Evon, P.; Monlau, F.; Vandenbossche, V.; Sambusiti, C. (2023) Twin-Screw Extrusion Mechanical Pretreatment for Enhancing Biomethane Production from Agro-Industrial, Agricultural and Catch Crop Biomasses. Waste 1(2), 497–514
- FNR (2010). Guía sobre el Biogás – Desde la producción hasta el uso (hiszp. wydanie „Leitfaden Biogas”, GIZ 2013)
The co-digestion calculator will assess a specific mixture containing this substrate.
What it is and where it comes from
Triticale is a hybrid of wheat and rye, commonly grown in Poland for feed. Its advantage is good yielding on soils poorer than those suitable for wheat. Harvested as whole plants (GPS), it is sometimes ensiled and used as a supplement to maize silage. The compilation covers a dozen or so records from several studies, including an experiment in which many harvest dates were tested in an energy crop rotation, under mesophilic conditions.
Properties relevant to digestion
Like other cereals harvested green, triticale, as it matures, increases the share of starch in the grain and of woody straw, and reduces the content of protein and readily available compounds. Early harvest gives material that is better digestible but less abundant. Ensiling is usually easy, and proper size reduction and compaction limit losses. Immature grains are soft and more readily utilised, whereas in silage from a late harvest part of the starch may remain unutilised if it is not crushed. The C-to-N ratio is more favourable than in straw.
How to read the spread of results
The greatest influence is exerted by the harvest date, followed by the variety, fertilisation, year and site. Some records come from a single series, so the spread does not result from independent sources. Added to this are differences in size reduction, the form of the material (green forage or silage), the inoculum, the substrate-to-inoculum ratio and the length of the test. The compilation reflects a wide range of possible values, not the result of a specific crop.
In biogas plant practice
Triticale GPS suits farms that want to obtain additional biomass from a cereal crop and to clear the field earlier. Harvest with a forage harvester at milk or wax ripeness, rapid ensiling and a tight cover are the basis of good quality. The substrate combines well with slurry and maize silage. Cost-effectiveness is decided by yield and the price of competing raw materials. A BMP test stating the harvest stage makes it possible to select the dose properly. It is worth remembering that triticale is a crop with good productivity and disease resistance, so in regions with poorer soils it often comes out better than wheat. The final choice of cereal species for GPS depends, however, on local yields and harvest dates.
Methodology in brief
BMP is the amount of methane obtained from volatile solids (VS) in a batch test, given in m³ CH₄ per tonne of VS (numerically the same as NmL CH₄/g VS in the publications) and converted to normal conditions (0 °C, 101.325 kPa). The weighted mean gives each publication a total weight of 1, split equally between its results for the substrate — a paper testing twenty varieties does not outweigh a paper with a single sample. In inter-laboratory programmes the unit is the laboratory (total weight 1), and within it the weight of a test grows with the number of bottles (replicates). Results after pretreatment (e.g. thermal, chemical, enzymatic) are shown separately and are not included in the mean.
Solid lines are curves measured in the tests. Where a publication gives only the final result, we draw a first-order kinetic model, B(t) = B₀·(1 − e−kt): only the end point comes from the publication, and the shape of the curve serves purely as visualisation — do not read the production on a particular day from it. For this substrate k = 0.085 d−1 was assumed (median of rate constants k reported in the sources and/or fitted to the mean measured curves).
The statistics describe the spread of published results — a descriptive compilation, not a meta-analysis or a guarantee of plant yield.
Results after pretreatment (2) — excluded from the mean
| Source | BMP m³ CH₄/t VS | Pretreatment | Sample |
|---|---|---|---|
| Kolbl et al. (2014) | 312 | enzymatic | Triticale |
| Kolbl et al. (2014) | 478 | enzymatic | Triticale |
Bibliography
- Amon, T.; Amon, B.; Kryvoruchko, V.; Machmüller, A.; Hopfner-Sixt, K.; Bodiroza, V.; Hrbek, R.; Friedel, J.; Pötsch, E.; Wagentristl, H.; Schreiner, M.; Zollitsch, W. (2007). Methane production through anaerobic digestion of various energy crops grown in sustainable crop rotations. Bioresource Technology 98(17), 3204–3212. DOI: 10.1016/j.biortech.2006.07.007 DOI
- Antognoni, S.; Ragazzi, M.; Rada, E.C.; Plank, R.; Aichinger, P.; Kuprian, M.; Ebner, C. (2013). Potential Effects of Mechanical Pre-treatments on Methane Yield from Solid Waste Anaerobically Digested. International Journal of Environmental Bioremediation & Biodegradation 1(1), 20–25.
- Heiermann, M. Plöchl, M. Linke, B. Schelle, H. (2002). Preliminary evaluation of some cereals as energy crops for biogas production. World Renewable Energy Congress VII.
- Kolbl, S.; Paloczi, A.; Panjan, J.; Stres, B. (2014). Addressing case specific biogas plant tasks: Industry oriented methane yields derived from 5L Automatic Methane Potential Test Systems in batch or semi-continuous tests using realistic inocula, substrate particle sizes and organic loading. Bioresource Technology 153, 180–188. DOI: 10.1016/j.biortech.2013.12.010 DOI
- Chevalier, A.; Evon, P.; Monlau, F.; Vandenbossche, V.; Sambusiti, C. (2023). Twin-Screw Extrusion Mechanical Pretreatment for Enhancing Biomethane Production from Agro-Industrial, Agricultural and Catch Crop Biomasses. Waste 1(2), 497–514. DOI: 10.3390/waste1020030 DOI
All sources of the site: bibliography.
Other substrates in the group “Energy crops and whole-crop plants (WCS)”
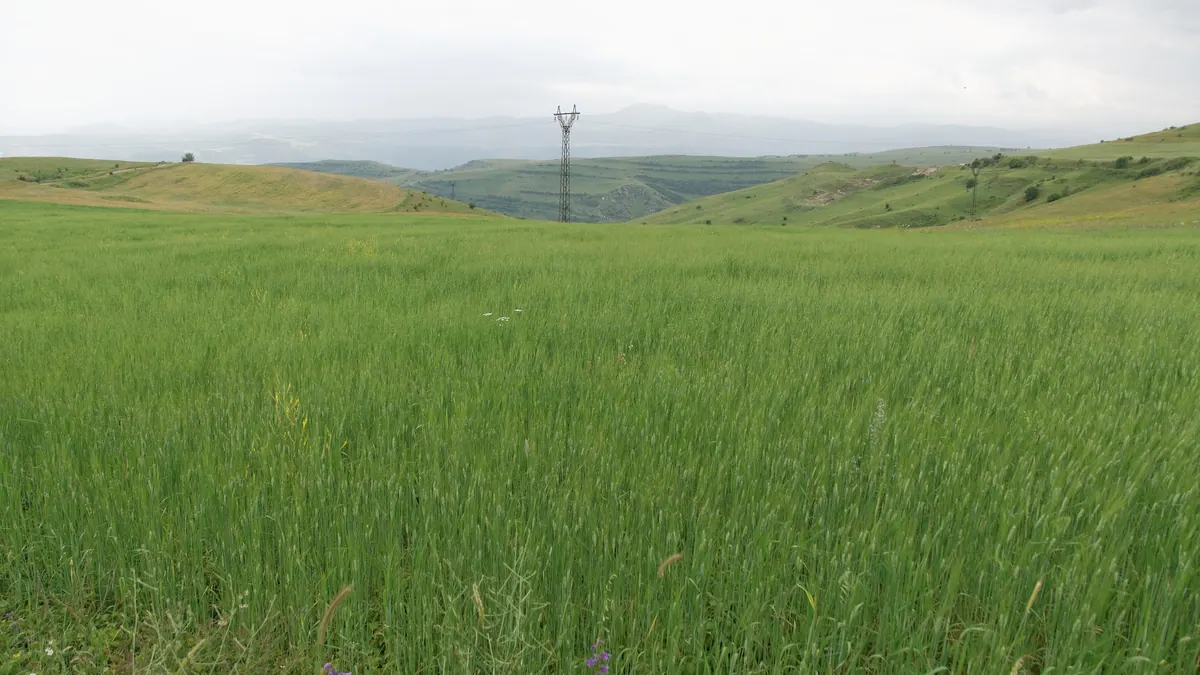
Wheat, whole crop — BMP: 13 studies, weighted mean 332 m³ CH₄/t VS
332 m³ CH₄/t VS weighted mean from 13 studies
very good — editorial rating for biogas plants59 %
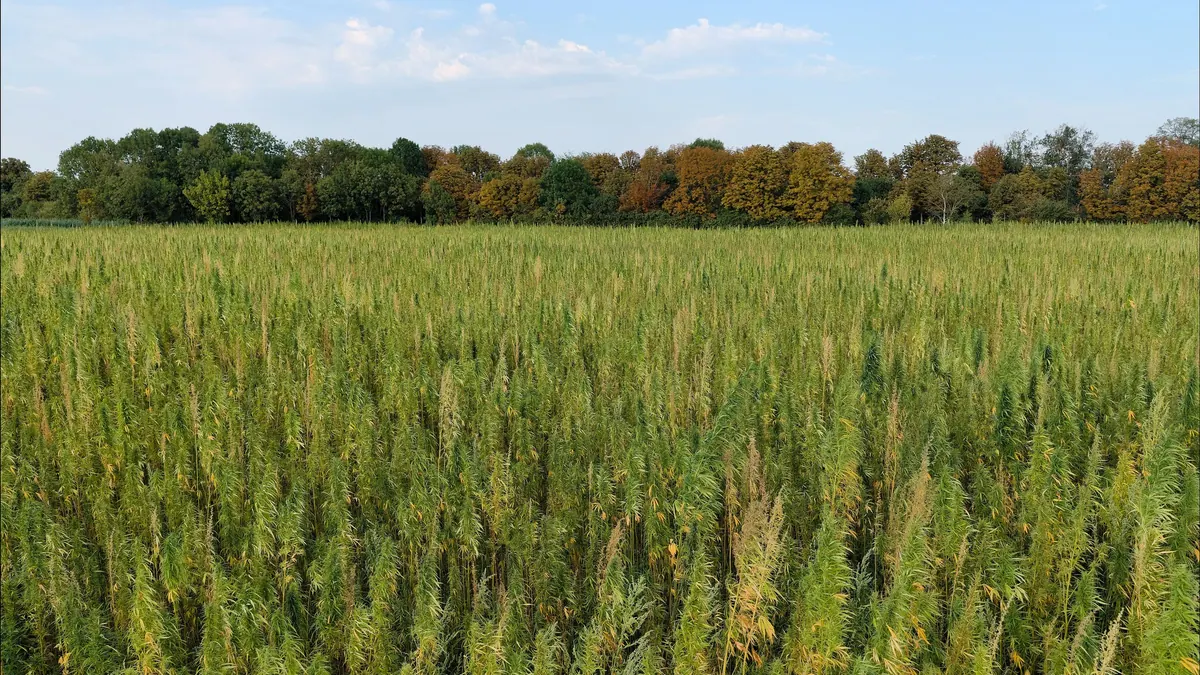
Hemp, stalks and whole plant — BMP: 3 studies, weighted mean 242 m³ CH₄/t VS
242 m³ CH₄/t VS weighted mean from 3 studies
≈52 %

Rapeseed, green biomass — BMP: 4 studies, weighted mean 367 m³ CH₄/t VS
367 m³ CH₄/t VS weighted mean from 4 studies
good — editorial rating for biogas plants66 %
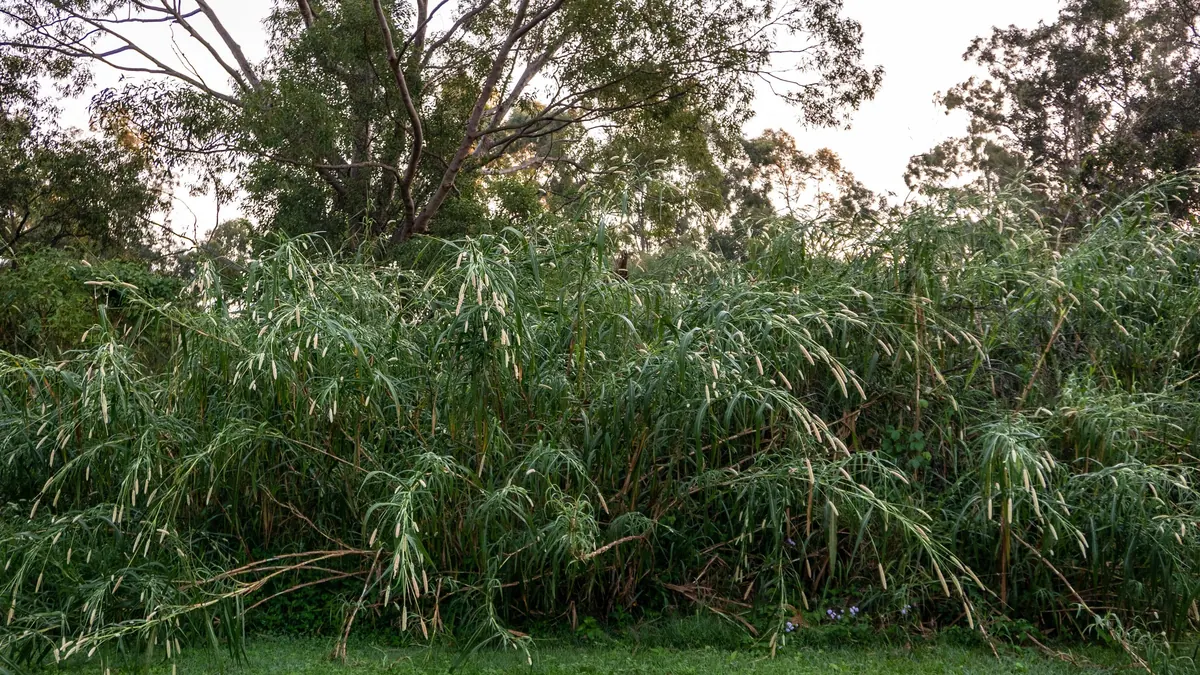
Pennisetum hybrid grass — BMP: 18 studies, weighted mean 266 m³ CH₄/t VS
266 m³ CH₄/t VS weighted mean from 18 studies
neutral — editorial rating for biogas plants≈52 %