

BMP testingBy-products of the agri-food industry
Spent coffee grounds — BMP: 18 studies, weighted mean 262 m³ CH₄/t VS
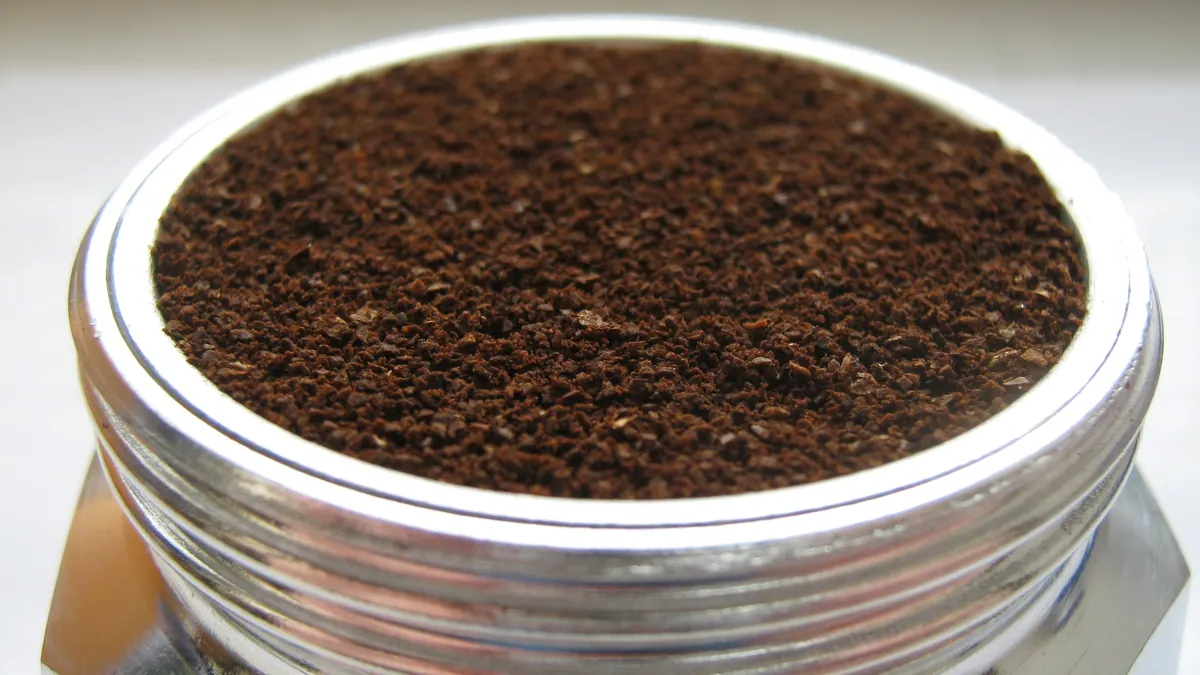
Spent coffee grounds are used coffee from catering and the instant coffee industry, containing fat, lignin and caffeine; they digest well after size reduction and in a small share.
rating: neutralCH₄ ≈ 65 % (estimate)
Photo ПростоУчастник / Wikimedia Commons, licence CC0 1.0, source file; changes: cropping

- Weighted mean
- 262m³ CH₄/t VS
- Range
- 110–413m³ CH₄/t VS
- Records
- 18studies
- Publications
- 3sources
- Temperatures
- 37 °C, 38 °C, 58 °Cof the test
Methane in biogas
High methane content · ≈ 6.5 kWh/m³ of biogas
estimate from the substrate type The collected studies contain no measurement. The interval follows from the approximate composition (protein from total nitrogen (N 2.8 % DM × 6.25); fat-rich (process classification)) and the yields of compound groups according to FNR.
Rating for biogas plants
neutral — editorial rating for biogas plantsNo clear advantages — worth charging a fee for accepting it
Potential per tonne of fresh matter: moderate (40 m³ CH₄/t); process risk: fats, inhibitors, foaming. Handling costs: fibres, floating layer.
Why? Rating factors
Potential per tonne +1
- +1potential 40 m³ CH₄/t fresh matter (BMP 262 × DM 16 % × VS 95.7 %)
Process stability −1.75
- −1fats: risk of accumulation of long-chain fatty acids (LCFA), flotation and overloading
- −0.5inhibitors: natural or residues (e.g. limonene, polyphenols, antibiotics, metals)
- −0.25foaming: tendency to form foam in the digester
Handling and costs −0.5
- −0.5fibres, floating layer — shredding and intensive mixing
Total points: −1.25 · thresholds: ≥ 2.5 very good, ≥ 1 good, below — neutral; negative with cumulative process risk.
Add to the co-digestion calculator CSV data
BMP curves from 18 studies
Weighted mean Individual records
Dashed lines are a model curve (first-order kinetics, B(t) = B₀·(1 − e−kt)); the end point comes from the publication. All curves are model curves.
Cumulative methane production over the test [m³ CH₄/t VS]. The thick line is the weighted mean of all records (262); dots mark the end values given in the publications. Point at the chart to read values; click a legend item to hide or show a record.
Show the remaining records in the legend (6)
Records and sources
Download CSV| Source | BMP m³ CH₄/t VS | Temperature | Sample | Curve |
|---|---|---|---|---|
| Cazaudehore et al. (2021) · 1 DOI | 294 | 38 °C · mesophilic | spent coffee · pretreatment: particle size reduction/sample preparation (MY-D: physical treatment) | end point (model curve) |
| Cazaudehore et al. (2021) · 2 DOI | 301 | 58 °C · thermophilic | spent coffee · pretreatment: particle size reduction/sample preparation (MY-D: physical treatment) | end point (model curve) |
| Dias et al. (2023) · 1 DOI | 127 | 37 °C · mesophilic | industrial spent coffee ground | end point (model curve) |
| Dias et al. (2023) · 2 DOI | 217 | 37 °C · mesophilic | industrial spent coffee ground | end point (model curve) |
| Dias et al. (2023) · 3 DOI | 252 | 37 °C · mesophilic | industrial spent coffee ground | end point (model curve) |
| Dias et al. (2023) · 4 DOI | 266 | 37 °C · mesophilic | industrial spent coffee ground | end point (model curve) |
| Dias et al. (2023) · 5 DOI | 311 | 37 °C · mesophilic | industrial spent coffee ground | end point (model curve) |
| Dias et al. (2023) · 6 DOI | 320 | 37 °C · mesophilic | industrial spent coffee ground | end point (model curve) |
| Dias et al. (2023) · 7 DOI | 322 | 37 °C · mesophilic | industrial spent coffee ground | end point (model curve) |
| Dias et al. (2023) · 8 DOI | 329 | 37 °C · mesophilic | industrial spent coffee ground | end point (model curve) |
| Dias et al. (2023) · 9 DOI | 336 | 37 °C · mesophilic | industrial spent coffee ground | end point (model curve) |
| Dias et al. (2023) · 10 DOI | 338 | 37 °C · mesophilic | industrial spent coffee ground | end point (model curve) |
| Dias et al. (2023) · 11 DOI | 350 | 37 °C · mesophilic | industrial spent coffee ground | end point (model curve) |
| Dias et al. (2023) · 12 DOI | 362 | 37 °C · mesophilic | industrial spent coffee ground | end point (model curve) |
| Dias et al. (2023) · 13 DOI | 370 | 37 °C · mesophilic | industrial spent coffee ground | end point (model curve) |
| Dias et al. (2023) · 14 DOI | 413 | 37 °C · mesophilic | industrial spent coffee ground | end point (model curve) |
| Velasquez-Pinas et al. (2023) · 1 DOI | 110 | 37 °C · mesophilic | ground coffee waste | end point (model curve) |
| Velasquez-Pinas et al. (2023) · 2 DOI | 251 | 37 °C · mesophilic | dischard coffee | end point (model curve) |
| Weighted mean | 262 | arithmetic mean 293, SD 79 | ||
Typical composition
- Dry matter (DM)
- 16% (range 6.3–97.2)
- Volatile solids (VS)
- 95.7 % DM (range 95.1–96.3)
- Nitrogen
- 2.8 % DM
- C/N ratio
- 17.5
Median and range of the determinations reported in the publications behind this substrate's BMP records (read from: MY-D); dry matter: 9 determinations, volatile solids: 2 determinations. C/N was calculated as the ratio of C and N content (% DM) from the same source. The DM range includes fresh samples as well as samples partly dried or dried before the test – for fresh material the lower part of the range applies, ideally your own measurement.
Sources: Cazaudehore et al. (2021); Dias et al. (2023); Velasquez-Pinas et al. (2023).
The composition of the raw material varies between batches — for plant calculations use an analysis of your own sample. The calculator inserts typical values automatically.
Process properties
Advantages
- Methane potential in the Substraty.pl BMP set: weighted mean 262.0 m³ CH₄/t VS (SD 79.2; 18 records, 3 sources).
- Spent coffee grounds have been studied for digestion as coffee waste (Lane 1983).
- They contain fat, which raises the potential (Lane 1983; Long et al. 2012).
Drawbacks and risks
- Fat may give LCFA at high loading (Long et al. 2012).
- Caffeine and polyphenols may inhibit (Chen et al. 2008).
- They mould quickly and require rapid use.
Co-digestion — what to combine it with, what to watch out for
- combines well
substrates: high alkalinity (buffer) — e.g. Cattle manure, Pig slurry, Cattle slurry, Duck slurry, Rumen and digestive tract content
Slurry supplies N and alkalinity, balancing the high C/N of the material.[1][2]
- caution
substrates: fat-rich — e.g. Food waste, Primary sludge, Sunflower seeds, Olive pomace / olive mill solid waste, Slaughterhouse waste (cattle, pigs, poultry)
Grounds + oil/fat: two sources of LCFA.[3]
Dosing
No source threshold. Low/medium dose, shredded; the share is limited by fat and inhibitors.
Introduce gradually, starting with a small dose and monitoring the process (e.g. FOS/TAC, pH, gas composition).
Sources of the process data
- Hagos et al. (2017). Anaerobic co-digestion process for biogas production: progress, challenges and perspectives. Renew. Sustain. Energy Rev.
- Weiland, P. (2010) Biogas production: current state and perspectives. Applied Microbiology and Biotechnology
- Long et al. (2012). Anaerobic co-digestion of fat, oil, and grease (FOG): A review of gas production and process limitations. Process Saf. Environ. Prot.
- Lane (1983). Anaerobic digestion of spent coffee grounds. Biomass
- Chen, Cheng, Creamer (2008). Inhibition of anaerobic digestion process: A review. Bioresour. Technol.
The co-digestion calculator will assess a specific mixture containing this substrate.
What it is and where it comes from
Spent coffee grounds are the residue after brewing coffee or extracting instant coffee. They arise in cafes, restaurants and offices, and on a large scale in plants producing instant coffee. In biogas plants they appear as a component of kitchen (catering) waste or as a separate, homogeneous batch from industry. Owing to the growth of coffee culture, the stream in Poland is noticeable, but dispersed.
Properties relevant to digestion
Spent coffee is a material containing fat (a few per cent of dry matter), hemicellulose (mannans, galactans), cellulose, lignin and protein. Thanks to the lipid content the gas potential is high, but the risk is the accumulation of long-chain fatty acids (LCFA) at a high load. The grounds also contain caffeine, tannins and polyphenols, which can affect microorganisms, although at typical shares they do not block the process. The fibrous structure includes a fraction that is hard to degrade, so degradation is slower than for sugars. Fresh grounds are moist and quickly go mouldy.
How to read the spread of results
The dataset contains several records from several sources, including mesophilic (37-38 °C) and thermophilic (approx. 58 °C) studies. The spread results from the origin of the grounds (brewed coffee, industrial extract), the species and degree of roasting of the beans, whether the grounds were defatted, and also from size reduction, drying of the samples, the test conditions and the inoculum. In one study industrial grounds were tested under different test conditions, which in itself creates variability.
In biogas plant practice
Spent coffee grounds are used as an additive in co-digestion in a small share, best with slurry or sludge, which bring buffering and trace elements. Dosing should be stable, because a sudden increase in the lipid load can disturb the process. Fresh grounds are not stored for long. Catering waste requires compliance with the regulations on kitchen waste and, if it is mixed with products of animal origin, also with veterinary regulations.
For a full assessment of a batch it is worth checking the fat and dry matter content, because grounds from the instant coffee industry, after extraction with hot water, have a different composition from grounds from espresso machines in cafes, which contain more residual fat and are moister.
Methodology in brief
BMP is the amount of methane obtained from volatile solids (VS) in a batch test, given in m³ CH₄ per tonne of VS (numerically the same as NmL CH₄/g VS in the publications) and converted to normal conditions (0 °C, 101.325 kPa). The weighted mean gives each publication a total weight of 1, split equally between its results for the substrate — a paper testing twenty varieties does not outweigh a paper with a single sample. In inter-laboratory programmes the unit is the laboratory (total weight 1), and within it the weight of a test grows with the number of bottles (replicates). Results after pretreatment (e.g. thermal, chemical, enzymatic) are shown separately and are not included in the mean.
Solid lines are curves measured in the tests. Where a publication gives only the final result, we draw a first-order kinetic model, B(t) = B₀·(1 − e−kt): only the end point comes from the publication, and the shape of the curve serves purely as visualisation — do not read the production on a particular day from it. For this substrate k = 0.091 d−1 was assumed (no kinetic data for the group – the median of all available rate constants k (93 values) was used).
The statistics describe the spread of published results — a descriptive compilation, not a meta-analysis or a guarantee of plant yield.
Bibliography
- Cazaudehore, G.; Monlau, F.; Gassie, C.; Lallement, A.; Guyoneaud, R. (2021). Methane production and active microbial communities during anaerobic digestion of three commercial biodegradable coffee capsules under mesophilic and thermophilic conditions. Science of The Total Environment 784, 146972. DOI: 10.1016/j.scitotenv.2021.146972 DOI
- Dias, M.; Takeda, P.; Fuess, L.; Tommaso, G. (2023). Inoculum-to-substrate ratio and solid content effects over in natura spent coffee grounds anaerobic digestion. Journal of Environmental Management 325, 116486. DOI: 10.1016/j.jenvman.2022.116486 DOI
- Velasquez-Pinas, J.A.; Ampese, L.C.; Di Domenico Ziero, H.; Radis Steinmetz, R.L.; Belt, C.; Forster-Carneiro, T. (2023). Circular bioeconomy of coffee industries: Energy and techno-economic approach based on biogas and biomethane production. Journal of Cleaner Production 418, 138045. DOI: 10.1016/j.jclepro.2023.138045 DOI
All sources of the site: bibliography.
Other substrates in the group “By-products of the agri-food industry”
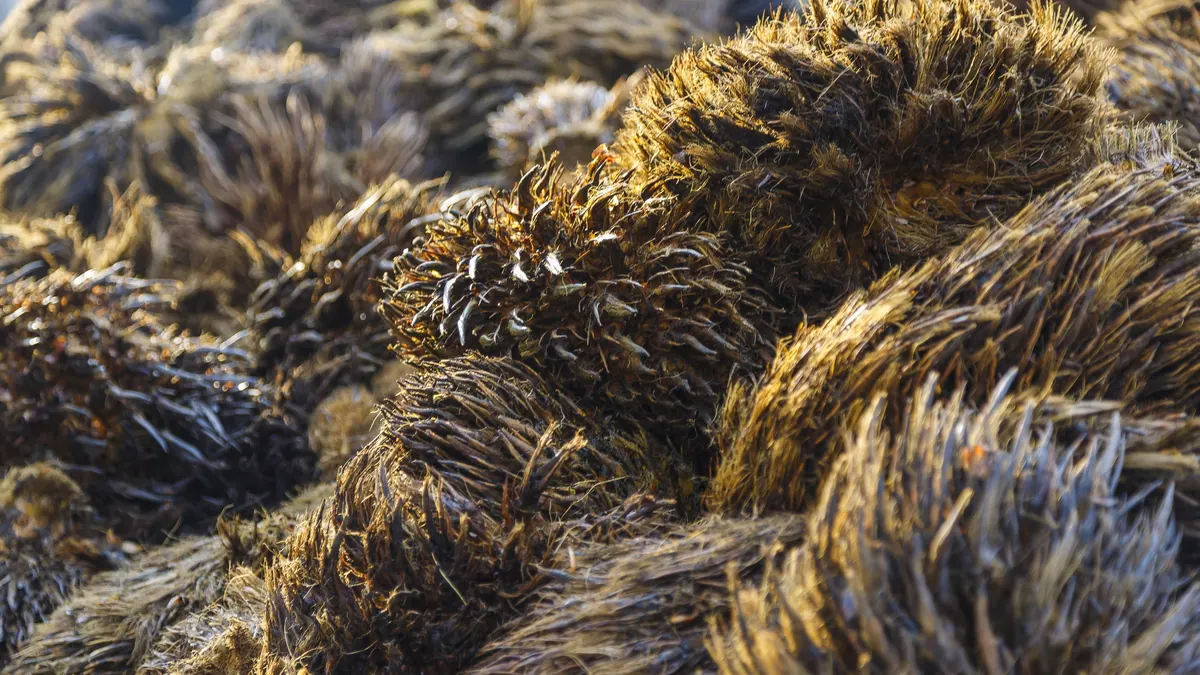
Oil palm empty fruit bunches — BMP: 2 studies, weighted mean 179 m³ CH₄/t VS
179 m³ CH₄/t VS weighted mean from 2 studies
≈52 %
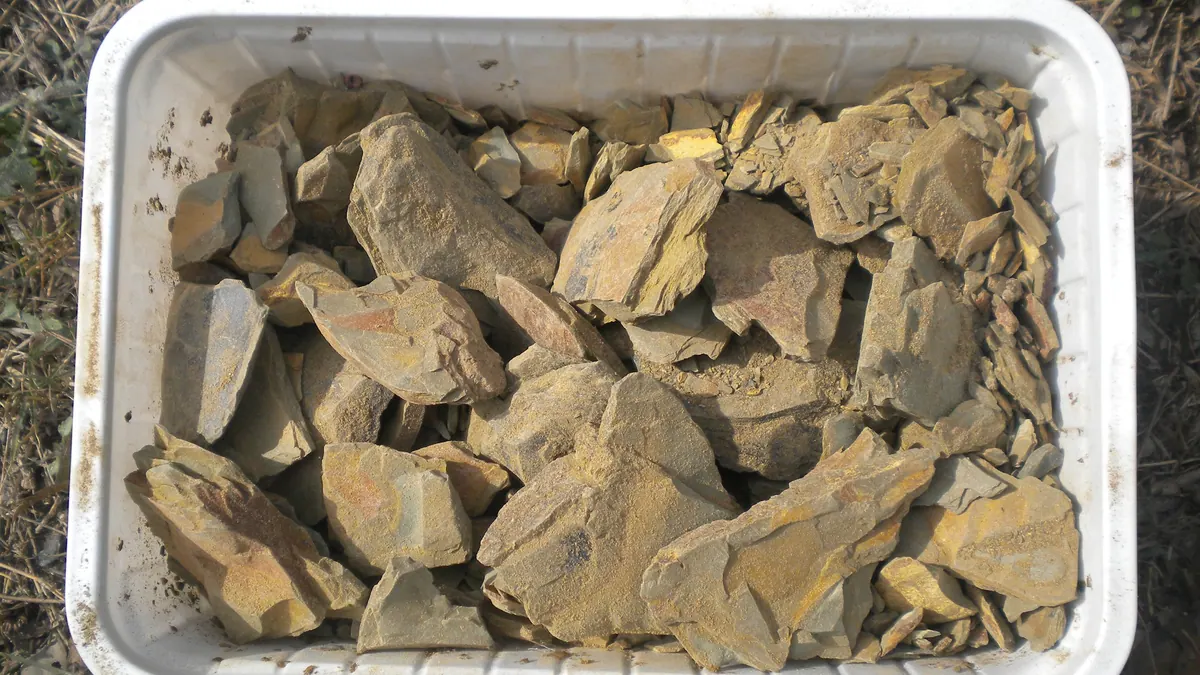
Oil refining residues (gums, condensates, spent earth) — BMP: 5 studies, weighted mean 714 m³ CH₄/t VS
714 m³ CH₄/t VS weighted mean from 5 studies
≈63 %
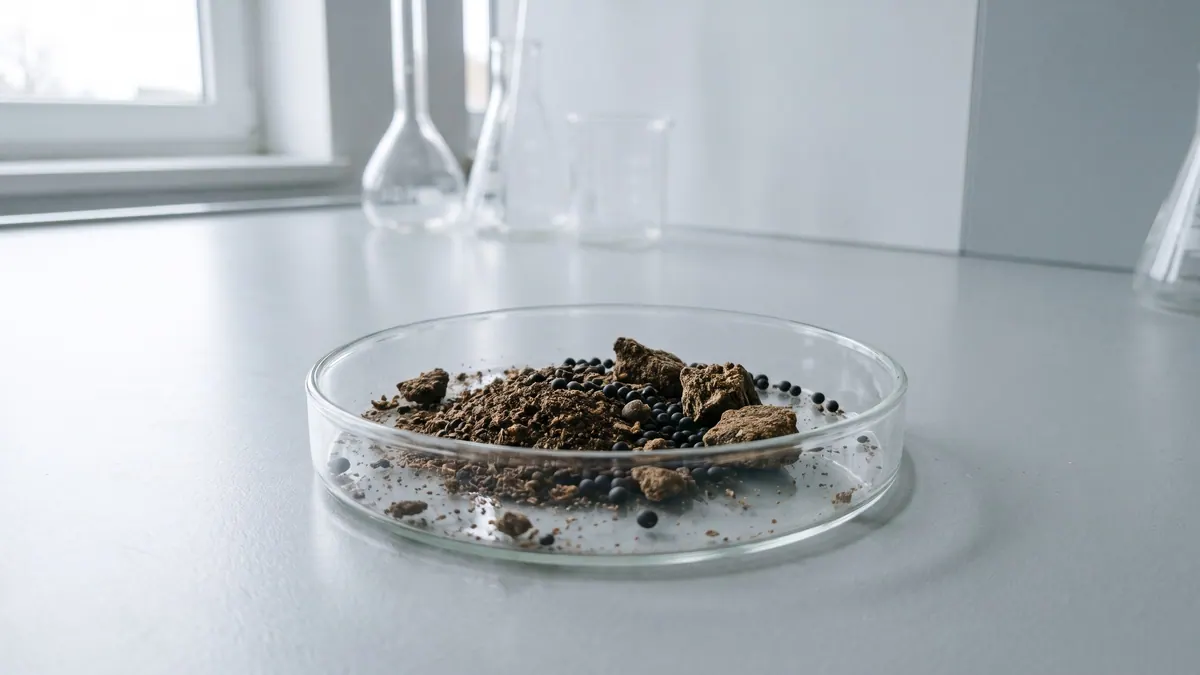
Rapeseed meal and cake — BMP: 2 studies, weighted mean 368 m³ CH₄/t VS
368 m³ CH₄/t VS weighted mean from 2 studies
≈66 %
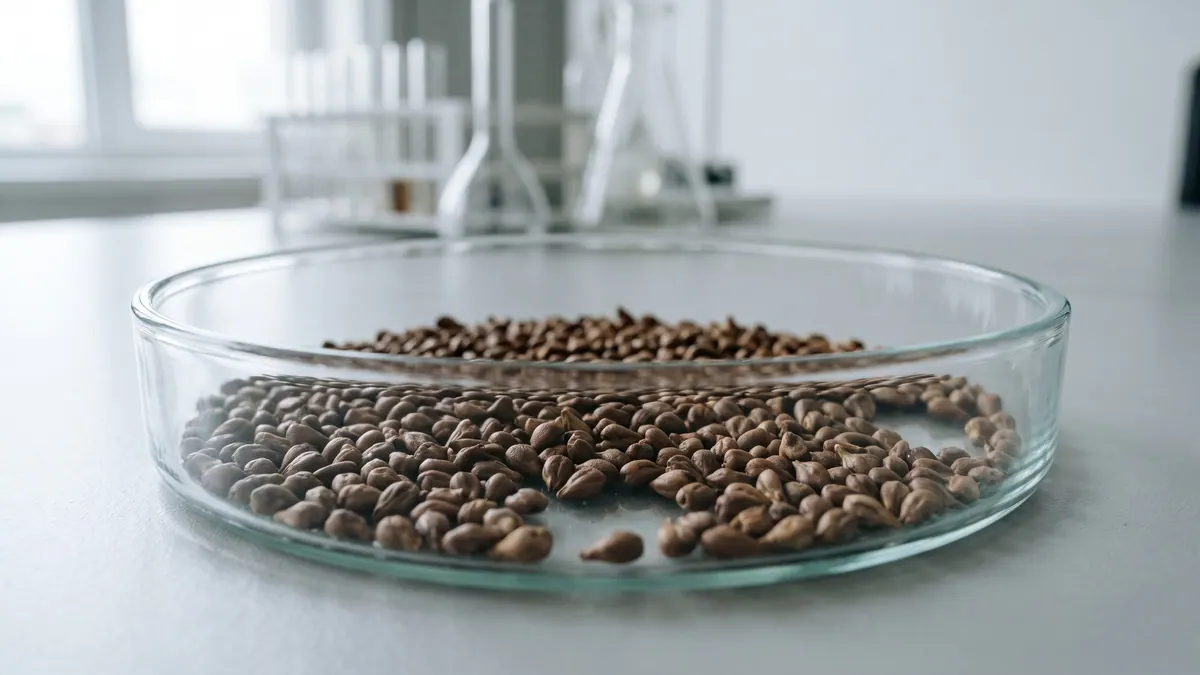
Grape seeds — BMP: 2 studies, weighted mean 214 m³ CH₄/t VS
214 m³ CH₄/t VS weighted mean from 2 studies
≈52 %