

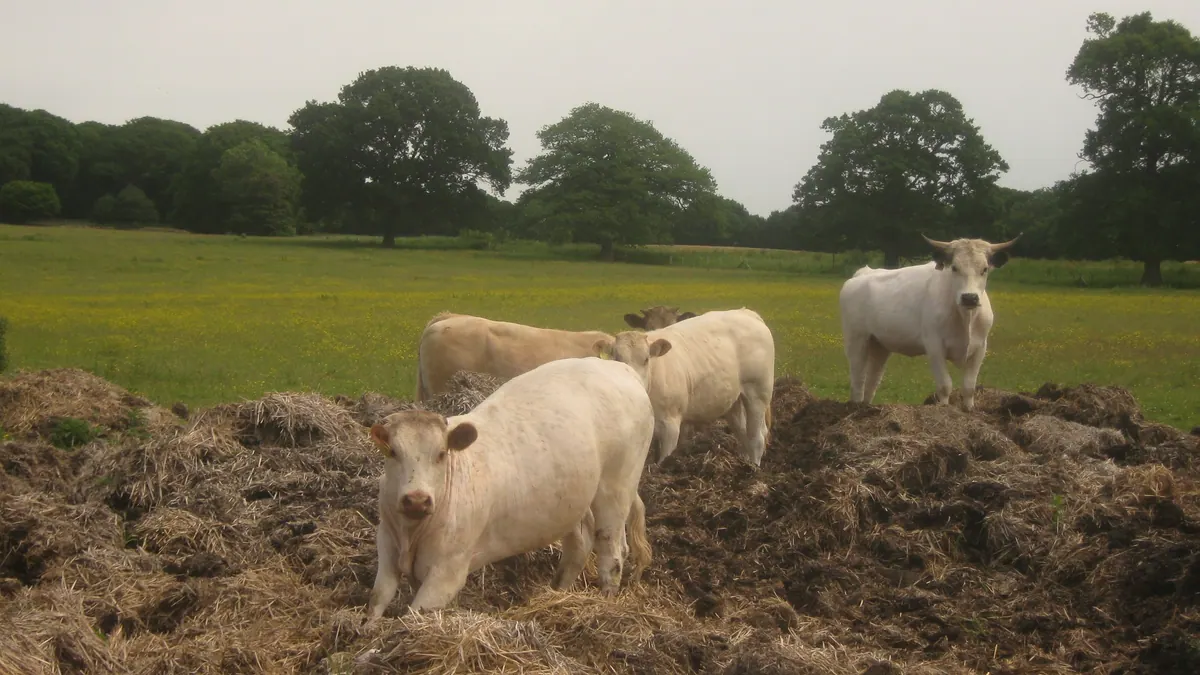
BMP testingAnimal excreta (slurry, manure, poultry litter)
Cattle manure — BMP: 27 studies, weighted mean 149 m³ CH₄/t VS
Cattle manure and excreta are a lignocellulosic substrate of moderate potential, widely used in agricultural biogas plants as the basis of co-digestion.
rating: goodCH₄ ≈ 52 % (estimate)
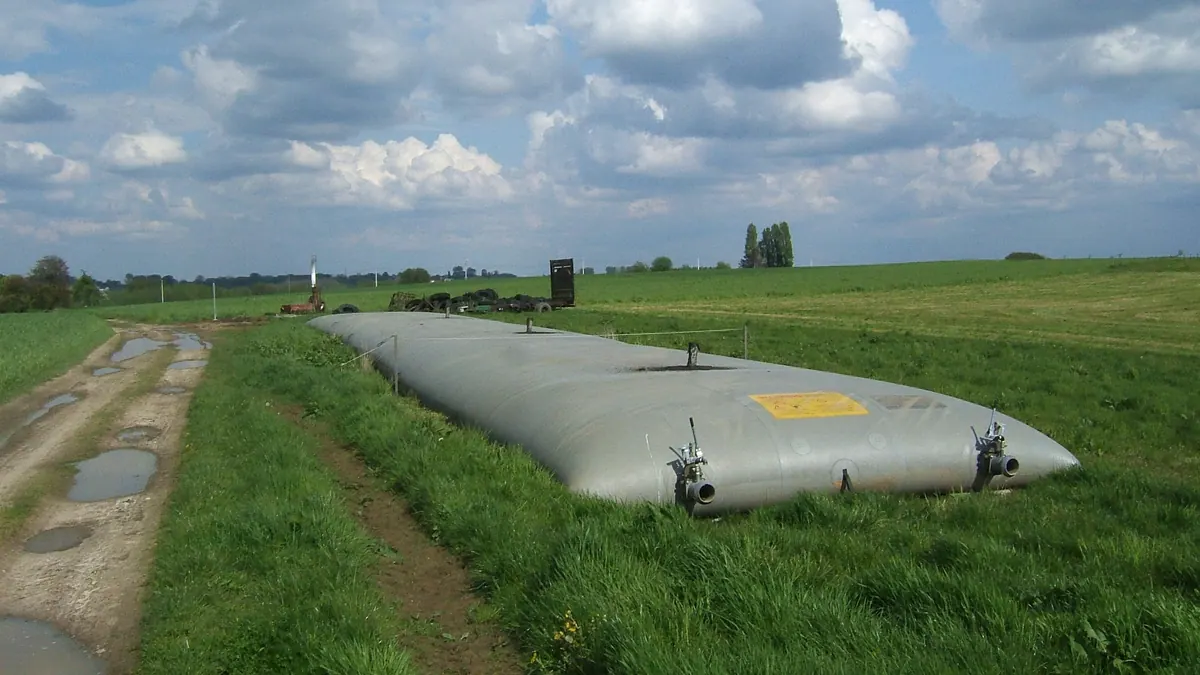
Photo David Anstiss / Wikimedia Commons, licence CC BY-SA 2.0, source file; changes: cropping

- Weighted mean
- 149m³ CH₄/t VS
- Range
- 51–322m³ CH₄/t VS
- Records
- 27studies
- Publications
- 14sources
- Temperatures
- 35 °C, 36 °C, 37 °C, 38 °Cof the test
Methane in biogas
Medium methane content · ≈ 5.2 kWh/m³ of biogas
estimate from the substrate type The collected studies contain no measurement. The interval follows from the approximate composition (protein from total nitrogen (N 1.2 % DM × 6.25; in manure part of the N is ammonium nitrogen)) and the yields of compound groups according to FNR.
Rating for biogas plants
good — editorial rating for biogas plantsStable, usually accepted without a fee
Potential per tonne of fresh matter: moderate (31 m³ CH₄/t); stabilises the process (high alkalinity, supplies trace elements). Handling costs: sand, stones, shells, fibres, floating layer, slow degradation.
Why? Rating factors
Potential per tonne +1
- +1potential 31 m³ CH₄/t fresh matter (BMP 149 × DM 25.2 % × VS 82 %)
Process stability +2
- +1.5high alkalinity — stabilises the pH of the mixture
- +0.5supplies trace elements (Co, Ni, Se, Fe)
Handling and costs −1.5
- −0.5sand, stones, shells — sediment in the digester
- −0.5fibres, floating layer — shredding and intensive mixing
- −0.5slow degradation — long retention time
Total points: 1.5 · thresholds: ≥ 2.5 very good, ≥ 1 good, below — neutral; negative with cumulative process risk.
Add to the co-digestion calculator CSV data
BMP curves from 27 studies
Weighted mean Individual records
Dashed lines are a model curve (first-order kinetics, B(t) = B₀·(1 − e−kt)); the end point comes from the publication. All curves are model curves.
Cumulative methane production over the test [m³ CH₄/t VS]. The thick line is the weighted mean of all records (149); dots mark the end values given in the publications. Point at the chart to read values; click a legend item to hide or show a record.
Show the remaining records in the legend (15)
Records and sources
Download CSV| Source | BMP m³ CH₄/t VS | Temperature | Sample | Curve |
|---|---|---|---|---|
| Lallement et al. (2021) · 1 DOI | 227 | 38 °C · mesophilic | cow manure (inoculum 2) | end point (model curve) |
| Lallement et al. (2021) · 2 DOI | 238 | 38 °C · mesophilic | cow manure (inoculum 1) | end point (model curve) |
| Legesse et al. (2024) DOI | 143 | 35 °C · mesophilic | cow dung (CD), mono-digestion (T-7) | end point (model curve) |
| Baek et al. (2020) DOI | 109 | 35 °C · mesophilic | cattle manure with sawdust bedding (CM), mono-digestion (Run 1) | end point (model curve) |
| Rubio et al. (2019) DOI | 72 | 35 °C · mesophilic | cattle manure (CM) | end point (model curve) |
| Saha et al. (2025) DOI | 75 | 35 °C · mesophilic | cow dung (CD), 100% | end point (model curve) |
| Cu et al. (2014) · 1 DOI | 157 | 37 °C · mesophilic | dairy cow manure | end point (model curve) |
| Cu et al. (2014) · 2 DOI | 222 | 37 °C · mesophilic | cow manure | end point (model curve) |
| Kafle i Chen (2016) DOI | 202 | 36 °C · mesophilic | dairy manure | end point (model curve) |
| Kouas et al. (2017) · 1 DOI | 70 | 35 °C · mesophilic | manure | end point (model curve) |
| Kouas et al. (2017) · 2 DOI | 177 | 35 °C · mesophilic | manure | end point (model curve) |
| Kouas et al. (2017) · 3 DOI | 212 | 35 °C · mesophilic | manure | end point (model curve) |
| Labatut et al. (2011) DOI | 243 | 35 °C · mesophilic | Raw dairy manure | end point (model curve) |
| Lallement et al. (2023) · 1 DOI | 132 | 38 °C · mesophilic | Cattle manure | end point (model curve) |
| Lallement et al. (2023) · 2 DOI | 162 | 38 °C · mesophilic | Cattle manure | end point (model curve) |
| Lallement et al. (2023) · 3 DOI | 167 | 38 °C · mesophilic | Cattle manure | end point (model curve) |
| Lallement et al. (2023) · 4 DOI | 191 | 38 °C · mesophilic | Cattle manure | end point (model curve) |
| Lallement et al. (2023) · 5 DOI | 199 | 38 °C · mesophilic | Cattle manure | end point (model curve) |
| Lallement et al. (2023) · 6 DOI | 224 | 38 °C · mesophilic | cattle manure | end point (model curve) |
| Lallement et al. (2023) · 7 DOI | 233 | 38 °C · mesophilic | Cattle manure | end point (model curve) |
| Lallement et al. (2023) · 8 DOI | 236 | 38 °C · mesophilic | Cattle manure | end point (model curve) |
| Lallement et al. (2023) · 9 DOI | 258 | 38 °C · mesophilic | Cattle manure | end point (model curve) |
| Lallement et al. (2023) · 10 DOI | 322 | 38 °C · mesophilic | Cattle manure | end point (model curve) |
| Li et al. (2013) DOI | 51 | 37 °C · mesophilic | Dairy Manure | end point (model curve) |
| Lisboa i Lansing (2013) DOI | 91 | 35 °C · mesophilic | dairy Manure | end point (model curve) |
| Eliasson et al. (2023) DOI | 195 | 37 °C · mesophilic | Cattle manure | end point (model curve) |
| Schumacher et al. (2019) DOI | 114 | — | Cattle manure (untreated) | end point (model curve) |
| Weighted mean | 149 | arithmetic mean 175, SD 68 | ||
Typical composition
- Dry matter (DM)
- 25.2% (range 10.9–69.8)
- Volatile solids (VS)
- 82 % DM (range 73–91)
- Nitrogen
- 1.2 % DM
- C/N ratio
- 33.5
Median and range of the determinations reported in the publications behind this substrate's BMP records (read from: MY-D); dry matter: 14 determinations, volatile solids: 13 determinations. C/N was calculated as the ratio of C and N content (% DM) from the same source.
Sources: Cu et al. (2014); Kafle et al. (2016); Labatut et al. (2011); Lallement et al. (2023); Li et al. (2013).
The composition of the raw material varies between batches — for plant calculations use an analysis of your own sample. The calculator inserts typical values automatically.
Process properties
Advantages
- Methane potential in the Substraty.pl BMP dataset: weighted mean 148.7 m³ CH₄/t VS (SD 68.0; 27 records, 14 sources).
- Provides N, trace elements and microflora; lower ammonia risk than with poultry litter (Kafle and Chen 2016).
- In uniform BMP tests of five types of manure, dairy cattle manure was the reference point for the other species (Kafle and Chen 2016).
Drawbacks and risks
- Long straw fibres form a floating crust and clog pumps (Weiland 2010).
- Slow hydrolysis of lignocellulose requires a long HRT (Weiland 2010).
- Sand in the bedding settles out (Weiland 2010).
Co-digestion — what to combine it with, what to watch out for
- combines well
substrates: fat-rich — e.g. Food waste, Spent coffee grounds, Primary sludge, Sunflower seeds, Olive pomace / olive mill solid waste
Base for fats in an agricultural feed.[1]
Dosing
No restriction; use as a component of the feed with size reduction.
Practical requirements
- ABP cat. 2 (Art. 9 of Reg. 1069/2009): manure, slurry and digestive tract content may be digested without prior sterilisation if the authority does not recognise a risk of spreading a serious transmissible disease (Art. 13(e)(ii)); in that case a minimum of 70 °C for a minimum of 60 min applies (Reg. 142/2011, Annex V Ch. III Section 1), and where they are the only material of animal origin in the installation, the authority may approve other requirements (Section 2 point 3).
- Shred: shredding increases the surface available for degradation and speeds it up, but does not necessarily raise the final gas yield (FNR 2010, Ch. 3 “Triturado”).
- Provide for removal of sand and heavy contaminants: sand is often strongly bound to organic matter and is released only in the digester, and sediments reduce its usable capacity, so a scraper or bottom drain is needed (FNR 2010, Ch. 3).
Sources of the process data
- Pitk et al. (2014). Mesophilic co-digestion of dairy manure and lipid rich solid slaughterhouse wastes. Bioresour. Technol.
- Kafle, Chen (2016). Comparison on batch anaerobic digestion of five different livestock manures and prediction of BMP using different statistical models. Waste Manag.
- Weiland (2010). Biogas production: current state and perspectives. Appl. Microbiol. Biotechnol.
- Rozporządzenie (WE) nr 1069/2009 określające przepisy sanitarne dotyczące produktów ubocznych pochodzenia zwierzęcego (art. 9, 10, 12–14, 24)
- Rozporządzenie Komisji (UE) nr 142/2011 wykonujące rozporządzenie (WE) nr 1069/2009 (zał. IV rozdz. III, zał. V rozdz. I i III)
- FNR (2010). Guía sobre el Biogás – Desde la producción hasta el uso (hiszp. wydanie „Leitfaden Biogas”, GIZ 2013)
The co-digestion calculator will assess a specific mixture containing this substrate.
What it is and where it comes from
Cattle manure is a mixture of cattle excreta and bedding, most often straw, arising in bedded cowsheds and on resting areas. The dataset also includes dairy cattle excreta, including the American "dairy manure", versions without bedding or with sawdust, and fresh excreta from developing countries. Polish dairy and beef farms produce large quantities of manure, which is traditionally used as a fertiliser. After slurry, manure is the most commonly used substrate of agricultural biogas plants.
Properties relevant to digestion
The dry matter of manure is higher than in slurry, and the material contains undigested feed fibres and bedding, that is, a lot of cellulose, hemicelluloses and lignin. The unit methane potential is therefore moderate, and decomposition is slow. Manure is a good source of nitrogen, trace elements and microflora, and the ammonia risk is lower than with poultry litter. Long straw fibres can form a floating crust or block pumps, so they require shredding. Sand from the resting areas settles in the tanks.
How to read the spread of results
The dataset contains many records from numerous sources, so the spread reflects the real variability of the material. It is determined by the type and amount of bedding (straw, sawdust), the feed, the age of the animals, the manure storage time (clamp composting lowers the potential, because part of the matter is mineralised) and comminution. Methodological differences are added: the inoculum (several records are described by inoculum numbers), temperature, substrate-to-inoculum ratio, test length and the way of converting to VS. A single figure must therefore be treated as an indicative point on a wide range.
In biogas plant practice
Manure is a good basis for mixtures with substrates of higher potential (silages, food waste). It requires shredding and even dosing, and a dose of dry manure increases the viscosity of the suspension. Fresh manure gives a better result than manure stored for a long time. On the farm it is a natural fertiliser, subject to the fertilisation rules, and in the context of ABP it is category 2 material, which may be used in a biogas plant under the conditions set out in EU and national regulations.
For comparison with slurry, manure is harder to handle (feeding, mixing), but has a higher concentration of organic matter per tonne of fresh matter. This difference matters when planning logistics and tank sizes.
Methodology in brief
BMP is the amount of methane obtained from volatile solids (VS) in a batch test, given in m³ CH₄ per tonne of VS (numerically the same as NmL CH₄/g VS in the publications) and converted to normal conditions (0 °C, 101.325 kPa). The weighted mean gives each publication a total weight of 1, split equally between its results for the substrate — a paper testing twenty varieties does not outweigh a paper with a single sample. In inter-laboratory programmes the unit is the laboratory (total weight 1), and within it the weight of a test grows with the number of bottles (replicates). Results after pretreatment (e.g. thermal, chemical, enzymatic) are shown separately and are not included in the mean.
Solid lines are curves measured in the tests. Where a publication gives only the final result, we draw a first-order kinetic model, B(t) = B₀·(1 − e−kt): only the end point comes from the publication, and the shape of the curve serves purely as visualisation — do not read the production on a particular day from it. For this substrate k = 0.393 d−1 was assumed (median of rate constants k reported in the sources and/or fitted to the mean measured curves).
The statistics describe the spread of published results — a descriptive compilation, not a meta-analysis or a guarantee of plant yield.
Bibliography
- Lallement, A.; Siaud, A.; Peyrelasse, C.; Kaparaju, P.; Schraauwers, B.; Maunas, S.; Monlau, F. (2021). Impact of Operational Factors, Inoculum Origin, and Feedstock Preservation on the Biochemical Methane Potential. Bioengineering 8(11), 176. DOI: 10.3390/bioengineering8110176 DOI
- Legesse, H.A.; Debele, W.H.; Wachemo, A.C. (2024). Anaerobic co-digestion of khat waste and cow dung for enhanced bio-methane production potential: Substrates conversion rate. Heliyon 10(24), e41124. DOI: 10.1016/j.heliyon.2024.e41124 DOI
- Baek, G.; Kim, D.; Kim, J.; Kim, H.; Lee, C. (2020). Treatment of Cattle Manure by Anaerobic Co-Digestion with Food Waste and Pig Manure: Methane Yield and Synergistic Effect. International Journal of Environmental Research and Public Health 17(13), 4737. DOI: 10.3390/ijerph17134737 DOI
- Rubio, J.A.; Romero, L.I.; Wilkie, A.C.; García-Morales, J.L. (2019). Mesophilic Anaerobic Co-digestion of Olive-Mill Waste With Cattle Manure: Effects of Mixture Ratio. Frontiers in Sustainable Food Systems 3, 9. DOI: 10.3389/fsufs.2019.00009 DOI
- Saha, C.K.; Nime, J.; Khatun, M.L.; Sharna, T.H.; Alam, M.M. (2025). Rice straw co-digestion potential with cow dung and poultry droppings for maximizing biogas production in Bangladesh. Heliyon 11(4), e42687. DOI: 10.1016/j.heliyon.2025.e42687 DOI
- Cu, T.T.T.; Nguyen, T.X.; Triolo, J.M.; Pedersen, L.; Le, V.D.; Le, P.D.; Sommer, S.G. (2014). Biogas Production from Vietnamese Animal Manure, Plant Residues and Organic Waste: Influence of Biomass Composition on Methane Yield. Asian-Australasian Journal of Animal Sciences 28(2), 280–289. DOI: 10.5713/ajas.14.0312 DOI
- Kafle, G.K.; Chen, L. (2016). Comparison on batch anaerobic digestion of five different livestock manures and prediction of biochemical methane potential (BMP) using different statistical models. Waste Management 48, 492–502. DOI: 10.1016/j.wasman.2015.10.021 DOI
- Kouas, M.; Torrijos, M.; Sousbie, P.; Steyer, J.P.; Sayadi, S.; Harmand, J. (2017). Robust assessment of both biochemical methane potential and degradation kinetics of solid residues in successive batches. Waste Management 70, 59–70. DOI: 10.1016/j.wasman.2017.09.001 DOI
- Labatut, R.A.; Angenent, L.T.; Scott, N.R. (2011). Biochemical methane potential and biodegradability of complex organic substrates. Bioresource Technology 102(3), 2255–2264. DOI: 10.1016/j.biortech.2010.10.035 DOI
- Lallement, A.; Peyrelasse, C.; Lagnet, C.; Barakat, A.; Schraauwers, B.; Maunas, S.; Monlau, F. (2023). A Detailed Database of the Chemical Properties and Methane Potential of Biomasses Covering a Large Range of Common Agricultural Biogas Plant Feedstocks. Waste 1(1), 195–227. DOI: 10.3390/waste1010014 DOI
- Li, Y.; Zhang, R.; Liu, G.; Chen, C.; He, Y.; Liu, X. (2013). Comparison of methane production potential, biodegradability, and kinetics of different organic substrates. Bioresource Technology 149, 565–569. DOI: 10.1016/j.biortech.2013.09.063 DOI
- Lisboa, M.S.; Lansing, S. (2013). Characterizing food waste substrates for co-digestion through biochemical methane potential (BMP) experiments. Waste Management 33(12), 2664–2669. DOI: 10.1016/j.wasman.2013.09.004 DOI
- Eliasson, K.A.; Singh, A.; Isaksson, S.; Schnürer, A. (2023). Co‐substrate composition is critical for enrichment of functional key species and for process efficiency during biogas production from cattle manure. Microbial Biotechnology 16(2), 350–371. DOI: 10.1111/1751-7915.14194 DOI
- Schumacher, B.; Zerback, T.; Wedwitschka, H.; Weinrich, S.; Hofmann, J.; Nelles, M. (2019). The Influence of Pressure-Swing Conditioning Pre-Treatment of Cattle Manure on Methane Production. Bioengineering 7(1), 6. DOI: 10.3390/bioengineering7010006 DOI
All sources of the site: bibliography.
Other substrates in the group “Animal excreta (slurry, manure, poultry litter)”
Human faeces/excreta — BMP: 2 studies, weighted mean 322 m³ CH₄/t VS
322 m³ CH₄/t VS weighted mean from 2 studies
≈56 %
Pig manure (solid) — BMP: 5 studies, weighted mean 293 m³ CH₄/t VS
293 m³ CH₄/t VS weighted mean from 5 studies
good — editorial rating for biogas plants≈54 %
Mixed/unspecified manure — BMP: 5 studies, weighted mean 289 m³ CH₄/t VS
289 m³ CH₄/t VS weighted mean from 5 studies
good — editorial rating for biogas plants≈53 %
Pig slurry — BMP: 15 studies, weighted mean 260 m³ CH₄/t VS
260 m³ CH₄/t VS weighted mean from 15 studies
very good — editorial rating for biogas plants≈55 %