

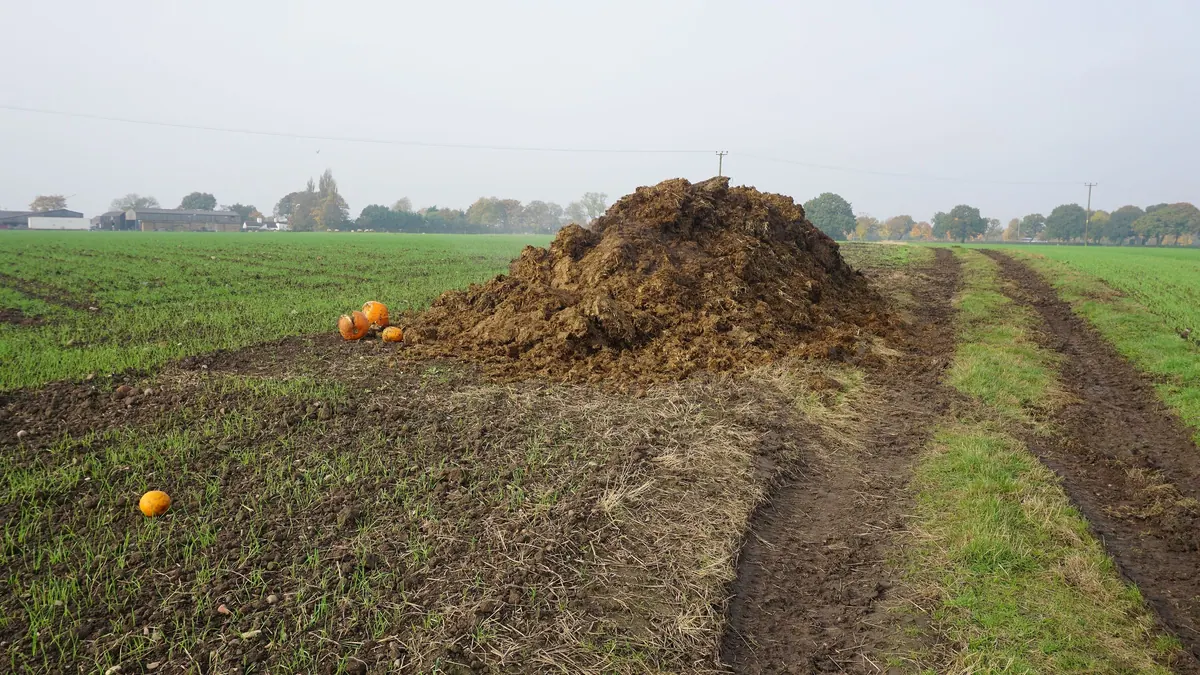
BMP testingAnimal excreta (slurry, manure, poultry litter)single study (5 samples)
Mixed/unspecified manure — BMP: 5 studies, weighted mean 289 m³ CH₄/t VS
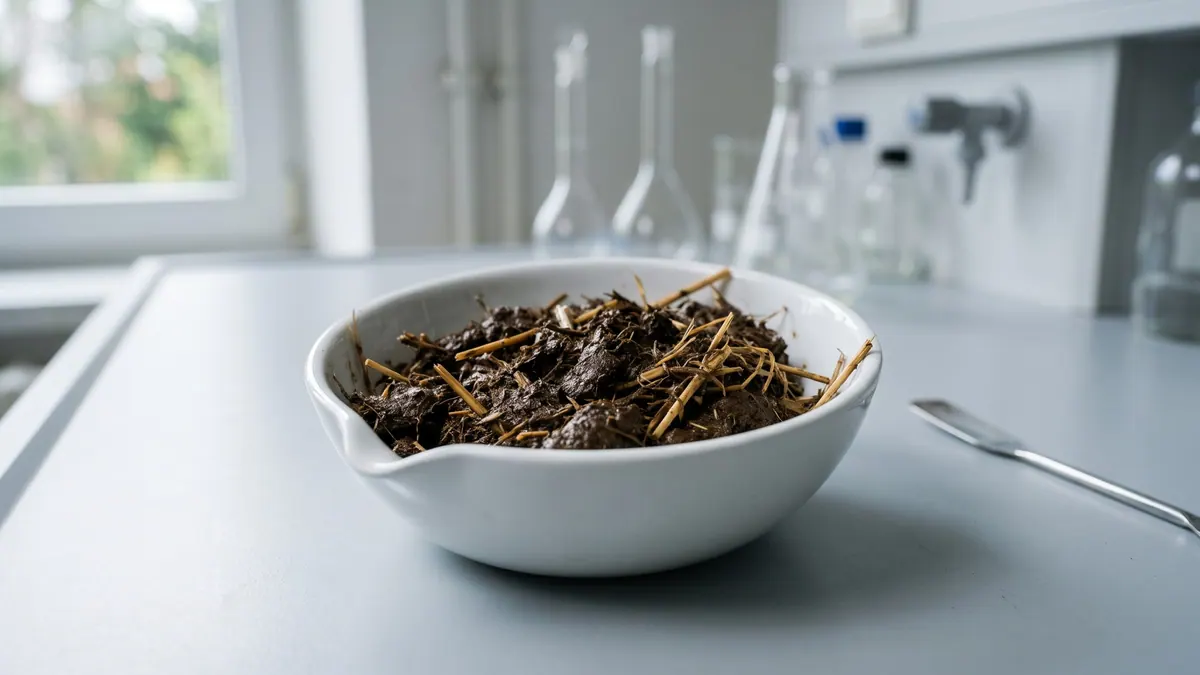
Mixed and unspecified manure is a collective item (e.g. from a zoo, strawy manure), so the results reflect a variable composition and do not describe a single animal species.
rating: goodCH₄ ≈ 53 % (estimate)
Photo Bill Boaden / Wikimedia Commons, licence CC BY-SA 2.0, source file; changes: cropping

- Weighted mean
- 289m³ CH₄/t VS
- Range
- 235–366m³ CH₄/t VS
- Records
- 5single study (5 samples)
- Publications
- 1source
- Temperatures
- 38 °Cof the test
Methane in biogas
Medium methane content · ≈ 5.3 kWh/m³ of biogas
estimate from the substrate type The collected studies contain no measurement. The interval follows from the approximate composition (protein from total nitrogen (N 1.9 % DM × 6.25; in manure part of the N is ammonium nitrogen)) and the yields of compound groups according to FNR.
Rating for biogas plants
good — editorial rating for biogas plantsStable, usually accepted without a fee
Potential per tonne of fresh matter: high (55 m³ CH₄/t); stabilises the process (high alkalinity). Handling costs: fibres, floating layer.
Why? Rating factors
Potential per tonne +2
- +2potential 55 m³ CH₄/t fresh matter (BMP 289 × DM 22.3 % × VS 86 %)
Process stability +1.5
- +1.5high alkalinity — stabilises the pH of the mixture
Handling and costs −0.5
- −0.5fibres, floating layer — shredding and intensive mixing
Total points: 3 · thresholds: ≥ 2.5 very good, ≥ 1 good, below — neutral; negative with cumulative process risk.
“very good” requires a very high potential per tonne without significant risks and costs — “good” at most.
Add to the co-digestion calculator CSV data
BMP curves from 5 studies
Weighted mean Individual records
Dashed lines are a model curve (first-order kinetics, B(t) = B₀·(1 − e−kt)); the end point comes from the publication. All curves are model curves.
Cumulative methane production over the test [m³ CH₄/t VS]. The thick line is the weighted mean of all records (289); dots mark the end values given in the publications. Point at the chart to read values; click a legend item to hide or show a record.
Records and sources
Download CSV| Source | BMP m³ CH₄/t VS | Temperature | Sample | Curve |
|---|---|---|---|---|
| Lallement et al. (2023) · 1 DOI | 235 | 38 °C · mesophilic | Zoo manure | end point (model curve) |
| Lallement et al. (2023) · 2 DOI | 243 | 38 °C · mesophilic | Mix manure | end point (model curve) |
| Lallement et al. (2023) · 3 DOI | 253 | 38 °C · mesophilic | manure | end point (model curve) |
| Lallement et al. (2023) · 4 DOI | 347 | 38 °C · mesophilic | straw manure | end point (model curve) |
| Lallement et al. (2023) · 5 DOI | 366 | 38 °C · mesophilic | straw manure | end point (model curve) |
| Weighted mean | 289 | arithmetic mean 289, SD 62 | ||
Typical composition
- Dry matter (DM)
- 22.3% (range 15.3–32.1)
- Volatile solids (VS)
- 86 % DM (range 54–90)
- Nitrogen
- 1.9 % DM
- C/N ratio
- 21.5
Median and range of the determinations reported in the publications behind this substrate's BMP records (read from: MY-D); dry matter: 5 determinations, volatile solids: 5 determinations. C/N was calculated as the ratio of C and N content (% DM) from the same source.
Sources: Lallement et al. (2023).
The composition of the raw material varies between batches — for plant calculations use an analysis of your own sample. The calculator inserts typical values automatically.
Process properties
Low confidence: the description is based on general characteristics of the substrate group, not on studies of this material. Treat it as a hint to be verified.
Advantages
- Methane potential in the Substraty.pl BMP dataset: weighted mean 289.0 m³ CH₄/t VS (SD 62.3; 5 records, 1 source).
- A collective entry - composition depends on the species and bedding; buffer and microflora as in manure (Kafle and Chen 2016).
Drawbacks and risks
- High variability - requires batch analysis.
- The straw fraction degrades slowly.
Dosing
No source threshold.
Introduce gradually, starting with a small dose and monitoring the process (e.g. FOS/TAC, pH, gas composition).
Practical requirements
- ABP cat. 2 (Art. 9 of Reg. 1069/2009): manure, slurry and digestive tract content may be digested without prior sterilisation if the authority does not recognise a risk of spreading a serious transmissible disease (Art. 13(e)(ii)); in that case a minimum of 70 °C for a minimum of 60 min applies (Reg. 142/2011, Annex V Ch. III Section 1), and where they are the only material of animal origin in the installation, the authority may approve other requirements (Section 2 point 3).
Sources of the process data
- Kafle, Chen (2016). Comparison on batch anaerobic digestion of five different livestock manures and prediction of BMP using different statistical models. Waste Manag.
- Rozporządzenie (WE) nr 1069/2009 określające przepisy sanitarne dotyczące produktów ubocznych pochodzenia zwierzęcego (art. 9, 10, 12–14, 24)
- Rozporządzenie Komisji (UE) nr 142/2011 wykonujące rozporządzenie (WE) nr 1069/2009 (zał. IV rozdz. III, zał. V rozdz. I i III)
The co-digestion calculator will assess a specific mixture containing this substrate.
What it is and where it comes from
This item collects manure samples for which the animal species was not clearly indicated or which are a mixture of several species. The dataset includes manure from a zoological garden, a mixture of manures, a sample described simply as "manure" and strawy manure of unspecified origin. All the records come from a single study. In practice this corresponds to a situation in which a farm delivers mixed manure from several herds to the biogas plant.
Properties relevant to digestion
The composition depends on the animal species (ruminants, horses, pigs, poultry), the bedding and the feed. Strawy manure contains a lot of lignin and fibre, so it decomposes slowly, whereas an admixture of poultry or pig excreta increases the nitrogen share. The zoo supplies excreta of exotic animals, with a different diet. A common feature of manures is the presence of microflora and trace elements, and usually a moderate unit potential and good buffering capacity.
How to read the spread of results
Because the item combines unspecified materials, the spread reflects their diversity, not measurement uncertainty. All the records come from one source, so the differences between them result mainly from the composition of the samples, not from different methodology. When applying this to your own installation, the real composition of the manure, the amount of bedding, the storage time and comminution matter. The data in this item do not replace testing of your own batch.
In biogas plant practice
Mixed manure is well suited as a substrate base in agricultural installations, provided that its composition is stable. Variable quality makes dosing difficult, so it is worth monitoring dry matter and carrying out periodic BMP tests. Comminution of the bedding improves flow and mixing. Manure is a natural fertiliser on the farm, and in the context of ABP it is category 2 material, which may be used in a biogas plant under the conditions set out in EU and national regulations; excreta of animals from zoological gardens may be subject to additional veterinary requirements.
For this reason this item should not be used to compare substrates, but rather to assess the order of magnitude for a material whose origin cannot be established. More precise planning requires separating the streams by species or regular laboratory testing of your own batches.
Methodology in brief
BMP is the amount of methane obtained from volatile solids (VS) in a batch test, given in m³ CH₄ per tonne of VS (numerically the same as NmL CH₄/g VS in the publications) and converted to normal conditions (0 °C, 101.325 kPa). The weighted mean gives each publication a total weight of 1, split equally between its results for the substrate — a paper testing twenty varieties does not outweigh a paper with a single sample. In inter-laboratory programmes the unit is the laboratory (total weight 1), and within it the weight of a test grows with the number of bottles (replicates). Results after pretreatment (e.g. thermal, chemical, enzymatic) are shown separately and are not included in the mean.
Solid lines are curves measured in the tests. Where a publication gives only the final result, we draw a first-order kinetic model, B(t) = B₀·(1 − e−kt): only the end point comes from the publication, and the shape of the curve serves purely as visualisation — do not read the production on a particular day from it. For this substrate k = 0.393 d−1 was assumed (median of rate constants k reported in the sources and/or fitted to the mean measured curves).
The statistics describe the spread of published results — a descriptive compilation, not a meta-analysis or a guarantee of plant yield.
Bibliography
- Lallement, A.; Peyrelasse, C.; Lagnet, C.; Barakat, A.; Schraauwers, B.; Maunas, S.; Monlau, F. (2023). A Detailed Database of the Chemical Properties and Methane Potential of Biomasses Covering a Large Range of Common Agricultural Biogas Plant Feedstocks. Waste 1(1), 195–227. DOI: 10.3390/waste1010014 DOI
All sources of the site: bibliography.
Other substrates in the group “Animal excreta (slurry, manure, poultry litter)”
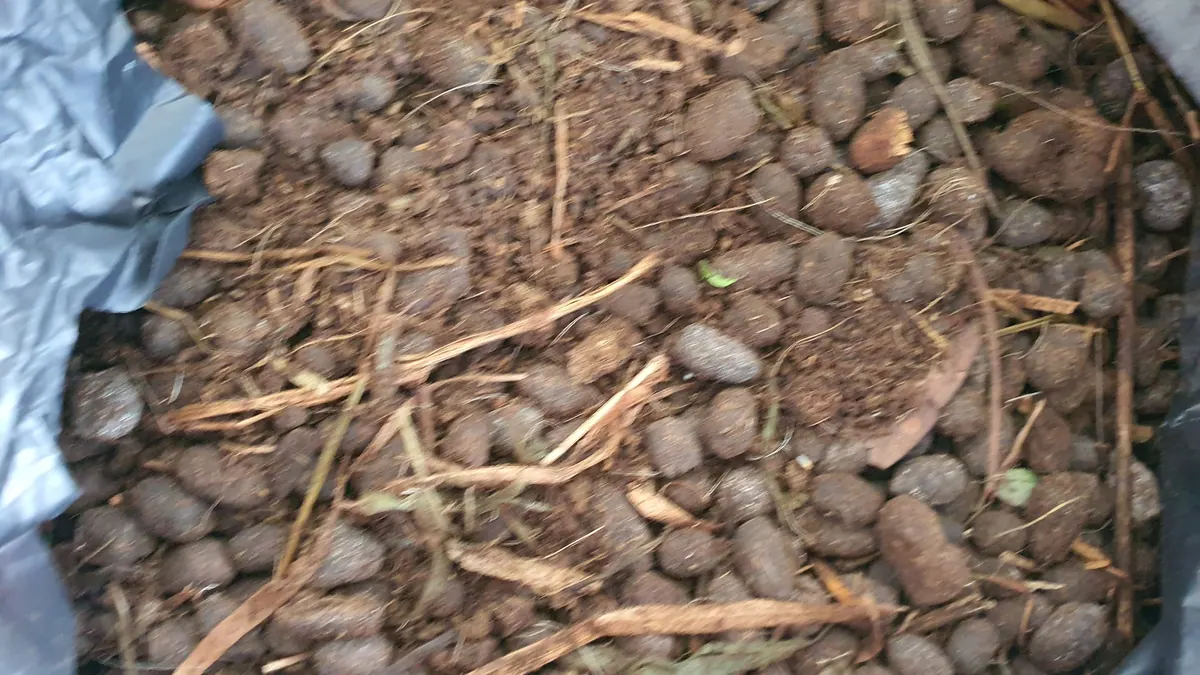
Goat manure — BMP: 2 studies, weighted mean 157 m³ CH₄/t VS
157 m³ CH₄/t VS weighted mean from 2 studies
good — editorial rating for biogas plants≈54 %
Insect frass — BMP: 2 studies, weighted mean 244 m³ CH₄/t VS
244 m³ CH₄/t VS weighted mean from 2 studies
≈56 %
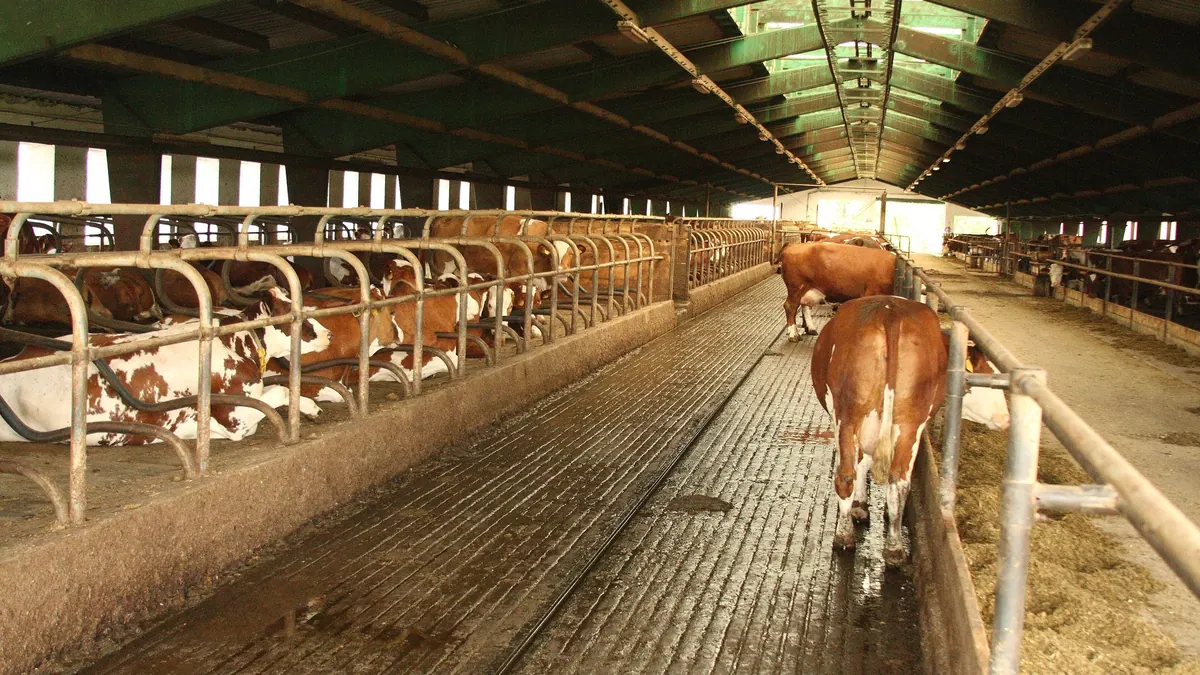
Cattle slurry — BMP: 14 studies, weighted mean 236 m³ CH₄/t VS
236 m³ CH₄/t VS weighted mean from 14 studies
very good — editorial rating for biogas plants≈54 %
Pig manure (solid) — BMP: 5 studies, weighted mean 293 m³ CH₄/t VS
293 m³ CH₄/t VS weighted mean from 5 studies
good — editorial rating for biogas plants≈54 %