

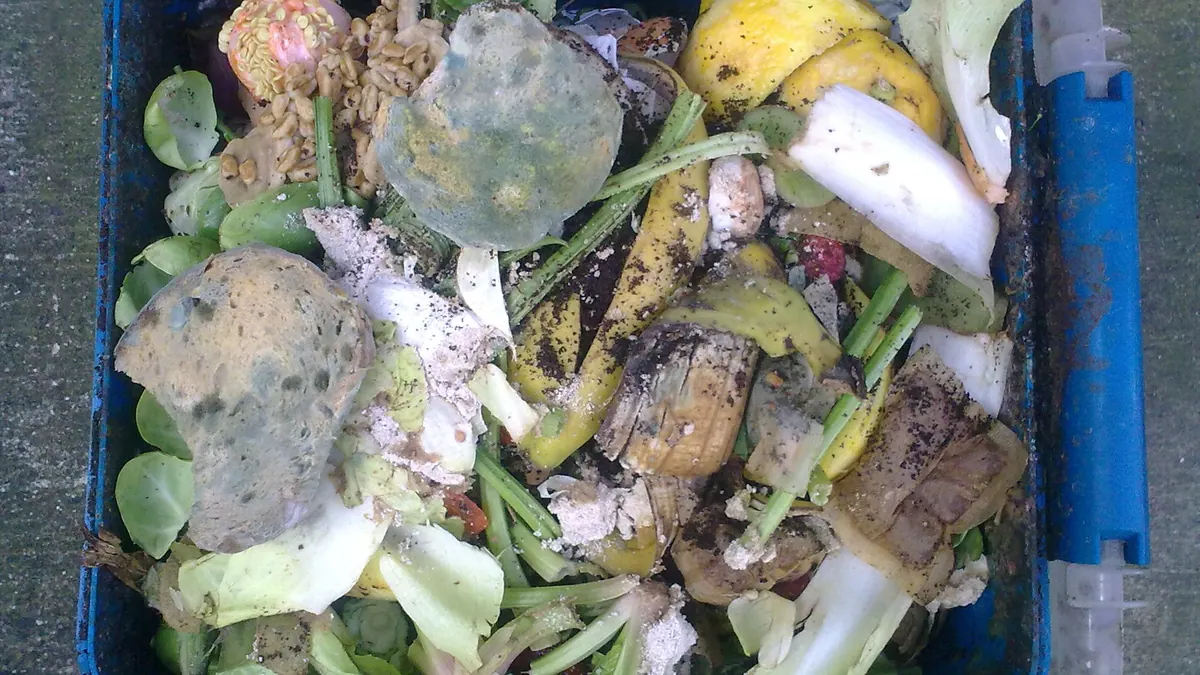
BMP testingFood and catering waste
Food waste — BMP: 22 studies, weighted mean 466 m³ CH₄/t VS
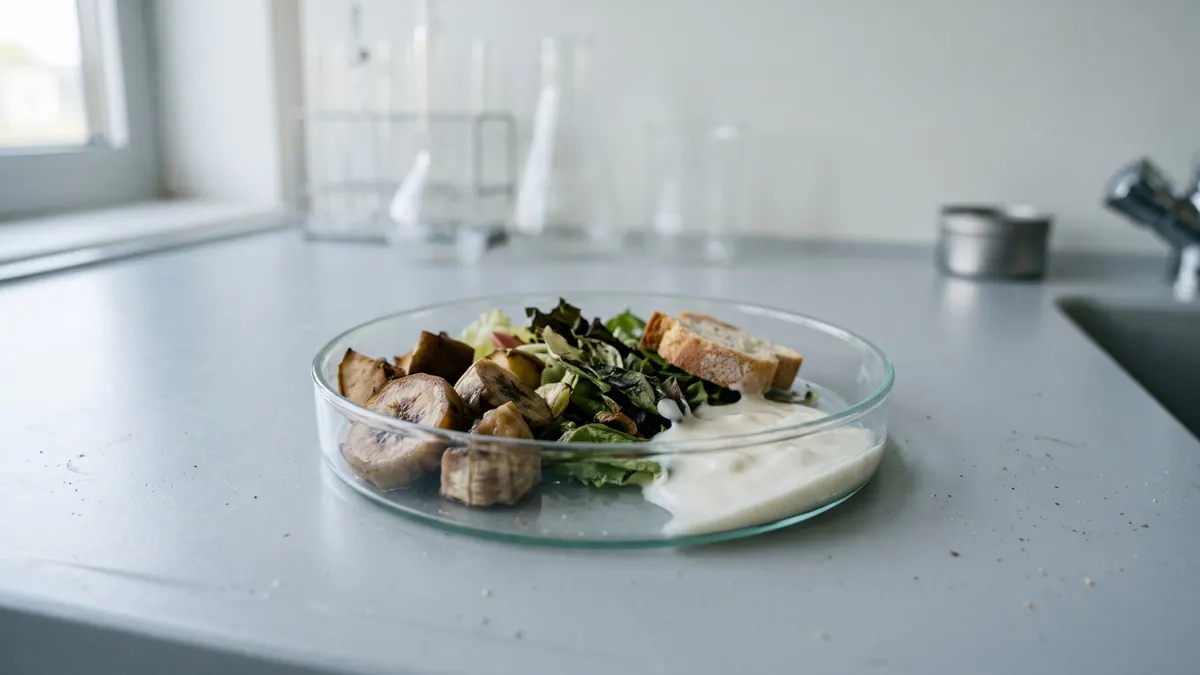
Food waste (leftovers, kitchen waste) is one of the highest-yielding but most variable substrates; the composition and impurities strongly affect the result.
rating: neutralCH₄ ≈ 62 % (estimate)
Photo Nick Saltmarsh / Wikimedia Commons, licence CC BY 2.0, source file; changes: cropping

- Weighted mean
- 466m³ CH₄/t VS
- Range
- 135–700m³ CH₄/t VS
- Records
- 22studies
- Publications
- 12sources
- Temperatures
- 30 °C, 35 °C, 37 °C, 38 °Cof the test
Methane in biogas
High methane content · ≈ 6.2 kWh/m³ of biogas
estimate from the substrate type The collected studies contain no measurement. The interval follows from the approximate composition (protein from total nitrogen (N 2.9 % DM × 6.25); fat-rich (process classification)) and the yields of compound groups according to FNR.
Rating for biogas plants
neutral — editorial rating for biogas plantsNo clear advantages — worth charging a fee for accepting it
Potential per tonne of fresh matter: very high (100 m³ CH₄/t); process risk: fats, protein / nitrogen, salt / sodium. Handling costs: ABP cat. 3, physical contaminants (packaging, plastics).
Why? Rating factors
Potential per tonne +3
- +3potential 100 m³ CH₄/t fresh matter (BMP 466 × DM 24.1 % × VS 89.2 %)
Process stability −2.25
- −1fats: risk of accumulation of long-chain fatty acids (LCFA), flotation and overloading
- −0.5protein / nitrogen: risk of ammonia inhibition at higher shares
- −0.5salt / sodium: inhibition at high shares
- −0.25acidification: rapid degradation / acidic pH, risk of VFA accumulation, needs buffering
Handling and costs −2
- −1ABP cat. 3: pasteurisation at 70 °C / 60 min
- −1physical contaminants (packaging, plastics) — depackaging and separation
Total points: −1.25 · thresholds: ≥ 2.5 very good, ≥ 1 good, below — neutral; negative with cumulative process risk.
Add to the co-digestion calculator CSV data
BMP curves from 22 studies
Weighted mean Individual records
Dashed lines are a model curve (first-order kinetics, B(t) = B₀·(1 − e−kt)); the end point comes from the publication. Solid lines are measurements (3).
Cumulative methane production over the test [m³ CH₄/t VS]. The thick line is the weighted mean of all records (466); dots mark the end values given in the publications. Point at the chart to read values; click a legend item to hide or show a record.
Show the remaining records in the legend (10)
Records and sources
Download CSV| Source | BMP m³ CH₄/t VS | Temperature | Sample | Curve |
|---|---|---|---|---|
| Chickering i Tolaymat (2023) · M+V FOOD DOI | 406 | — · mesophilic | freeze-dried canteen waste, medium variants (orig.: “Freeze-dried food waste — M+V FOOD”): 10% inoculum volume; the remaining 90%: M-1 medium, M+V, SuperQ or tap water, according to the line name | measurement (7 pts) |
| Chickering i Tolaymat (2023) · M-1 FOOD DOI | 411 | — · mesophilic | freeze-dried canteen waste, medium variants (orig.: “Freeze-dried food waste — M-1 FOOD”): 10% inoculum volume; the remaining 90%: M-1 medium, M+V, SuperQ or tap water, according to the line name | measurement (7 pts) |
| Chickering i Tolaymat (2023) · TAP FOOD DOI | 432 | — · mesophilic | freeze-dried canteen waste, medium variants (orig.: “Freeze-dried food waste — TAP FOOD”): 10% inoculum volume; the remaining 90%: M-1 medium, M+V, SuperQ or tap water, according to the line name | measurement (7 pts) |
| Baek et al. (2020) DOI | 528 | 35 °C · mesophilic | food waste (FW), mono-digestion (Run 2) | end point (model curve) |
| Browne et al. (2013) · 1 DOI | 419 | 37 °C · mesophilic | food waste · pretreatment: particle size reduction/sample preparation (MY-D: physical treatment) | end point (model curve) |
| Browne et al. (2013) · 2 DOI | 535 | 37 °C · mesophilic | food waste · pretreatment: particle size reduction/sample preparation (MY-D: physical treatment) | end point (model curve) |
| Chynoweth et al. (1993) DOI | 541 | 35 °C · mesophilic | Food waste | end point (model curve) |
| Holliger et al. (2017) · 1 DOI | 499 | — | Industry food waste | end point (model curve) |
| Holliger et al. (2017) · 2 DOI | 519 | — | Food waste | end point (model curve) |
| Holliger et al. (2017) · 3 DOI | 595 | — | Food waste | end point (model curve) |
| Jin et al. (2016) DOI | 700 | 35 °C · mesophilic | Kitchen waste | end point (model curve) |
| Koch et al. (2017) · 1 DOI | 440 | 38 °C · mesophilic | food waste | end point (model curve) |
| Koch et al. (2017) · 2 DOI | 445 | 38 °C · mesophilic | food waste | end point (model curve) |
| Koch et al. (2017) · 3 DOI | 457 | 38 °C · mesophilic | food waste | end point (model curve) |
| Koch et al. (2017) · 4 DOI | 460 | 38 °C · mesophilic | food waste | end point (model curve) |
| Li et al. (2013) DOI | 541 | 37 °C · mesophilic | Kitchen waste | end point (model curve) |
| Llanos-Lizcano et al. (2024) · 1 DOI | 377 | — | Food waste (FW), ISR 2 | end point (model curve) |
| Llanos-Lizcano et al. (2024) · 2 DOI | 410 | — | Food waste (FW), ISR 1 | end point (model curve) |
| Zhang et al. (2019) DOI | 471 | — | Food waste (SFW) | end point (model curve) |
| Osei-Owusu et al. (2024) · 1 DOI | 135 | 30 °C · mesophilic | Food leftovers (FLO) | end point (model curve) |
| Osei-Owusu et al. (2024) · 2 DOI | 199 | 30 °C · mesophilic | Kitchen residues (KR) | end point (model curve) |
| Zhang et al. (2015) DOI | 372 | 37 °C · mesophilic | food waste · pretreatment: particle size reduction/sample preparation (MY-D: physical treatment) | end point (model curve) |
| Weighted mean | 466 | arithmetic mean 450, SD 120 | ||
Typical composition
- Dry matter (DM)
- 24.1% (range 2.4–90.6)
- Volatile solids (VS)
- 89.2 % DM (range 85–91.4)
- Nitrogen
- 2.9 % DM
- C/N ratio
- 15.9
Median and range of the determinations reported in the publications behind this substrate's BMP records (read from: MY-D); dry matter: 6 determinations, volatile solids: 5 determinations. C/N was calculated as the ratio of C and N content (% DM) from the same source. The DM range includes fresh samples as well as samples partly dried or dried before the test – for fresh material the lower part of the range applies, ideally your own measurement.
Sources: Browne et al. (2013); Jin et al. (2016); Koch et al. (2017); Li et al. (2013); Zhang et al. (2015).
The composition of the raw material varies between batches — for plant calculations use an analysis of your own sample. The calculator inserts typical values automatically.
Process properties
Advantages
- Methane potential in the Substraty.pl BMP dataset: weighted mean 466.2 m³ CH₄/t VS (SD 119.7; 22 records, 12 sources).
- High biodegradability and balanced nutrients (Zhang et al. 2007).
- Co-digestion with slurry stabilises the process (Hagos et al. 2017).
Drawbacks and risks
- Mono-digestion of kitchen waste without trace elements ends in instability; stability was achieved after supplementation with Fe, Co, Mo, Ni (Zhang et al. 2012; Ariunbaatar et al. 2016).
- Acidification (sugars), ammonia (protein), LCFA (fat) (Zhang et al. 2007; Chen et al. 2008).
- Packaging and salt in the waste (Mata-Alvarez et al. 2000).
Co-digestion — what to combine it with, what to watch out for
- combines well
substrates: high alkalinity (buffer) — e.g. Cattle manure, Pig slurry, Cattle slurry, Duck slurry, Rumen and digestive tract content
- combines well
substrates: source of trace elements — e.g. Cattle manure, Cattle slurry, Rumen and digestive tract content, Sugarcane filter cake / press mud
Slurry or Fe/Co/Ni/Se supplementation stabilises mono-digestion of food waste.[3][4]
- caution
substrates: fat-rich — e.g. Spent coffee grounds, Primary sludge, Sunflower seeds, Olive pomace / olive mill solid waste, Slaughterhouse waste (cattle, pigs, poultry)
Waste with cooking fat + FOG/oil: LCFA.[5]
Dosing
No universal %; the dose depends on composition. Do not use as the sole feed without trace element supplementation; increase gradually.
Introduce gradually, starting with a small dose and monitoring the process (e.g. FOS/TAC, pH, gas composition).
Practical requirements
- ABP cat. 3 (Art. 10 of Reg. 1069/2009; admitted to biogas plants by Art. 14): hygienisation before the digester in a mandatory unit: shredding to a maximum of 12 mm, temperature throughout the mass of at least 70 °C for at least 60 min without interruption (Reg. 142/2011, Annex V Ch. I Section 1 and Ch. III Section 1); the installation requires approval by the competent authority (Art. 24(1)(g) of Reg. 1069/2009).
- Catering waste that is the only ABP in the plant (or in a mixture with manure, milk, eggs) may be processed under other requirements approved by the authority, provided that they ensure an equivalent reduction in pathogens (Reg. 142/2011, Annex V, Chapter III, Section 2, point 2).
- Do not feed hygienised substrate into the digester hot (FNR 2010, Ch. 3: hygienisation).
- Remove foreign contaminants before dosing: material from biowaste may contain interfering substances, and the co-substrate should be free of them (FNR 2010, Ch. 3).
Sources of the process data
- Hagos et al. (2017). Anaerobic co-digestion process for biogas production: progress, challenges and perspectives. Renew. Sustain. Energy Rev.
- Weiland, P. (2010) Biogas production: current state and perspectives. Applied Microbiology and Biotechnology
- Zhang et al. (2012). Long-term anaerobic digestion of food waste stabilized by trace elements. Waste Manag.
- Ariunbaatar et al. (2016). Enhanced anaerobic digestion of food waste by supplementing trace elements: role of selenium (VI) and iron (II). Front. Environ. Sci.
- Long et al. (2012). Anaerobic co-digestion of fat, oil, and grease (FOG): A review of gas production and process limitations. Process Saf. Environ. Prot.
- Zhang et al. (2007). Characterization of food waste as feedstock for anaerobic digestion. Bioresour. Technol.
- Chen, Cheng, Creamer (2008). Inhibition of anaerobic digestion process: A review. Bioresour. Technol.
- Mata-Alvarez, Mace, Llabres (2000). Anaerobic digestion of organic solid wastes. An overview of research achievements and perspectives. Bioresour. Technol.
- Rozporządzenie (WE) nr 1069/2009 określające przepisy sanitarne dotyczące produktów ubocznych pochodzenia zwierzęcego (art. 9, 10, 12–14, 24)
- Rozporządzenie Komisji (UE) nr 142/2011 wykonujące rozporządzenie (WE) nr 1069/2009 (zał. IV rozdz. III, zał. V rozdz. I i III)
- FNR (2010). Guía sobre el Biogás – Desde la producción hasta el uso (hiszp. wydanie „Leitfaden Biogas”, GIZ 2013)
The co-digestion calculator will assess a specific mixture containing this substrate.
What it is and where it comes from
Food waste consists of leftovers from the preparation and consumption of meals: peelings, uneaten dishes, bread, meat and dairy from households, canteens, restaurants and hotels. In Poland it is mainly biodegradable kitchen waste and biowaste; it goes into separate collection or into mixed waste. The dataset includes many studies from different countries (among others South Korea) and curves measured for freeze-dried canteen waste with different medium variants.
Properties relevant to digestion
Dry matter is moderate, but the VS share is high. The waste contains carbohydrates (rice, pasta, bread, vegetables), proteins and fats, which determine the potential and the risks. Carbohydrates lead to rapid acidification, proteins to ammonia, and fats to VFA inhibition and foaming. The C/N ratio is usually favourable, but mono-digestion without a buffer is unstable. Impurities (bones, glass, plastics, cutlery) must be removed, and table salt in large amounts can inhibit methanogens.
How to read the spread of results
The range of results is very wide because "food waste" is not a single material. Diets differ between countries, as do the share of meat, fat, rice and vegetables, and the way the sample is collected and prepared (fresh, minced, freeze-dried, artificial model mixtures). The substrate-to-inoculum ratio, the adaptation of the inoculum to fat and ammonia, the temperature and the length of the test also matter. At high loading, inhibition appears and lowers the result, so a low value does not always mean a low potential of the material.
In biogas plant practice
Food waste is the basis of many waste-treatment biogas plants. It requires removal of impurities, size reduction and usually hygienisation. Kitchen and catering waste containing components of animal origin are subject to Regulation (EC) No 1069/2009 and its implementing rules, which specify, among other things, the heat-treatment conditions and the particle size; the plant must be approved. Feeding should be steady, with buffering (e.g. with slurry) and monitoring of process parameters. The digestate must meet the requirements for waste or for fertilisers.
It is worth adding that BMP tests on food waste are sometimes carried out on minced or freeze-dried material, whereas a real plant operates on fresh feed. The difference in sample preparation is another reason why literature data should be supplemented with a test of your own stream.
Methodology in brief
BMP is the amount of methane obtained from volatile solids (VS) in a batch test, given in m³ CH₄ per tonne of VS (numerically the same as NmL CH₄/g VS in the publications) and converted to normal conditions (0 °C, 101.325 kPa). The weighted mean gives each publication a total weight of 1, split equally between its results for the substrate — a paper testing twenty varieties does not outweigh a paper with a single sample. In inter-laboratory programmes the unit is the laboratory (total weight 1), and within it the weight of a test grows with the number of bottles (replicates). Results after pretreatment (e.g. thermal, chemical, enzymatic) are shown separately and are not included in the mean.
Solid lines are curves measured in the tests. Where a publication gives only the final result, we draw a first-order kinetic model, B(t) = B₀·(1 − e−kt): only the end point comes from the publication, and the shape of the curve serves purely as visualisation — do not read the production on a particular day from it. For this substrate k = 0.232 d−1 was assumed (median of rate constants k reported in the sources and/or fitted to the mean measured curves).
The statistics describe the spread of published results — a descriptive compilation, not a meta-analysis or a guarantee of plant yield.
Bibliography
- Chickering, G.; Tolaymat, T. (2023). Growth Media Efficacy in Biochemical Methane Potential Assays. Methane 2(2), 176–191. DOI: 10.3390/methane2020013 DOI
- Baek, G.; Kim, D.; Kim, J.; Kim, H.; Lee, C. (2020). Treatment of Cattle Manure by Anaerobic Co-Digestion with Food Waste and Pig Manure: Methane Yield and Synergistic Effect. International Journal of Environmental Research and Public Health 17(13), 4737. DOI: 10.3390/ijerph17134737 DOI
- Browne, J.D.; Allen, E.; Murphy, J.D. (2013). Evaluation of the biomethane potential from multiple waste streams for a proposed community scale anaerobic digester. Environmental Technology 34(13-14), 2027–2038. DOI: 10.1080/09593330.2013.812669 DOI
- Chynoweth, D.; Turick, C.; Owens, J.; Jerger, D.; Peck, M. (1993). Biochemical methane potential of biomass and waste feedstocks. Biomass and Bioenergy 5(1), 95–111. DOI: 10.1016/0961-9534(93)90010-2 DOI
- Holliger, C.; Fruteau de Laclos, H.; Hack, G. (2017). Methane Production of Full-Scale Anaerobic Digestion Plants Calculated from Substrate’s Biomethane Potentials Compares Well with the One Measured On-Site. Frontiers in Energy Research 5, 12. DOI: 10.3389/fenrg.2017.00012 DOI
- Jin, Y.; Li, Y.; Li, J. (2016). Influence of thermal pretreatment on physical and chemical properties of kitchen waste and the efficiency of anaerobic digestion. Journal of Environmental Management 180, 291–300. DOI: 10.1016/j.jenvman.2016.05.047 DOI
- Koch, K.; Lippert, T.; Drewes, J.E. (2017). The role of inoculum’s origin on the methane yield of different substrates in biochemical methane potential (BMP) tests. Bioresource Technology 243, 457–463. DOI: 10.1016/j.biortech.2017.06.142 DOI
- Li, Y.; Zhang, R.; Liu, G.; Chen, C.; He, Y.; Liu, X. (2013). Comparison of methane production potential, biodegradability, and kinetics of different organic substrates. Bioresource Technology 149, 565–569. DOI: 10.1016/j.biortech.2013.09.063 DOI
- Llanos-Lizcano, R.; Senila, L.; Modoi, O.C. (2024). Evaluation of Biochemical Methane Potential and Kinetics of Organic Waste Streams for Enhanced Biogas Production. Agronomy 14(11), 2546. DOI: 10.3390/agronomy14112546 DOI
- Zhang, W.; Torrella, F.; Banks, C.J.; Heaven, S. (2019). Data related to anaerobic digestion of bioplastics: Images and properties of digested bioplastics and digestate, synthetic food waste recipe and packaging information. Data in Brief 25, 103990. DOI: 10.1016/j.dib.2019.103990 DOI
- Osei-Owusu, B.A.; Arthur, R.; Baidoo, M.F.; Oduro-Kwarteng, S.; Amenaghawon, A.N. (2024). Anaerobic co-digestion of human excreta, food leftovers and kitchen residue: 1 ternary mixture design, synergistic effects and RSM approach. Heliyon 10(2), e24080. DOI: 10.1016/j.heliyon.2024.e24080 DOI
- Zhang, W.; Zhang, L.; Li, A. (2015). Enhanced anaerobic digestion of food waste by trace metal elements supplementation and reduced metals dosage by green chelating agent [S, S]-EDDS via improving metals bioavailability. Water Research 84, 266–277. DOI: 10.1016/j.watres.2015.07.010 DOI
All sources of the site: bibliography.
Other substrates in the group “Food and catering waste”
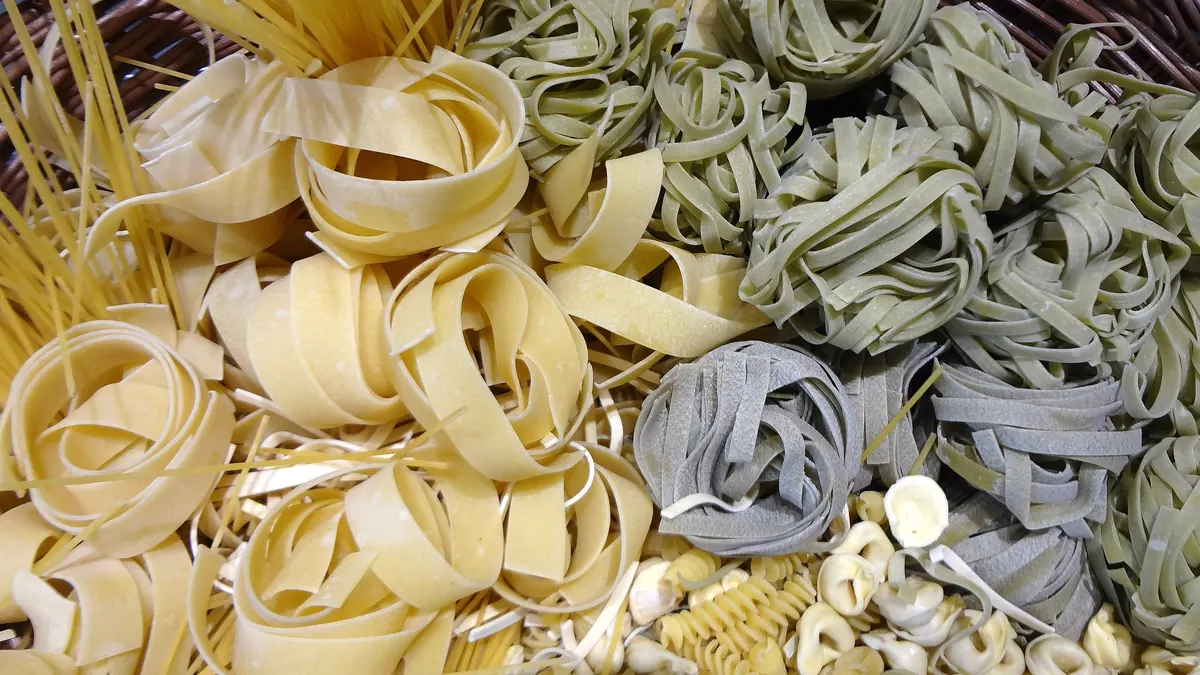
Pasta (food waste) — BMP: 2 studies, weighted mean 310 m³ CH₄/t VS
310 m³ CH₄/t VS weighted mean from 2 studies
≈52 %
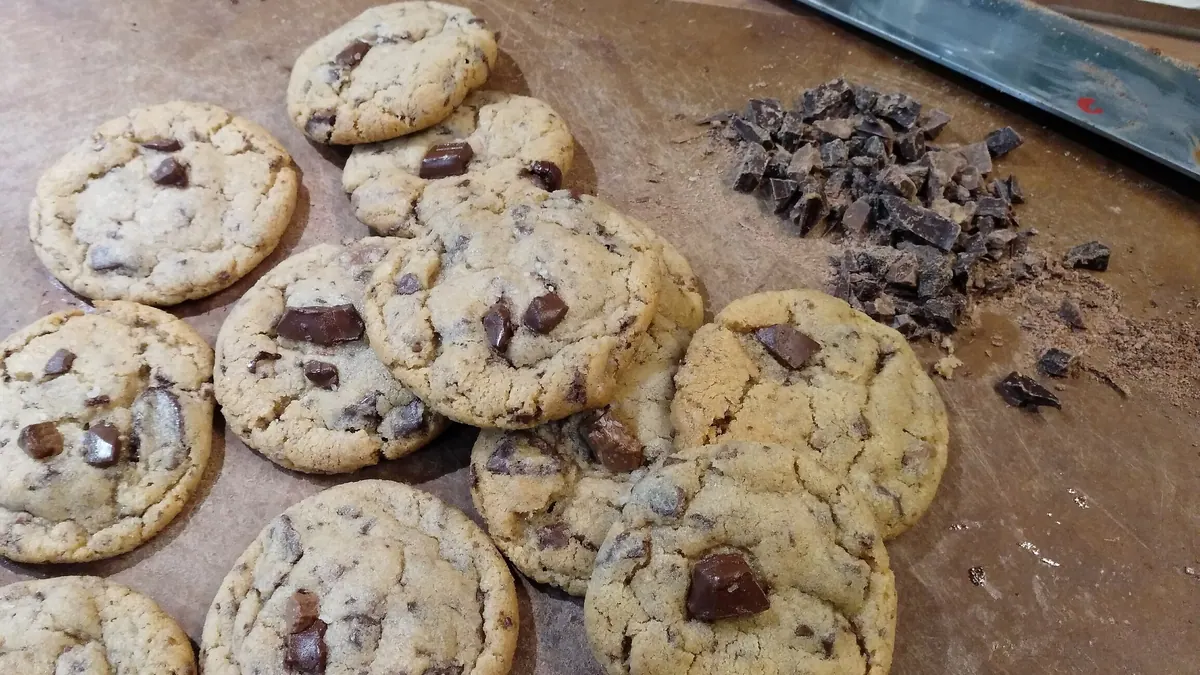
Confectionery waste — BMP: 6 studies, weighted mean 318 m³ CH₄/t VS
318 m³ CH₄/t VS weighted mean from 6 studies
neutral — editorial rating for biogas plants≈63 %
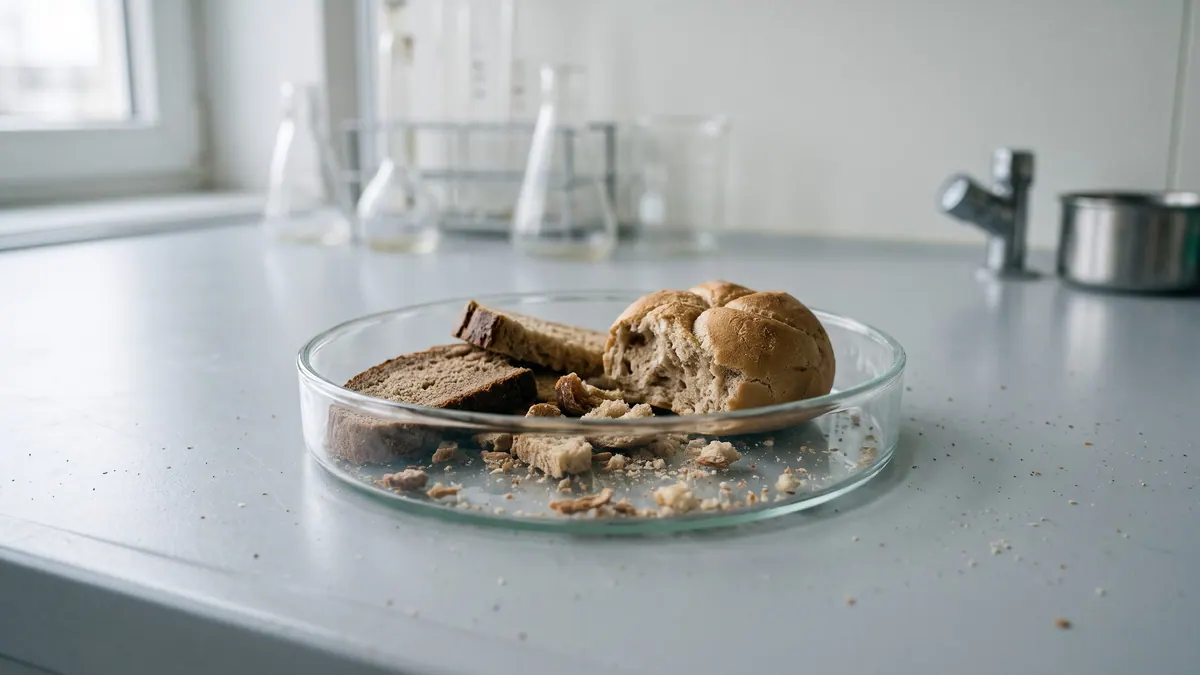
Bread and bakery waste — BMP: 7 studies, weighted mean 370 m³ CH₄/t VS
370 m³ CH₄/t VS weighted mean from 7 studies
48 %
Supermarket waste (mixed) — BMP: 3 studies, weighted mean 417 m³ CH₄/t VS
417 m³ CH₄/t VS weighted mean from 3 studies
≈66 %