

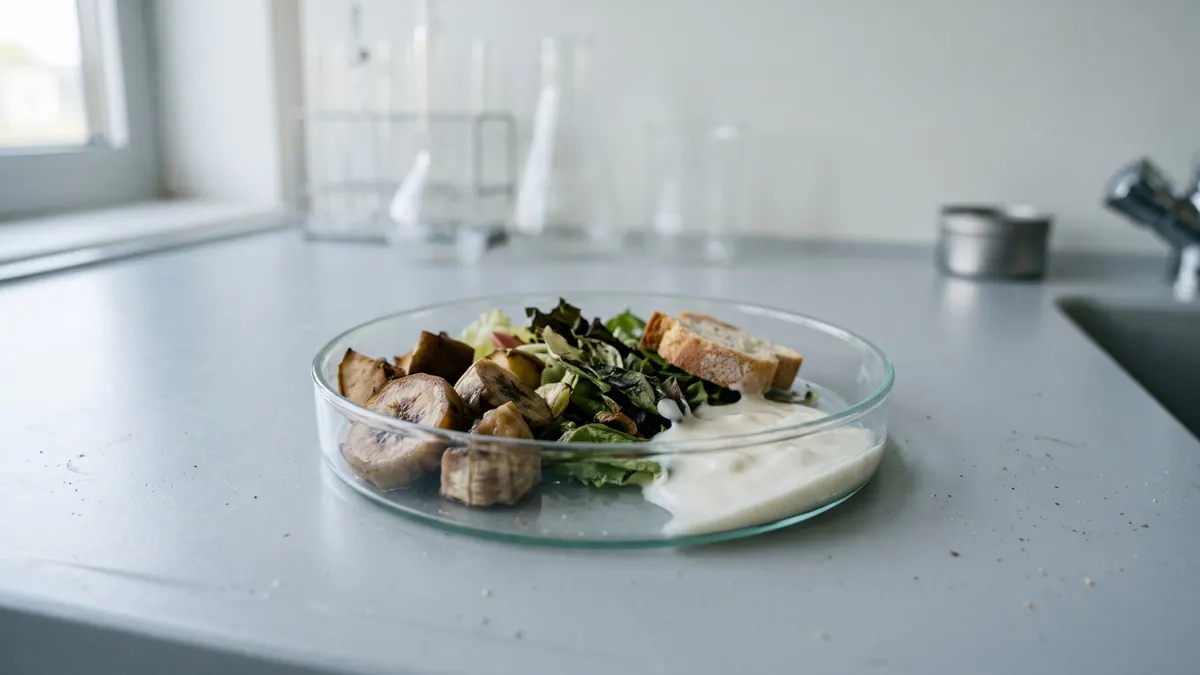
BMP testingFood and catering wastesingle study (3 samples)
Supermarket waste (mixed) — BMP: 3 studies, weighted mean 417 m³ CH₄/t VS
Mixed supermarket waste (out-of-date food) has a high potential and a variable composition; replicates of a single mixed sample were tested.
Illustration: FeedstockData (AI, Google Gemini)
- Weighted mean
- 417m³ CH₄/t VS
- Range
- 400–440m³ CH₄/t VS
- Records
- 3single study (3 samples)
- Publications
- 1source
- Temperatures
- 36 °Cof the test
Methane in biogas
High methane content · ≈ 6.6 kWh/m³ of biogas
estimate from the substrate type The collected studies contain no measurement. The interval follows from the approximate composition (protein-rich (process classification); fat-rich (process classification)) and the yields of compound groups according to FNR.
Rating for biogas plants
not rated — editorial rating for biogas plants
Not rated: no dry matter or volatile solids in the data. We calculate the rating when the dry matter and volatile solids of the material are known.
Add to the co-digestion calculator CSV data
BMP curves from 3 studies
Weighted mean Individual records
Dashed lines are a model curve (first-order kinetics, B(t) = B₀·(1 − e−kt)); the end point comes from the publication. All curves are model curves.
Cumulative methane production over the test [m³ CH₄/t VS]. The thick line is the weighted mean of all records (417); dots mark the end values given in the publications. Point at the chart to read values; click a legend item to hide or show a record.
Records and sources
Download CSV| Source | BMP m³ CH₄/t VS | Temperature | Sample | Curve |
|---|---|---|---|---|
| Alkanok et al. (2014) · 1 DOI | 400 | 36 °C · mesophilic | mixed waste | end point (model curve) |
| Alkanok et al. (2014) · 2 DOI | 410 | 36 °C · mesophilic | mixed waste | end point (model curve) |
| Alkanok et al. (2014) · 3 DOI | 440 | 36 °C · mesophilic | mixed waste | end point (model curve) |
| Weighted mean | 417 | arithmetic mean 417, SD 21 | ||
Process properties
Low confidence: the description is based on general characteristics of the substrate group, not on studies of this material. Treat it as a hint to be verified.
Advantages
- Methane potential in the Substraty.pl BMP dataset: weighted mean 416.7 m³ CH₄/t VS (SD 20.8; 3 records, 1 source).
- A mixture of carbohydrates, protein and fat gives a broad degradation profile (Zhang et al. 2007).
Drawbacks and risks
- Plastic packaging, glass and metal (Mata-Alvarez et al. 2000).
- Composition depends on the day and the product range - variable VFA/NH3 risk (Zhang et al. 2007).
- Preservatives, salt and alcohol may inhibit (Chen et al. 2008).
Co-digestion — what to combine it with, what to watch out for
- combines well
substrates: high alkalinity (buffer) — e.g. Cattle manure, Pig slurry, Cattle slurry, Duck slurry, Rumen and digestive tract content
- combines well
substrates: source of trace elements — e.g. Cattle manure, Cattle slurry, Rumen and digestive tract content, Sugarcane filter cake / press mud
Dosing
No source-based threshold; start with a low share after several batch analyses.
Introduce gradually, starting with a small dose and monitoring the process (e.g. FOS/TAC, pH, gas composition).
Practical requirements
- ABP cat. 3 (Art. 10 of Reg. 1069/2009; admitted to biogas plants by Art. 14): hygienisation before the digester in a mandatory unit: shredding to a maximum of 12 mm, temperature throughout the mass of at least 70 °C for at least 60 min without interruption (Reg. 142/2011, Annex V Ch. I Section 1 and Ch. III Section 1); the installation requires approval by the competent authority (Art. 24(1)(g) of Reg. 1069/2009).
- Do not feed hygienised substrate into the digester hot (FNR 2010, Ch. 3: hygienisation).
- Remove foreign contaminants before dosing: material from biowaste may contain interfering substances, and the co-substrate should be free of them (FNR 2010, Ch. 3).
Sources of the process data
- Hagos et al. (2017). Anaerobic co-digestion process for biogas production: progress, challenges and perspectives. Renew. Sustain. Energy Rev.
- Weiland, P. (2010) Biogas production: current state and perspectives. Applied Microbiology and Biotechnology
- Zhang et al. (2012). Long-term anaerobic digestion of food waste stabilized by trace elements. Waste Manag.
- Zhang et al. (2007). Characterization of food waste as feedstock for anaerobic digestion. Bioresour. Technol.
- Mata-Alvarez, Mace, Llabres (2000). Anaerobic digestion of organic solid wastes. An overview of research achievements and perspectives. Bioresour. Technol.
- Chen, Cheng, Creamer (2008). Inhibition of anaerobic digestion process: A review. Bioresour. Technol.
- Rozporządzenie (WE) nr 1069/2009 określające przepisy sanitarne dotyczące produktów ubocznych pochodzenia zwierzęcego (art. 9, 10, 12–14, 24)
- Rozporządzenie Komisji (UE) nr 142/2011 wykonujące rozporządzenie (WE) nr 1069/2009 (zał. IV rozdz. III, zał. V rozdz. I i III)
- FNR (2010). Guía sobre el Biogás – Desde la producción hasta el uso (hiszp. wydanie „Leitfaden Biogas”, GIZ 2013)
The co-digestion calculator will assess a specific mixture containing this substrate.
What it is and where it comes from
Supermarket waste consists of food products that have lost their commercial usability: out-of-date, damaged, with compromised packaging, or unsold. It includes bread, fruit and vegetables, cold cuts, meat, dairy, ready meals and drinks. In the food waste hierarchy, priority goes to preventing waste and passing food on for consumption, and only then to energy recovery. The dataset contains replicates of a mixed sample from one supermarket, tested at mesophilic temperature.
Properties relevant to digestion
The mixture contains both readily available carbohydrates (bread, fruit, sweets) and protein and fat (meat, dairy, cold cuts), so its methane potential is high. Fats and proteins increase the risk of VFA and ammonia inhibition, and sugars the risk of rapid acidification. The waste contains plastic, metal and glass packaging, which must be removed. Salt, preservatives and alcohol from some products can inhibit microorganisms if the dose is high. The composition depends on the day of the week and on the shop's product range.
How to read the spread of results
Records from a single study are close to each other because they come from the same sample or from replicates. This does not mean that supermarket waste has a constant value: differences between shops, seasons and deliveries can be considerable. The result depends on the share of fatty and protein fractions, the degree of size reduction, the removal of packaging, the substrate-to-inoculum ratio, the adaptation of the inoculum and the temperature. For your own stream it is worth running a series of tests on several batches.
In biogas plant practice
Such waste is a valuable substrate for waste-treatment biogas plants. It requires depackaging (separation of packaging), size reduction and homogenisation and, where components of animal origin are present, also hygienisation in accordance with Regulation (EC) No 1069/2009 and its implementing rules; the plant must hold the relevant approval. Feeding should be steady, with monitoring of pH, volatile acids and ammonia. Food waste is waste within the meaning of the waste act, so permits and BDO register records apply.
Compared with kitchen waste, this stream is usually more uniform over the course of the week, but contains a larger share of packaged and processed products and a smaller share of plate waste. Packaging is therefore the main technological problem, not the methane potential itself.
Methodology in brief
BMP is the amount of methane obtained from volatile solids (VS) in a batch test, given in m³ CH₄ per tonne of VS (numerically the same as NmL CH₄/g VS in the publications) and converted to normal conditions (0 °C, 101.325 kPa). The weighted mean gives each publication a total weight of 1, split equally between its results for the substrate — a paper testing twenty varieties does not outweigh a paper with a single sample. In inter-laboratory programmes the unit is the laboratory (total weight 1), and within it the weight of a test grows with the number of bottles (replicates). Results after pretreatment (e.g. thermal, chemical, enzymatic) are shown separately and are not included in the mean.
Solid lines are curves measured in the tests. Where a publication gives only the final result, we draw a first-order kinetic model, B(t) = B₀·(1 − e−kt): only the end point comes from the publication, and the shape of the curve serves purely as visualisation — do not read the production on a particular day from it. For this substrate k = 0.232 d−1 was assumed (median of rate constants k reported in the sources and/or fitted to the mean measured curves).
The statistics describe the spread of published results — a descriptive compilation, not a meta-analysis or a guarantee of plant yield.
Bibliography
- Alkanok, G.; Demirel, B.; Onay, T.T. (2014). Determination of biogas generation potential as a renewable energy source from supermarket wastes. Waste Management 34(1), 134–140. DOI: 10.1016/j.wasman.2013.09.015 DOI
All sources of the site: bibliography.
Other substrates in the group “Food and catering waste”
Confectionery waste — BMP: 6 studies, weighted mean 318 m³ CH₄/t VS
318 m³ CH₄/t VS weighted mean from 6 studies
neutral — editorial rating for biogas plants≈63 %
Food waste — BMP: 22 studies, weighted mean 466 m³ CH₄/t VS
466 m³ CH₄/t VS weighted mean from 22 studies
neutral — editorial rating for biogas plants≈62 %
Pasta (food waste) — BMP: 2 studies, weighted mean 310 m³ CH₄/t VS
310 m³ CH₄/t VS weighted mean from 2 studies
≈52 %
Bread and bakery waste — BMP: 7 studies, weighted mean 370 m³ CH₄/t VS
370 m³ CH₄/t VS weighted mean from 7 studies
48 %