

BMP testingFood and catering waste
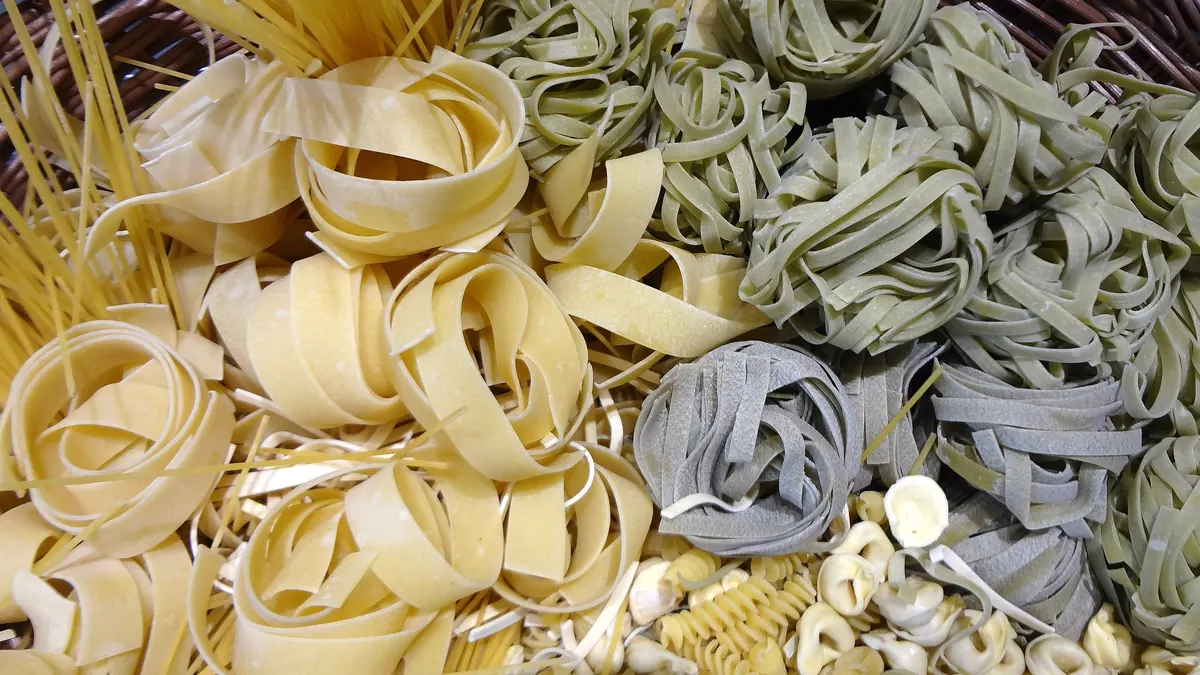
Pasta (food waste) — BMP: 2 studies, weighted mean 310 m³ CH₄/t VS
Pasta from catering waste is a starch-rich material that digests quickly and well, but easily acidifies the reactor at a larger dose.
Photo David Adam Kess / Wikimedia Commons, licence CC BY-SA 4.0, source file; changes: cropping

- Weighted mean
- 310m³ CH₄/t VS
- Range
- 293–326m³ CH₄/t VS
- Records
- 2studies
- Publications
- 2sources
- Temperatures
- 35 °Cof the test
Methane in biogas
Medium methane content · ≈ 5.2 kWh/m³ of biogas
estimate from the substrate type The collected studies contain no measurement. The interval follows from the approximate composition (carbohydrate-dominated (no protein or fat characteristics)) and the yields of compound groups according to FNR.
Rating for biogas plants
not rated — editorial rating for biogas plants
Not rated: no dry matter or volatile solids in the data. We calculate the rating when the dry matter and volatile solids of the material are known.
Add to the co-digestion calculator CSV data
BMP curves from 2 studies
Weighted mean Individual records
Dashed lines are a model curve (first-order kinetics, B(t) = B₀·(1 − e−kt)); the end point comes from the publication. All curves are model curves.
Cumulative methane production over the test [m³ CH₄/t VS]. The thick line is the weighted mean of all records (310); dots mark the end values given in the publications. Point at the chart to read values; click a legend item to hide or show a record.
Records and sources
Download CSV| Source | BMP m³ CH₄/t VS | Temperature | Sample | Curve |
|---|---|---|---|---|
| Kouas et al. (2017) DOI | 293 | 35 °C · mesophilic | pasta | end point (model curve) |
| Labatut et al. (2011) DOI | 326 | 35 °C · mesophilic | Plain pasta | end point (model curve) |
| Weighted mean | 310 | arithmetic mean 310, SD 23 | ||
Typical composition
- Volatile solids (VS)
- 97 % DM (range 97–97)
Median and range of the determinations reported in the publications behind this substrate's BMP records (read from: MY-D); dry matter: 0 determinations, volatile solids: 1 determination. No DM in the sources – the calculator has to ask for a value.
Sources: Labatut et al. (2011).
The composition of the raw material varies between batches — for plant calculations use an analysis of your own sample. The calculator inserts typical values automatically.
Process properties
Low confidence: the description is based on general characteristics of the substrate group, not on studies of this material. Treat it as a hint to be verified.
Advantages
- Methane potential in the Substraty.pl BMP set: weighted mean 309.6 m³ CH₄/t VS (SD 23.4; 2 records, 2 sources).
- A starchy substrate with rapid hydrolysis; improves the C/N of a protein feed (Zhang et al. 2007).
Drawbacks and risks
- Rapid acidification at a high dose (Hagos et al. 2017).
- The sauce may bring in salt and fat.
Co-digestion — what to combine it with, what to watch out for
- combines well
substrates: high alkalinity (buffer) — e.g. Cattle manure, Pig slurry, Cattle slurry, Duck slurry, Rumen and digestive tract content
Dosing
No source threshold.
Introduce gradually, starting with a small dose and monitoring the process (e.g. FOS/TAC, pH, gas composition).
Sources of the process data
- Hagos et al. (2017). Anaerobic co-digestion process for biogas production: progress, challenges and perspectives. Renew. Sustain. Energy Rev.
- Weiland, P. (2010) Biogas production: current state and perspectives. Applied Microbiology and Biotechnology
- Zhang et al. (2007). Characterization of food waste as feedstock for anaerobic digestion. Bioresour. Technol.
The co-digestion calculator will assess a specific mixture containing this substrate.
What it is and where it comes from
Pasta is a product made from wheat flour, which in catering waste occurs as leftover cooked pasta from kitchens, canteens and households. Unused dry pasta is also a waste in shops and production plants. The dataset contains several samples: cooked pasta and pasta without meat, tested under mesophilic conditions. Pasta is usually part of a broader stream of food waste.
Properties relevant to digestion
Pasta consists mainly of starch (gelatinised after cooking and readily available to amylases), as well as wheat protein and small amounts of fat. Readily available carbohydrates cause a rapid rise in volatile acids and, at a high dose, a fall in pH and disturbance of methanogenesis. On the other hand, the material has a low nitrogen-to-carbon ratio, so it combines well with protein-rich substrates or slurry. Pasta in sauce may contain salt, fat, garlic and onion, which in larger amounts affect digestion.
How to read the spread of results
The values are similar, but they come from different studies, so the differences may result from the form of the pasta (fresh, cooked, kitchen waste), additions (sauces, meat), comminution and test conditions. The substrate-to-inoculum ratio, temperature, adaptation of the inoculum to starch and incubation length all have an effect. The small number of records does not define a typical range, and the composition of a particular catering waste may differ considerably from pure pasta.
In biogas plant practice
Pasta is a valuable co-substrate in installations that accept food waste. It should be dosed evenly, in a mixture with buffering materials, and pH and volatile acids should be monitored. Cooked pasta spoils quickly, so storage should be short. If the waste contains components of animal origin (meat, cheese, meat sauces), it is subject to the rules on animal by-products, and kitchen and catering waste requires hygienisation and an approved installation.
For comparison with other food waste, pasta is relatively uniform and predictable, which makes dosing easier. However, an excess should not exceed the buffering capacity of the digester, and a sudden increase in the dose is best preceded by gradual acclimatisation of the system.
Methodology in brief
BMP is the amount of methane obtained from volatile solids (VS) in a batch test, given in m³ CH₄ per tonne of VS (numerically the same as NmL CH₄/g VS in the publications) and converted to normal conditions (0 °C, 101.325 kPa). The weighted mean gives each publication a total weight of 1, split equally between its results for the substrate — a paper testing twenty varieties does not outweigh a paper with a single sample. In inter-laboratory programmes the unit is the laboratory (total weight 1), and within it the weight of a test grows with the number of bottles (replicates). Results after pretreatment (e.g. thermal, chemical, enzymatic) are shown separately and are not included in the mean.
Solid lines are curves measured in the tests. Where a publication gives only the final result, we draw a first-order kinetic model, B(t) = B₀·(1 − e−kt): only the end point comes from the publication, and the shape of the curve serves purely as visualisation — do not read the production on a particular day from it. For this substrate k = 0.232 d−1 was assumed (median of rate constants k reported in the sources and/or fitted to the mean measured curves).
The statistics describe the spread of published results — a descriptive compilation, not a meta-analysis or a guarantee of plant yield.
Bibliography
- Kouas, M.; Torrijos, M.; Sousbie, P.; Steyer, J.P.; Sayadi, S.; Harmand, J. (2017). Robust assessment of both biochemical methane potential and degradation kinetics of solid residues in successive batches. Waste Management 70, 59–70. DOI: 10.1016/j.wasman.2017.09.001 DOI
- Labatut, R.A.; Angenent, L.T.; Scott, N.R. (2011). Biochemical methane potential and biodegradability of complex organic substrates. Bioresource Technology 102(3), 2255–2264. DOI: 10.1016/j.biortech.2010.10.035 DOI
All sources of the site: bibliography.
Other substrates in the group “Food and catering waste”
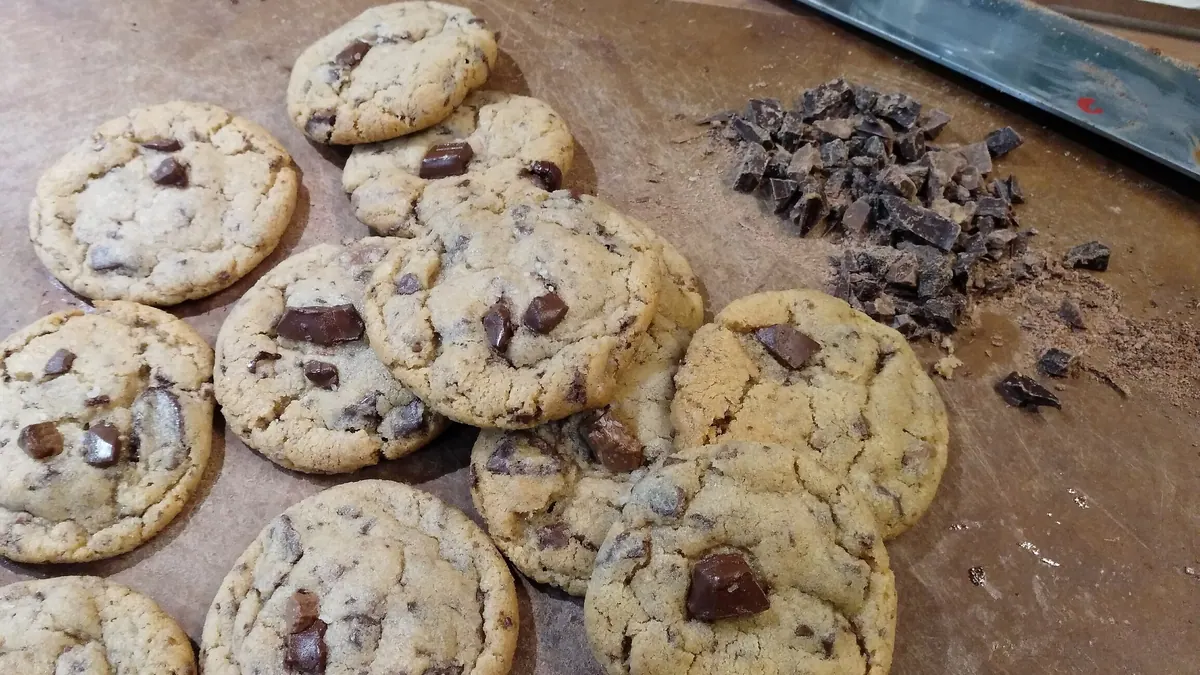
Confectionery waste — BMP: 6 studies, weighted mean 318 m³ CH₄/t VS
318 m³ CH₄/t VS weighted mean from 6 studies
neutral — editorial rating for biogas plants≈63 %
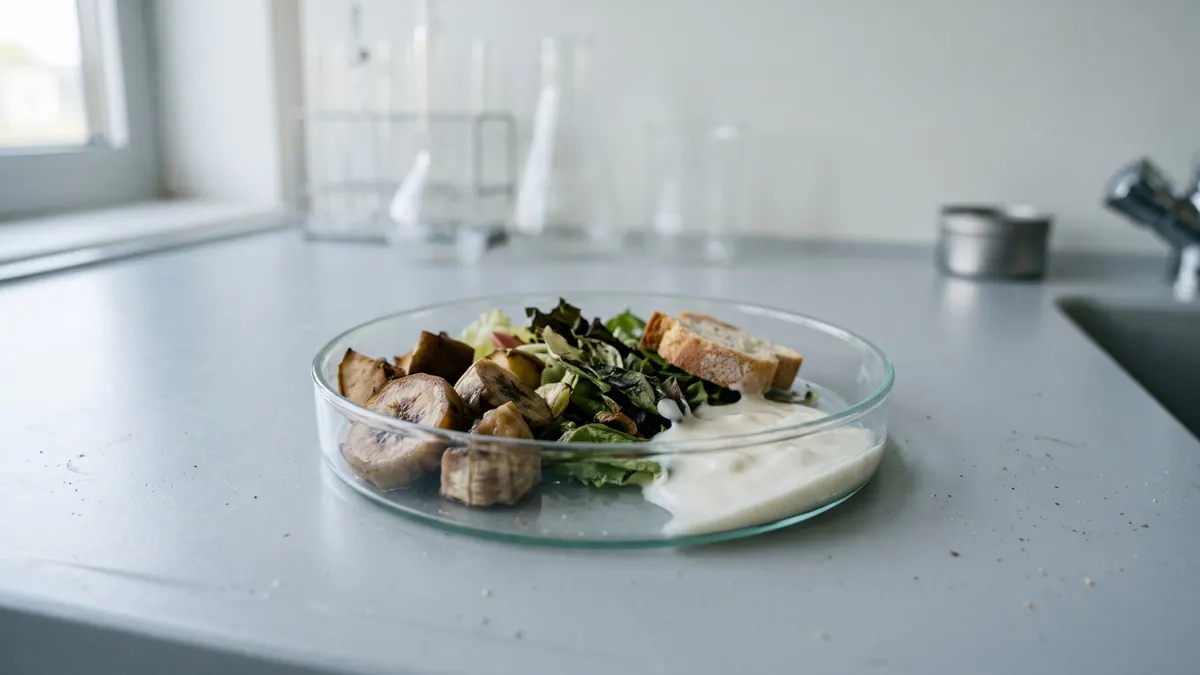
Supermarket waste (mixed) — BMP: 3 studies, weighted mean 417 m³ CH₄/t VS
417 m³ CH₄/t VS weighted mean from 3 studies
≈66 %
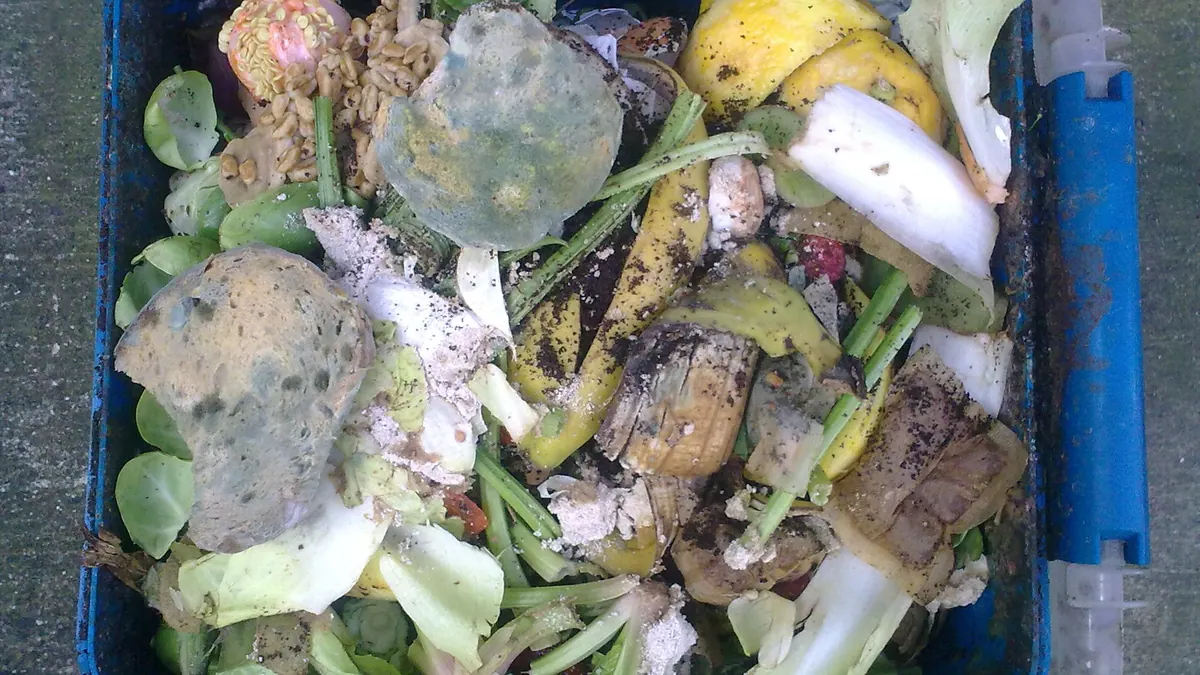
Food waste — BMP: 22 studies, weighted mean 466 m³ CH₄/t VS
466 m³ CH₄/t VS weighted mean from 22 studies
neutral — editorial rating for biogas plants≈62 %
Bread and bakery waste — BMP: 7 studies, weighted mean 370 m³ CH₄/t VS
370 m³ CH₄/t VS weighted mean from 7 studies
48 %