BiogasExplainer
Variability of biogas composition and quantity: where CH₄ fluctuations come from and how to measure them
Agricultural biogas is usually 50–65% CH₄, the rest mainly CO₂. Where fluctuations over the day and the season come from, how the substrate affects composition, and how to measure gas flow and composition correctly.
Other language versions: polski.
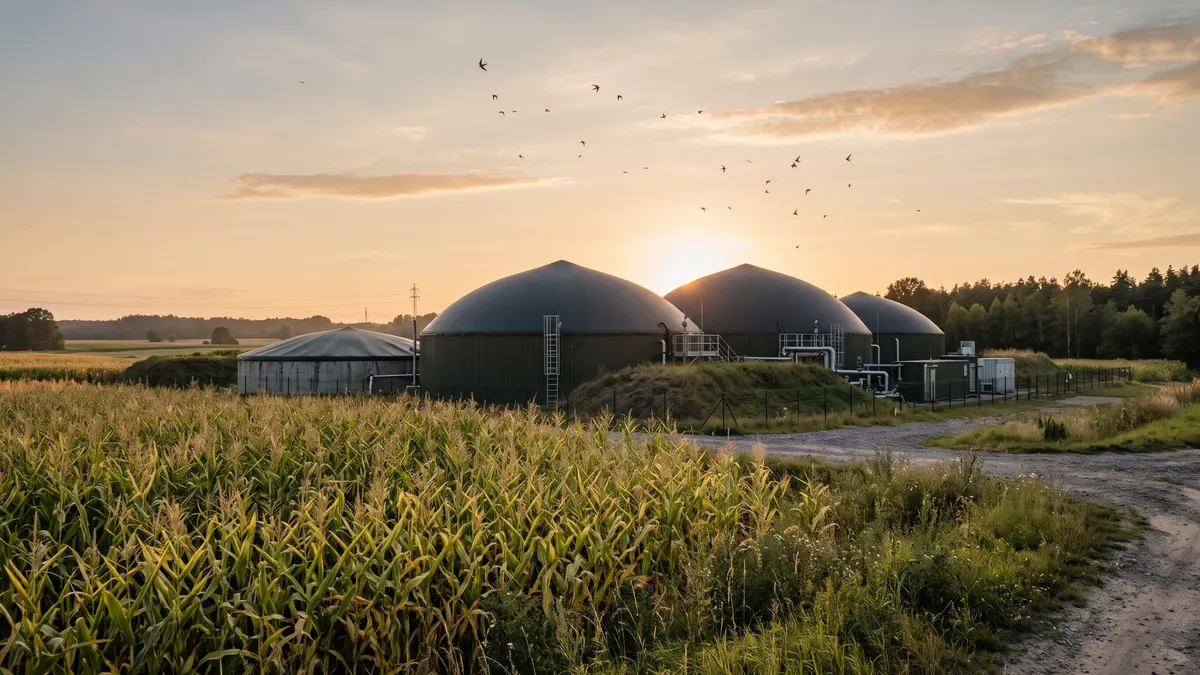
Biogas from agricultural installations usually contains 50–65% methane and 35–50% carbon dioxide, as well as trace amounts of hydrogen sulphide, ammonia, water vapour and sometimes nitrogen and oxygen. The composition and quantity are not constant: they change over the day (after feeding), over weeks (after a change of mix or of the state of the process) and over the year (silage quality, temperature). Understanding the sources of variability is a precondition for correctly assessing the operation of the installation and selecting end-use equipment (CHP, upgrading).
What affects the CH₄ content
| Factor | Effect |
|---|---|
| Substrate composition | fats and proteins give biogas richer in CH₄; carbohydrates – poorer (about half) |
| State of the process | acidification lowers CH₄ and raises CO₂; a stable process – higher CH₄ |
| Temperature and pH | changes affect the solubility of CO₂ in the liquid; a higher pH binds more CO₂ |
| HRT | a shorter time – fewer fractions degraded, potentially lower CH₄ |
| Air (biological desulphurisation) | dilutes the gas with nitrogen and oxygen, lowering the CH₄ share |
| Gas exchange in the store | layering and pressure change |
Do not confuse the two: the CH₄ share in biogas is not the same as the methane yield per kg VS. Gas with added air has a lower CH₄ share, although the amount of methane is the same.
Daily variability
After fresh substrate is fed, gas production rises over several hours, reaching a peak, and falls before the next dose. Installations that feed once or twice a day have larger fluctuations than those with continuous feeding. The membrane roof smooths out fluctuations for the engine, but rapid changes in composition can affect ignition. Check whether a repeatable daily pattern appears in the measurement data; its absence may indicate a measurement problem.
Seasonal variability
In summer the silage often has a different composition (depending on the harvest), in winter the demand for heat rises. The outside temperature affects condensation and volume measurement if the gas meter is not compensated. Changes in silage quality between batches (e.g. the beginning and end of a clamp, opening a new clamp) can shift the yield by a few to a dozen or so per cent.
How to measure correctly
- Flow: thermal or vortex gas meters with temperature and pressure compensation; convert to Nm³ (0 °C, 1013 mbar) or state the reference conditions clearly.
- Composition: CH₄/CO₂ analysers (IR), O₂ (electrochemical or paramagnetic), H₂S (electrochemical). Ensure sample drying or a correction for moisture.
- Sampling point: at a representative location, after drying, with a sampling line without dead spaces.
- Calibration: with reference gases according to the manufacturer's recommendations (usually every few months to a year), with a log.
- Averaging: record data at short intervals and calculate flow-weighted daily averages.
Normalisation example
The gas meter shows 250 m³/h at 38 °C and a pressure of 1,020 mbar abs. Convert to Nm³: 250 × (273.15/311.15) × (1020/1013.25) ≈ 250 × 0.8779 × 1.0067 ≈ 221 Nm³/h. The difference of about 12% results solely from the measurement conditions; if omitted, it overstates production and distorts comparisons. In addition, gas saturated with water vapour has a lower share of "dry" gas — if the analyser measures dry gas and the gas meter wet gas, humidity must be taken into account (at 38 °C water vapour occupies several per cent of the volume).
Significance for end-use equipment
A gas engine has a limited range of acceptable calorific value and methane number; a fall of CH₄ below the manufacturer's threshold causes a reduction in power or shutdown. Upgrading installations require stable inlet conditions, including control of O₂ and H₂S. Variability in the quantity of gas affects the sizing of the gas store and the flare.
What to do when the composition "floats"
- Check the calibration and the sampling point.
- Compare the gas data with feeding, FOS/TAC and pH.
- Check the air supply to the biological desulphurisation.
- Assess whether a change in the mix is the cause.
- In the event of a continuous fall in CH₄, start the procedure for diagnosing and counteracting acidification or inhibition.
Good gas data are the basis of all subsequent decisions: the energy balance, settlements, KPIs and the assessment of the effects of technological changes.
Data from several months — how to read them
A chart of daily average CH₄ over the whole year usually shows a band of "normal" variability a few percentage points wide. Going outside this band requires an explanation: a change of substrate, an analyser failure, acidification. If the band is very wide, it is a signal that the process is unstable or the measurement unreliable. It is also worth comparing gas from different points (the main digester, the lower digester, the store), because each tank has a slightly different composition.
Impact on settlements
Variability of composition affects the amount of energy in the gas at the same volume. Settlements and reports should be based on energy (normalised volume × CH₄ content × calorific value), not on the biogas volume alone. A difference of 3 percentage points of CH₄ is about 5–6% of the energy at typical composition.
Sources
Related articles