BiogasGuide
Biogas plant mass and energy balance: a worked example from substrate to kilowatt-hours
Step by step: from the mass of substrates and their VS to methane production, energy in the fuel, and net electricity and heat. Explicit assumptions, tables and a sanity check of the result.
Other language versions: polski.
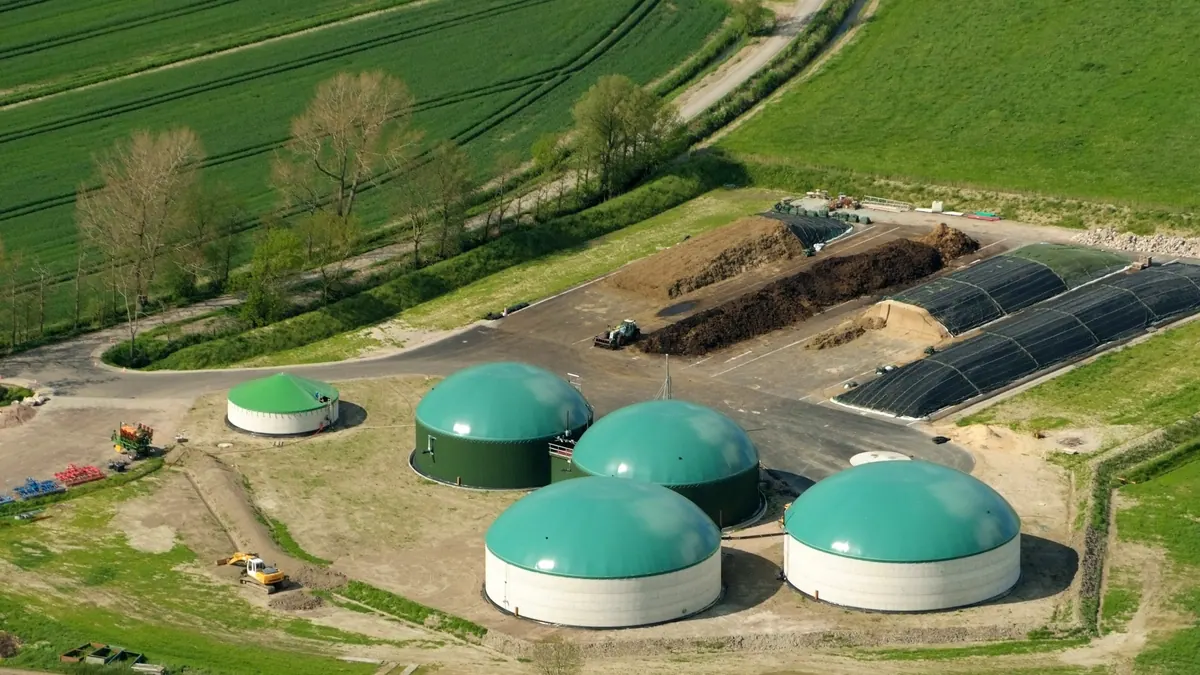

The mass and energy balance of a biogas plant is carried out in six steps: fresh mass → dry matter (TS) → volatile solids (VS) → methane production (yield per kg VS) → chemical energy of the fuel (calorific value) → electrical and thermal energy after taking CHP efficiency and own consumption into account. Below is a full example with explicit assumptions; all the figures are illustrative and should be replaced with your own data from analyses and measurements.
Step 1: daily feed
| Substrate | Fresh mass [t/d] | TS | VS in TS | VS [t/d] | Assumed yield [m³ CH₄/kg VS] |
|---|---|---|---|---|---|
| Maize silage | 20 | 0.33 | 0.95 | 6.27 | 0.34 |
| Cattle slurry | 30 | 0.08 | 0.80 | 1.92 | 0.20 |
| Grass silage | 5 | 0.30 | 0.90 | 1.35 | 0.30 |
| Total | 55 | 9.54 |
The yields are assumed practical values at technical scale, lower than the potentials from BMP tests (see the article on the difference between BMP and technical scale).
Step 2: methane production
- maize silage: 6,270 kg × 0.34 = 2,132 m³ CH₄/d,
- slurry: 1,920 × 0.20 = 384 m³,
- grasses: 1,350 × 0.30 = 405 m³.
Total ≈ 2,921 m³ CH₄/d. At a CH₄ content of 53%, about 5,512 m³/d of biogas is produced (230 m³/h). Average yield: 2,921 / 9,540 ≈ 0.31 m³ CH₄/kg VS — credible (it falls below the theoretical maxima for these substrates).
Step 3: chemical energy
Let us assume a calorific value of methane of 9.97 kWh/m³ (normal conditions). Fuel energy: 2,921 × 9.97 ≈ 29,120 kWh/d, i.e. ≈ 1,213 kW of fuel thermal input (on average).
Step 4: CHP
With an electrical efficiency of 38% and a thermal efficiency of 45% (typical values for gas engines of this class; actual values depend on the model and load):
- gross electricity: 29,120 × 0.38 ≈ 11,066 kWh/d (≈ 461 kW),
- heat: 29,120 × 0.45 ≈ 13,104 kWh/d (≈ 546 kW).
Step 5: own consumption
Let us assume own electricity consumption of 8% of production, i.e. ≈ 885 kWh/d; net energy to the grid ≈ 10,181 kWh/d. Own heat for heating the digester depends on the season; let us assume on average 25% of the CHP heat (≈ 3,276 kWh/d). Heat available to consumers ≈ 9,828 kWh/d, but only part of it is actually used (seasonality).
Step 6: digestate mass balance
The loss of VS in the process is usually several tens of per cent of the VS introduced, depending on the mix and HRT; in this example let us assume 60%. Of the 9.54 t of VS, about 3.8 t of VS then remains in the digestate, to which the inorganic part of the dry matter and water are added. The mass of the digestate equals the mass fed minus the mass of the biogas. With a biogas density of around 1.2 kg/m³ and production of 5,512 m³/d, the mass of gas is about 6.6 t/d, so the digestate is about 48 t/d (55 − 6.6 ≈ 48.4). The result must be taken into account in the plan for storing and hauling the digestate.
Sanity check
| Check | What to verify |
|---|---|
| CH₄ yield / VS | whether it falls within the range possible for the mix and does not exceed the potentials of the substrates |
| Energy production / number of hours | whether it corresponds to the CHP capacity |
| Efficiency | whether the energy balance adds up to the fuel minus losses (the sum of efficiencies is about 80–90%) |
| Volumetric productivity | m³ CH₄ / (m³·d) of digester — should not exceed the technological range |
Sensitivity analysis
Changing the maize yield from 0.34 to 0.30 m³ CH₄/kg VS reduces methane production by about 250 m³/d (−8.6%), and electricity by about 950 kWh/d. Changing the dry matter content of the silage from 33% to 30% reduces VS by about 9%, so it has almost as strong an effect. That is why the accuracy of TS and VS analyses and the weighing of substrates are crucial.
Conclusions
The balance is a tool for planning and control. Repeated every month with real data, it shows where the installation loses energy: in incomplete degradation of the substrate, the flare, low CHP efficiency, excessive own consumption or unused heat.
Notes on the assumptions
CHP efficiencies depend on the model, the load, the service condition and the ambient temperature; operation at part load lowers electrical efficiency. Yields at technical scale are usually lower than BMP results, because part of the material passes through the digester too quickly and mixing is imperfect. The dry matter content of the silage varies with the batch and the harvest date. Own heat for heating the digester is greatest in winter, and in summer there are often few heat consumers — which is why the annual heat balance is worth calculating month by month.
How to turn the example into a tool
Build a spreadsheet in which you enter substrate masses, TS and VS values and yields, and the remaining fields are calculated by formulas. Add columns comparing the plan with reality (gas measurement, energy meter). Differences of a few per cent are normal; larger ones are worth investigating.
Sources
Related articles