


BMP testingEnergy crops and whole-crop plants (WCS)
Napier grass — BMP: 35 studies, weighted mean 253 m³ CH₄/t VS
Elephant grass (napier) is a tropical grass with a very high biomass yield, studied as an energy crop. The dataset covers different growth stages, leaf fractions and silage.
rating: goodCH₄ ≈ 54 % (estimate)
Photo Salil Kumar Mukherjee / Wikimedia Commons, licence CC BY-SA 4.0, source file; changes: cropping

- Weighted mean
- 253m³ CH₄/t VS
- Range
- 98–372m³ CH₄/t VS
- Records
- 35studies
- Publications
- 6sources
- Temperatures
- 35 °C, 37 °Cof the test
Methane in biogas
Medium methane content · ≈ 5.3 kWh/m³ of biogas
estimate from the substrate type The collected studies contain no measurement. The interval follows from the approximate composition (protein from total nitrogen (N 2.1 % DM × 6.25)) and the yields of compound groups according to FNR.
Rating for biogas plants
good — editorial rating for biogas plantsStable, usually accepted without a fee
Potential per tonne of fresh matter: high (83 m³ CH₄/t); no particular threats to stability. Handling costs: fibres, floating layer.
Why? Rating factors
Potential per tonne +2
- +2potential 83 m³ CH₄/t fresh matter (BMP 253 × DM 37.8 % × VS 87.2 %)
Process stability 0
- 0no factors
Handling and costs −0.5
- −0.5fibres, floating layer — shredding and intensive mixing
Total points: 1.5 · thresholds: ≥ 2.5 very good, ≥ 1 good, below — neutral; negative with cumulative process risk.
Add to the co-digestion calculator CSV data
BMP curves from 35 studies
Weighted mean Individual records
Dashed lines are a model curve (first-order kinetics, B(t) = B₀·(1 − e−kt)); the end point comes from the publication. All curves are model curves.
Cumulative methane production over the test [m³ CH₄/t VS]. The thick line is the weighted mean of all records (253); dots mark the end values given in the publications. Point at the chart to read values; click a legend item to hide or show a record.
Show the remaining records in the legend (23)
Records and sources
Download CSV| Source | BMP m³ CH₄/t VS | Temperature | Sample | Curve |
|---|---|---|---|---|
| Tong et al. (1990) DOI | 288 | 35 °C · mesophilic | Napier grass · pretreatment: air dried | end point (model curve) |
| Chynoweth et al. (1993) · 1 DOI | 191 | 35 °C · mesophilic | Napier grass · pretreatment: none (sample designation in the source: R2) | end point (model curve) |
| Chynoweth et al. (1993) · 2 DOI | 221 | 35 °C · mesophilic | Napier grass | end point (model curve) |
| Chynoweth et al. (1993) · 3 DOI | 231 | 35 °C · mesophilic | Napier grass · pretreatment: Dried to 20% moisture R9 | end point (model curve) |
| Chynoweth et al. (1993) · 4 DOI | 238 | 35 °C · mesophilic | Napier grass | end point (model curve) |
| Chynoweth et al. (1993) · 5 DOI | 247 | 35 °C · mesophilic | Napier grass · pretreatment: Dried to 20% moisture R5 | end point (model curve) |
| Chynoweth et al. (1993) · 6 DOI | 248 | 35 °C · mesophilic | Napier grass | end point (model curve) |
| Chynoweth et al. (1993) · 7 DOI | 249 | 35 °C · mesophilic | Napier grass | end point (model curve) |
| Chynoweth et al. (1993) · 8 DOI | 251 | 35 °C · mesophilic | Napier grass · pretreatment: Dried 40% moisture -R8 | end point (model curve) |
| Chynoweth et al. (1993) · 9 DOI | 255 | 35 °C · mesophilic | Napier grass · pretreatment: Dried 40% moisture -R3 | end point (model curve) |
| Chynoweth et al. (1993) · 10 DOI | 257 | 35 °C · mesophilic | Napier grass | end point (model curve) |
| Chynoweth et al. (1993) · 11 DOI | 258 | 35 °C · mesophilic | Napier grass | end point (model curve) |
| Chynoweth et al. (1993) · 12 DOI | 260 | 35 °C · mesophilic | Napier grass | end point (model curve) |
| Chynoweth et al. (1993) · 13 DOI | 264 | 35 °C · mesophilic | Napier grass · pretreatment: Ensiled | end point (model curve) |
| Chynoweth et al. (1993) · 14 DOI | 274 | 35 °C · mesophilic | Napier grass · pretreatment: none (sample designation in the source: R3) | end point (model curve) |
| Chynoweth et al. (1993) · 15 DOI | 291 | 35 °C · mesophilic | Napier grass | end point (model curve) |
| Chynoweth et al. (1993) · 16 DOI | 294 | 35 °C · mesophilic | Napier grass | end point (model curve) |
| Chynoweth et al. (1993) · 17 DOI | 310 | 35 °C · mesophilic | Napier grass · pretreatment: Ensiled | end point (model curve) |
| Dahunsi (2019) · 1 DOI | 200 | 37 °C · mesophilic | grass silage Pennisetum puroureum | end point (model curve) |
| Dahunsi (2019) · 2 DOI | 202 | 37 °C · mesophilic | grass silage Pennisetum puroureum | end point (model curve) |
| Gunaseelan (2004) · 1 DOI | 342 | 35 °C · mesophilic | NapierGrass Sheath | end point (model curve) |
| Gunaseelan (2004) · 2 DOI | 372 | 35 °C · mesophilic | NapierGrass Lamina | end point (model curve) |
| Kouas et al. (2017) DOI | 255 | 35 °C · mesophilic | napier grass | end point (model curve) |
| Surendra i Khanal (2015) · 1 DOI | 98 | 37 °C · mesophilic | Napier Grass growth stage 8 | end point (model curve) |
| Surendra i Khanal (2015) · 2 DOI | 103 | 37 °C · mesophilic | Napier Grass growth stage 8 | end point (model curve) |
| Surendra i Khanal (2015) · 3 DOI | 112 | 37 °C · mesophilic | Napier Grass growth stage 8 | end point (model curve) |
| Surendra i Khanal (2015) · 4 DOI | 121 | 37 °C · mesophilic | Napier Grass growth stage 6 | end point (model curve) |
| Surendra i Khanal (2015) · 5 DOI | 123 | 37 °C · mesophilic | Napier Grass growth stage 6 | end point (model curve) |
| Surendra i Khanal (2015) · 6 DOI | 150 | 37 °C · mesophilic | Napier Grass growth stage 6 | end point (model curve) |
| Surendra i Khanal (2015) · 7 DOI | 181 | 37 °C · mesophilic | Napier Grass growth stage 4 | end point (model curve) |
| Surendra i Khanal (2015) · 8 DOI | 189 | 37 °C · mesophilic | Napier Grass growth stage 4 | end point (model curve) |
| Surendra i Khanal (2015) · 9 DOI | 203 | 37 °C · mesophilic | Napier Grass growth stage 2 | end point (model curve) |
| Surendra i Khanal (2015) · 10 DOI | 217 | 37 °C · mesophilic | Napier Grass growth stage 4 | end point (model curve) |
| Surendra i Khanal (2015) · 11 DOI | 218 | 37 °C · mesophilic | Napier Grass growth stage 2 | end point (model curve) |
| Surendra i Khanal (2015) · 12 DOI | 236 | 37 °C · mesophilic | Napier Grass growth stage 2 | end point (model curve) |
| Weighted mean | 253 | arithmetic mean 227, SD 65 | ||
Typical composition
- Dry matter (DM)
- 37.8% (range 16.1–81.5)
- Volatile solids (VS)
- 87.2 % DM (range 80.2–94.9)
- Nitrogen
- 2.1 % DM
- C/N ratio
- 16.4
Median and range of the determinations reported in the publications behind this substrate's BMP records (read from: CROPGEN D4, MY-D); dry matter: 8 determinations, volatile solids: 9 determinations. C/N was calculated as the ratio of C and N content (% DM) from the same source. The DM range includes fresh samples as well as samples partly dried or dried before the test – for fresh material the lower part of the range applies, ideally your own measurement.
Sources: Tong et al. (1990); Dahunsi (2019); Gunaseelan (2004); Surendra et al. (2015).
The composition of the raw material varies between batches — for plant calculations use an analysis of your own sample. The calculator inserts typical values automatically.
Process properties
Advantages
- Methane potential in the database: weighted mean 253 m³ CH₄/t VS (median 238; range 98–372; 35 records from 6 sources).
- The best-described tropical grass (35 records): Surendra 2015 shows that yield falls with maturity (2-month-old 219 vs 8-month-old 104 m³/t VS) and that a 6 mm sieve gives higher yields than 10 and 20 mm.
Drawbacks and risks
- Late harvest drastically lowers yield (Surendra 2015).
Co-digestion — what to combine it with, what to watch out for
- combines well
group: Animal excreta (slurry, manure, poultry litter)
Co-digestion with excreta (slurry/solid manure) is the standard arrangement for plant biomass: they supply alkalinity and microflora.[1][2]
Dosing
No source-based dose limits.
Sources of the process data
- Surendra, K.; Khanal, S.K. (2015) Effects of crop maturity and size reduction on digestibility and methane yield of dedicated energy crop. Bioresource Technology 178, 187–193
- Weiland, P. (2010) Biogas production: current state and perspectives. Applied Microbiology and Biotechnology
- Tong, X.; Smith, L.H.; McCarty, P.L. (1990) Methane fermentation of selected lignocellulosic materials. Biomass 21(4), 239–255
- Chynoweth, D.; Turick, C.; Owens, J.; Jerger, D.; Peck, M. (1993) Biochemical methane potential of biomass and waste feedstocks. Biomass and Bioenergy 5(1), 95–111
- Dahunsi, S. (2019) Mechanical pretreatment of lignocelluloses for enhanced biogas production: Methane yield prediction from biomass structural components. Bioresource Technology 280, 18–26
- Gunaseelan, V. (2004) Biochemical methane potential of fruits and vegetable solid waste feedstocks. Biomass and Bioenergy 26(4), 389–399
- Hendriks, A.T.W.M.; Zeeman, G. (2009) Pretreatments to enhance the digestibility of lignocellulosic biomass. Bioresource Technology
- Kouas, M.; Torrijos, M.; Sousbie, P.; Steyer, J.P.; Sayadi, S.; Harmand, J. (2017) Robust assessment of both biochemical methane potential and degradation kinetics of solid residues in successive batches. Waste Management 70, 59–70
The co-digestion calculator will assess a specific mixture containing this substrate.
What it is and where it comes from
Elephant grass (napier grass, Pennisetum purpureum, now also Cenchrus purpureus) is a perennial tropical grass reaching several metres in height. It is grown as fodder in Africa, Asia and America, and in biogas research it is regarded as one of the highest-yielding energy crops. The dataset contains several dozen records from several studies, including an American programme from the 1990s, a study describing successive growth stages and fractions (leaf blade and leaf sheath) and silage, under conditions of 35 to 37 °C.
Properties relevant to digestion
The biomass of elephant grass is very variable depending on age: young shoots are succulent and easily digestible, and mature ones lignified and rich in lignin. An increase in fibre content reduces the rate of hydrolysis. The protein content is low, so the C/N ratio is high. The green biomass has a high moisture content and spoils quickly, so ensiling is used. It is a C4 grass with a lot of silica in the leaves, which increases the abrasiveness for equipment. Chopping is essential, and mixing with slurry improves the nitrogen balance.
How to read the spread of results
The greatest influence is the growth stage at harvest, visible in the study that compares successive stages. Further influences are the fraction (blades, sheaths, whole plant), the form of the material (fresh matter, silage), variety, fertilisation and climate. Some records come from one series, so they are not independent. Added to this are the test parameters: inoculum, substrate-to-inoculum ratio and incubation length. A single result therefore refers to a specific stage or fraction, and not to the whole category.
In biogas plant practice
In Polish conditions elephant grass is not available as a local substrate, because it does not overwinter. It is an important reference point for other energy grasses and a substrate in tropical regions, where its yields allow several cuts per year. It is harvested at the stage before full lignification, chopped and ensiled. In the ration, like other grasses, it requires mixing and nitrogen supplementation. The basis for a decision should be a BMP test with a description of the harvest stage.
Methodology in brief
BMP is the amount of methane obtained from volatile solids (VS) in a batch test, given in m³ CH₄ per tonne of VS (numerically the same as NmL CH₄/g VS in the publications) and converted to normal conditions (0 °C, 101.325 kPa). The weighted mean gives each publication a total weight of 1, split equally between its results for the substrate — a paper testing twenty varieties does not outweigh a paper with a single sample. In inter-laboratory programmes the unit is the laboratory (total weight 1), and within it the weight of a test grows with the number of bottles (replicates). Results after pretreatment (e.g. thermal, chemical, enzymatic) are shown separately and are not included in the mean.
Solid lines are curves measured in the tests. Where a publication gives only the final result, we draw a first-order kinetic model, B(t) = B₀·(1 − e−kt): only the end point comes from the publication, and the shape of the curve serves purely as visualisation — do not read the production on a particular day from it. For this substrate k = 0.085 d−1 was assumed (median of rate constants k reported in the sources and/or fitted to the mean measured curves).
The statistics describe the spread of published results — a descriptive compilation, not a meta-analysis or a guarantee of plant yield.
Results after pretreatment (4) — excluded from the mean
| Source | BMP m³ CH₄/t VS | Pretreatment | Sample |
|---|---|---|---|
| Dahunsi (2019) | 312 | physical | grass silage Pennisetum puroureum |
| Dahunsi (2019) | 320 | physical | grass silage Pennisetum puroureum |
| Dahunsi (2019) | 387 | physical | grass silage Pennisetum puroureum |
| Dahunsi (2019) | 366 | physical | grass silage Pennisetum puroureum |
Bibliography
- Tong, X.; Smith, L.H.; McCarty, P.L. (1990). Methane fermentation of selected lignocellulosic materials. Biomass 21(4), 239–255. DOI: 10.1016/0144-4565(90)90075-u DOI
- Chynoweth, D.; Turick, C.; Owens, J.; Jerger, D.; Peck, M. (1993). Biochemical methane potential of biomass and waste feedstocks. Biomass and Bioenergy 5(1), 95–111. DOI: 10.1016/0961-9534(93)90010-2 DOI
- Dahunsi, S. (2019). Mechanical pretreatment of lignocelluloses for enhanced biogas production: Methane yield prediction from biomass structural components. Bioresource Technology 280, 18–26. DOI: 10.1016/j.biortech.2019.02.006 DOI
- Gunaseelan, V. (2004). Biochemical methane potential of fruits and vegetable solid waste feedstocks. Biomass and Bioenergy 26(4), 389–399. DOI: 10.1016/j.biombioe.2003.08.006 DOI
- Kouas, M.; Torrijos, M.; Sousbie, P.; Steyer, J.P.; Sayadi, S.; Harmand, J. (2017). Robust assessment of both biochemical methane potential and degradation kinetics of solid residues in successive batches. Waste Management 70, 59–70. DOI: 10.1016/j.wasman.2017.09.001 DOI
- Surendra, K.; Khanal, S.K. (2015). Effects of crop maturity and size reduction on digestibility and methane yield of dedicated energy crop. Bioresource Technology 178, 187–193. DOI: 10.1016/j.biortech.2014.09.055 DOI
All sources of the site: bibliography.
Other substrates in the group “Energy crops and whole-crop plants (WCS)”

Energy dock — BMP: 5 studies, weighted mean 271 m³ CH₄/t VS
271 m³ CH₄/t VS weighted mean from 5 studies
≈52 %
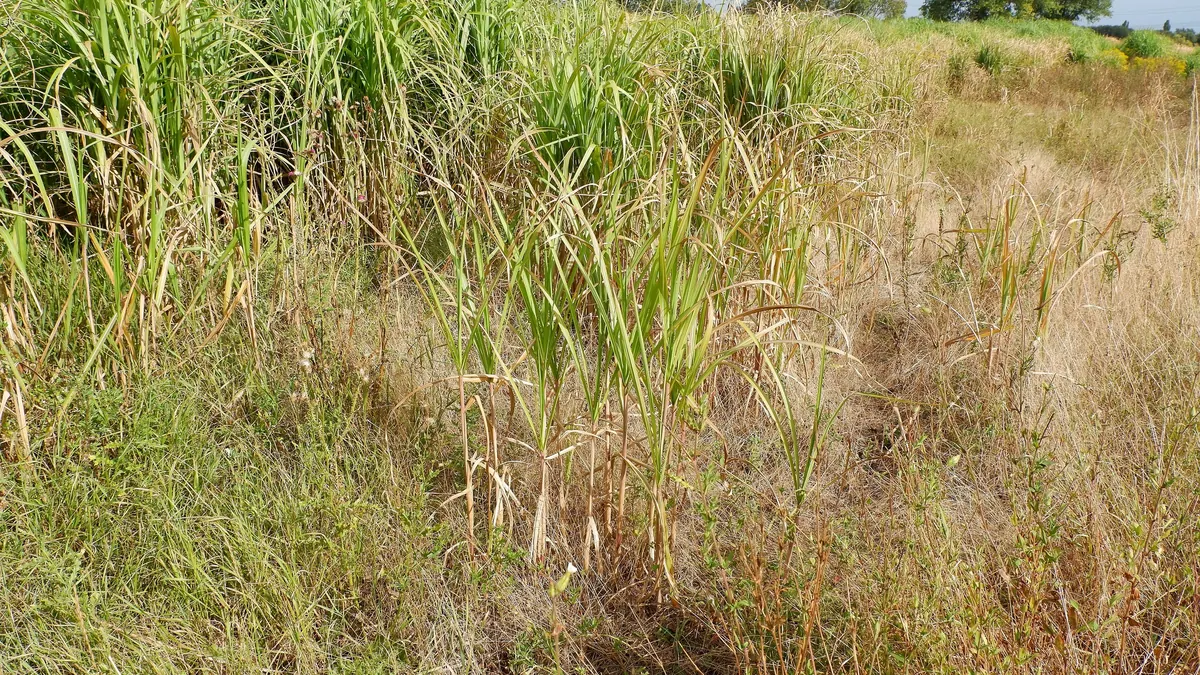
Miscanthus (silvergrass) — BMP: 8 studies, weighted mean 229 m³ CH₄/t VS
229 m³ CH₄/t VS weighted mean from 8 studies
good — editorial rating for biogas plants≈52 %
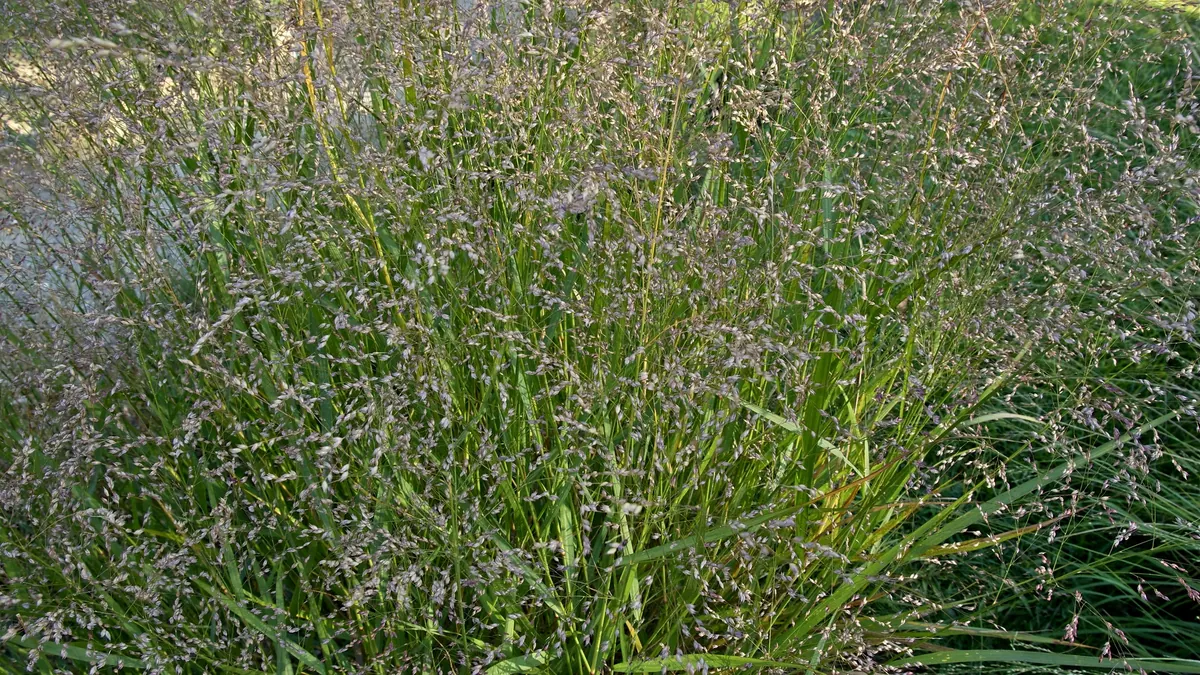
Switchgrass — BMP: 3 studies, weighted mean 180 m³ CH₄/t VS
180 m³ CH₄/t VS weighted mean from 3 studies
≈52 %
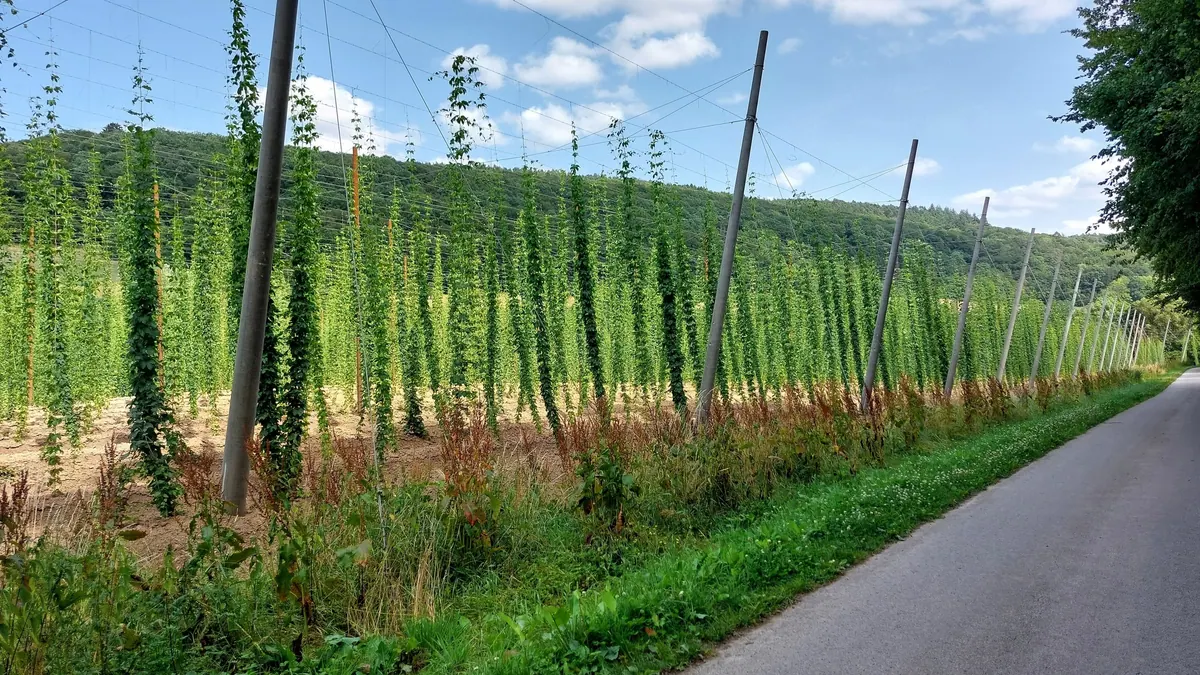
Hops, whole plant — BMP: 2 studies, weighted mean 161 m³ CH₄/t VS
161 m³ CH₄/t VS weighted mean from 2 studies
neutral — editorial rating for biogas plants≈52 %