

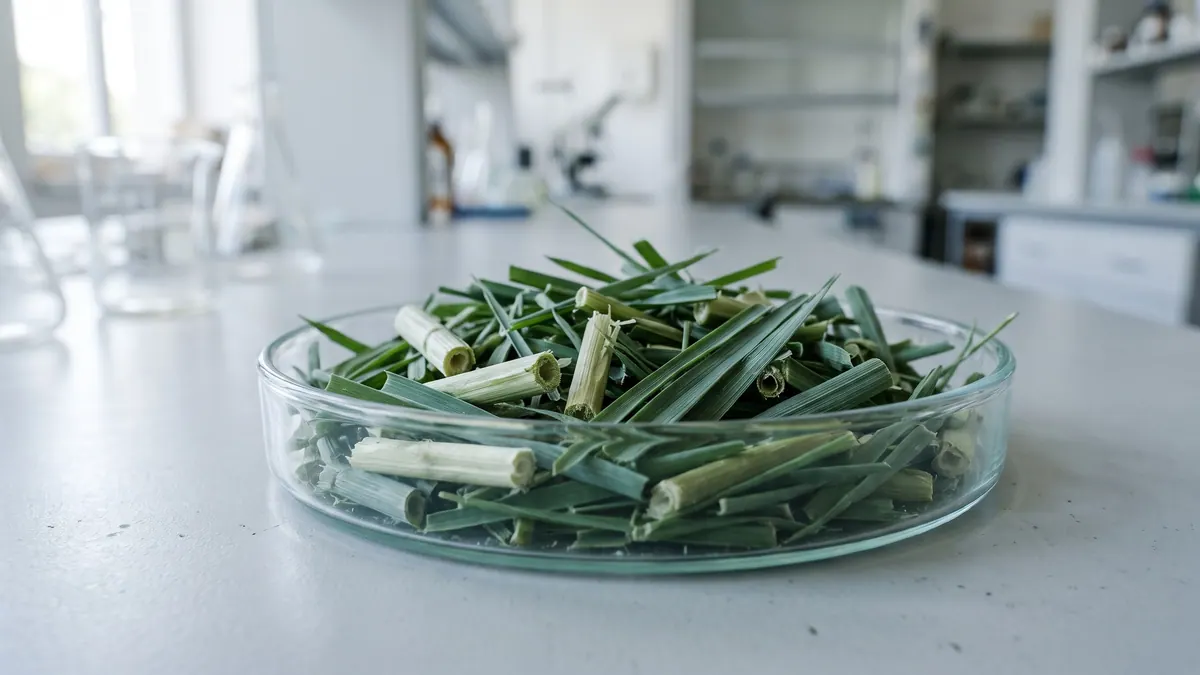
BMP testingEnergy crops and whole-crop plants (WCS)
Tall wheatgrass (Szarvasi grass) — BMP: 8 studies, weighted mean 313 m³ CH₄/t VS
Tall wheatgrass (Szarvasi-1 grass) is a perennial energy grass tolerant of drought and salinity. The compilation covers results from several studies, with several harvest dates.
rating: goodCH₄ ≈ 52 % (estimate)
Illustration: FeedstockData (AI, Google Gemini)
- Weighted mean
- 313m³ CH₄/t VS
- Range
- 268–376m³ CH₄/t VS
- Records
- 8studies
- Publications
- 2sources
- Temperatures
- 37 °C, 38 °Cof the test
Methane in biogas
Medium methane content · ≈ 5.2 kWh/m³ of biogas
estimate from the substrate type The collected studies contain no measurement. The interval follows from the approximate composition (carbohydrate-dominated (no protein or fat characteristics)) and the yields of compound groups according to FNR.
Rating for biogas plants
good — editorial rating for biogas plantsStable, usually accepted without a fee
Potential per tonne of fresh matter: high (87 m³ CH₄/t); no particular threats to stability. Handling costs: fibres, floating layer.
Why? Rating factors
Potential per tonne +2
- +2potential 87 m³ CH₄/t fresh matter (BMP 313 × DM 29.5 % × VS 93.9 %)
Process stability 0
- 0no factors
Handling and costs −0.5
- −0.5fibres, floating layer — shredding and intensive mixing
Total points: 1.5 · thresholds: ≥ 2.5 very good, ≥ 1 good, below — neutral; negative with cumulative process risk.
Add to the co-digestion calculator CSV data
BMP curves from 8 studies
Weighted mean Individual records
Dashed lines are a model curve (first-order kinetics, B(t) = B₀·(1 − e−kt)); the end point comes from the publication. All curves are model curves.
Cumulative methane production over the test [m³ CH₄/t VS]. The thick line is the weighted mean of all records (313); dots mark the end values given in the publications. Point at the chart to read values; click a legend item to hide or show a record.
Records and sources
Download CSV| Source | BMP m³ CH₄/t VS | Temperature | Sample | Curve |
|---|---|---|---|---|
| Mast et al. (2014) · 1 DOI | 311 | 37 °C · mesophilic | szarvasi industrial grass | end point (model curve) |
| Mast et al. (2014) · 2 DOI | 312 | 37 °C · mesophilic | szarvasi industrial grass | end point (model curve) |
| Mast et al. (2014) · 3 DOI | 361 | 37 °C · mesophilic | szarvasi industrial grass | end point (model curve) |
| Mast et al. (2014) · 4 DOI | 376 | 37 °C · mesophilic | szarvasi industrial grass | end point (model curve) |
| Ruf i Emmerling (2018) · 1 DOI | 268 | 38 °C · mesophilic | Tall wheatgrass · pretreatment: particle size reduction/sample preparation (MY-D: physical treatment) | end point (model curve) |
| Ruf i Emmerling (2018) · 2 DOI | 286 | 38 °C · mesophilic | Tall wheatgrass · pretreatment: particle size reduction/sample preparation (MY-D: physical treatment) | end point (model curve) |
| Ruf i Emmerling (2018) · 3 DOI | 291 | 38 °C · mesophilic | Tall wheatgrass · pretreatment: particle size reduction/sample preparation (MY-D: physical treatment) | end point (model curve) |
| Ruf i Emmerling (2018) · 4 DOI | 302 | 38 °C · mesophilic | Tall wheatgrass · pretreatment: particle size reduction/sample preparation (MY-D: physical treatment) | end point (model curve) |
| Weighted mean | 313 | arithmetic mean 313, SD 37 | ||
Typical composition
- Dry matter (DM)
- 29.5% (range 20–34.2)
- Volatile solids (VS)
- 93.9 % DM (range 92.9–94.7)
Median and range of the determinations reported in the publications behind this substrate's BMP records (read from: MY-D); dry matter: 8 determinations, volatile solids: 4 determinations.
Sources: Mast et al. (2014); Ruf et al. (2018).
The composition of the raw material varies between batches — for plant calculations use an analysis of your own sample. The calculator inserts typical values automatically.
Process properties
Advantages
- Methane potential in the database: weighted mean 313 m³ CH₄/t VS (median 306; range 268–376; 8 records from 2 sources).
Drawbacks and risks
- Yield declines with a later harvest date (Mast 2014).
- Small database (8 records from 2 sources).
Co-digestion — what to combine it with, what to watch out for
- combines well
group: Animal excreta (slurry, manure, poultry litter)
Co-digestion with excreta (slurry/solid manure) is the standard arrangement for plant biomass: they supply alkalinity and microflora.[1][2]
Dosing
No source-based dose limits.
Practical requirements
- Earlier harvest in line with Mast 2014
Sources of the process data
- Mast, B.; Lemmer, A.; Oechsner, H.; Reinhardt-Hanisch, A.; Claupein, W.; Graeff-Hönninger, S. (2014) Methane yield potential of novel perennial biogas crops influenced by harvest date. Industrial Crops and Products 58, 194–203
- Weiland, P. (2010) Biogas production: current state and perspectives. Applied Microbiology and Biotechnology
- Ruf, T.; Emmerling, C. (2018) Site-adapted production of bioenergy feedstocks on poorly drained cropland through the cultivation of perennial crops. A feasibility study on biomass yield and biochemical methane potential. Biomass and Bioenergy 119, 429–435
The co-digestion calculator will assess a specific mixture containing this substrate.
What it is and where it comes from
Tall wheatgrass (Elymus elongatus, formerly Agropyron elongatum) is a tall perennial grass. The Szarvasi-1 variety, bred in Hungary, is promoted as an energy crop for poorer, dry or saline soils. The compilation contains records from several studies in which material harvested at different dates was tested, under mesophilic conditions.
Properties relevant to digestion
Like other perennial energy grasses, tall wheatgrass is largely lignocellulosic. Harvest during the growing season gives biomass that is moister and better digestible, while a late harvest gives dry matter with a higher lignin share. Younger material can be ensiled; older material requires size reduction and good mixing. Protein is low and the C/N ratio high, which favours co-digestion with slurry or another nitrogen-rich substrate. A perennial plantation reduces establishment costs after the first years, but yields in the first seasons are sometimes lower.
How to read the spread of results
The variation among records comes mainly from the harvest date, the year, fertilisation and site, as well as from the form of the material. The studies use different test protocols, including somewhat different temperatures, inocula and substrate-to-inoculum ratios. In addition, in one measurement series several dates were tested simultaneously, so the records are not entirely independent. The spread should therefore be interpreted as the range of possible results for a grass at different stages.
In biogas plant practice
Tall wheatgrass is a niche crop, of interest where maize is not cost-effective. It is harvested with a forage harvester, ensiled and mixed with other substrates. The advantage is its perennial nature and stress tolerance, the drawback a lower energy yield than maize silage. The decision to grow it should be preceded by an analysis of yield at local sites and a BMP test of material harvested at the planned date. With perennial energy grasses it is also good to consider the effect on soil and biodiversity, because they do not require annual ploughing and their roots stabilise soil structure. These benefits are not reflected in BMP results, but may matter in choosing a crop on the farm. Finally, it is worth remembering that actual yields depend on the site, and perennial grasses need time to develop.
Methodology in brief
BMP is the amount of methane obtained from volatile solids (VS) in a batch test, given in m³ CH₄ per tonne of VS (numerically the same as NmL CH₄/g VS in the publications) and converted to normal conditions (0 °C, 101.325 kPa). The weighted mean gives each publication a total weight of 1, split equally between its results for the substrate — a paper testing twenty varieties does not outweigh a paper with a single sample. In inter-laboratory programmes the unit is the laboratory (total weight 1), and within it the weight of a test grows with the number of bottles (replicates). Results after pretreatment (e.g. thermal, chemical, enzymatic) are shown separately and are not included in the mean.
Solid lines are curves measured in the tests. Where a publication gives only the final result, we draw a first-order kinetic model, B(t) = B₀·(1 − e−kt): only the end point comes from the publication, and the shape of the curve serves purely as visualisation — do not read the production on a particular day from it. For this substrate k = 0.085 d−1 was assumed (median of rate constants k reported in the sources and/or fitted to the mean measured curves).
The statistics describe the spread of published results — a descriptive compilation, not a meta-analysis or a guarantee of plant yield.
Bibliography
- Mast, B.; Lemmer, A.; Oechsner, H.; Reinhardt-Hanisch, A.; Claupein, W.; Graeff-Hönninger, S. (2014). Methane yield potential of novel perennial biogas crops influenced by harvest date. Industrial Crops and Products 58, 194–203. DOI: 10.1016/j.indcrop.2014.04.017 DOI
- Ruf, T.; Emmerling, C. (2018). Site-adapted production of bioenergy feedstocks on poorly drained cropland through the cultivation of perennial crops. A feasibility study on biomass yield and biochemical methane potential. Biomass and Bioenergy 119, 429–435. DOI: 10.1016/j.biombioe.2018.10.007 DOI
All sources of the site: bibliography.
Other substrates in the group “Energy crops and whole-crop plants (WCS)”
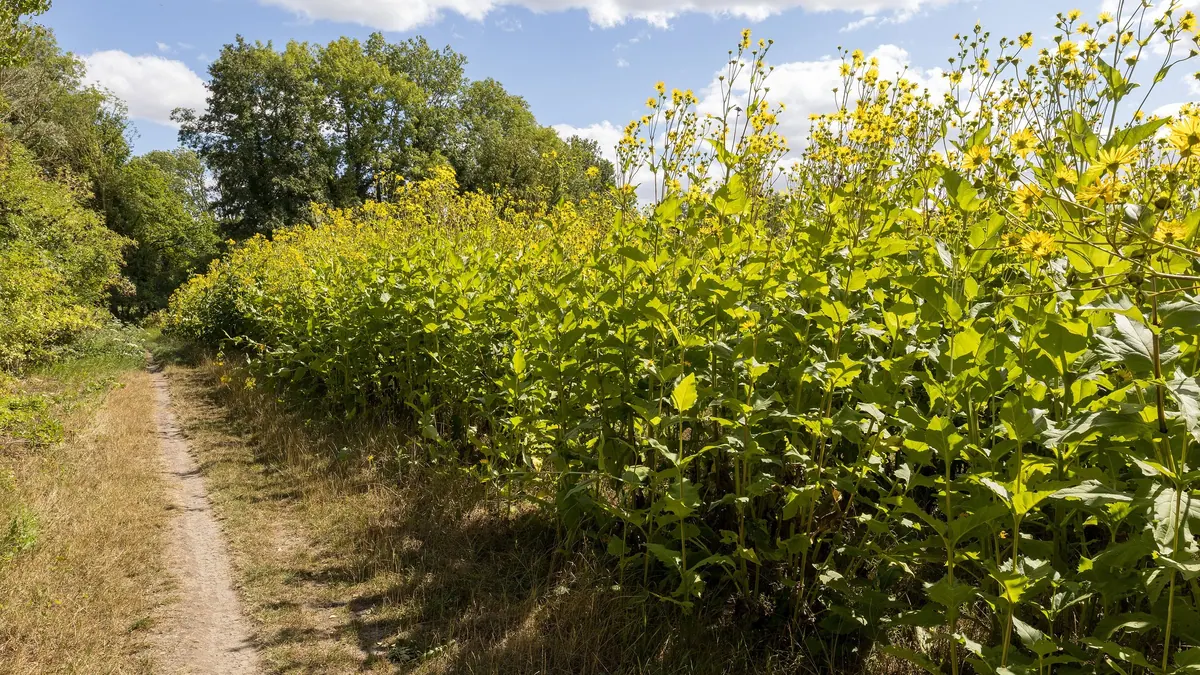
Cup plant — BMP: 8 studies, weighted mean 257 m³ CH₄/t VS
257 m³ CH₄/t VS weighted mean from 8 studies
good — editorial rating for biogas plants≈52 %
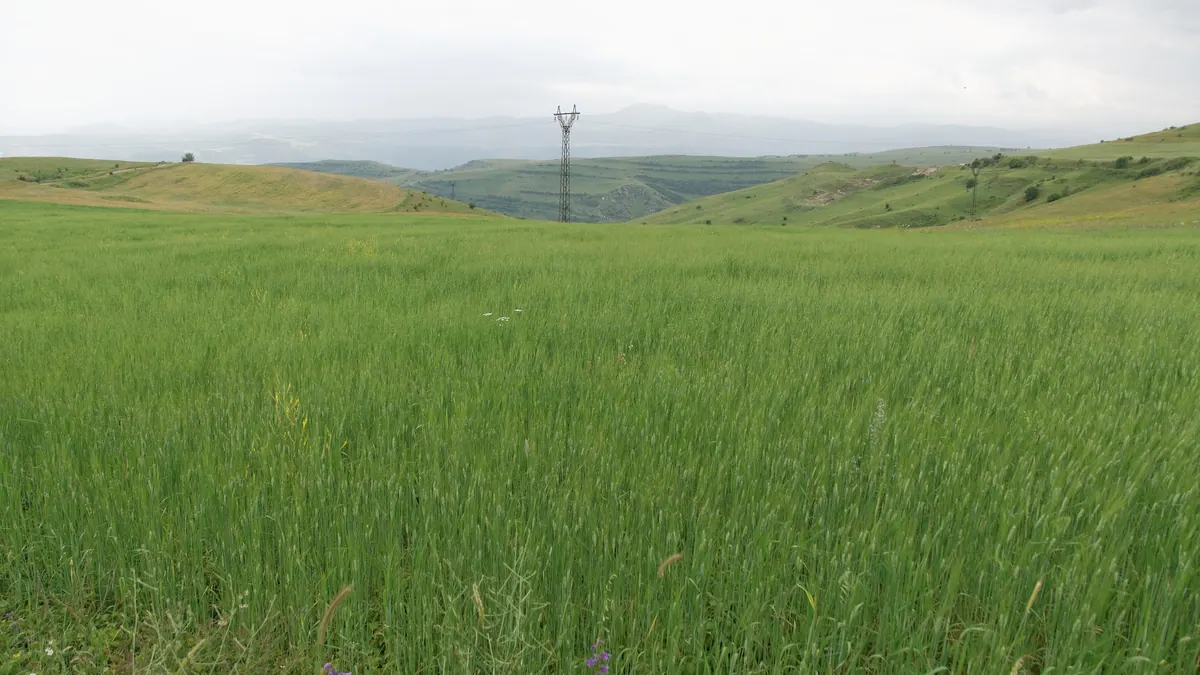
Wheat, whole crop — BMP: 13 studies, weighted mean 332 m³ CH₄/t VS
332 m³ CH₄/t VS weighted mean from 13 studies
very good — editorial rating for biogas plants59 %

Rapeseed, green biomass — BMP: 4 studies, weighted mean 367 m³ CH₄/t VS
367 m³ CH₄/t VS weighted mean from 4 studies
good — editorial rating for biogas plants66 %
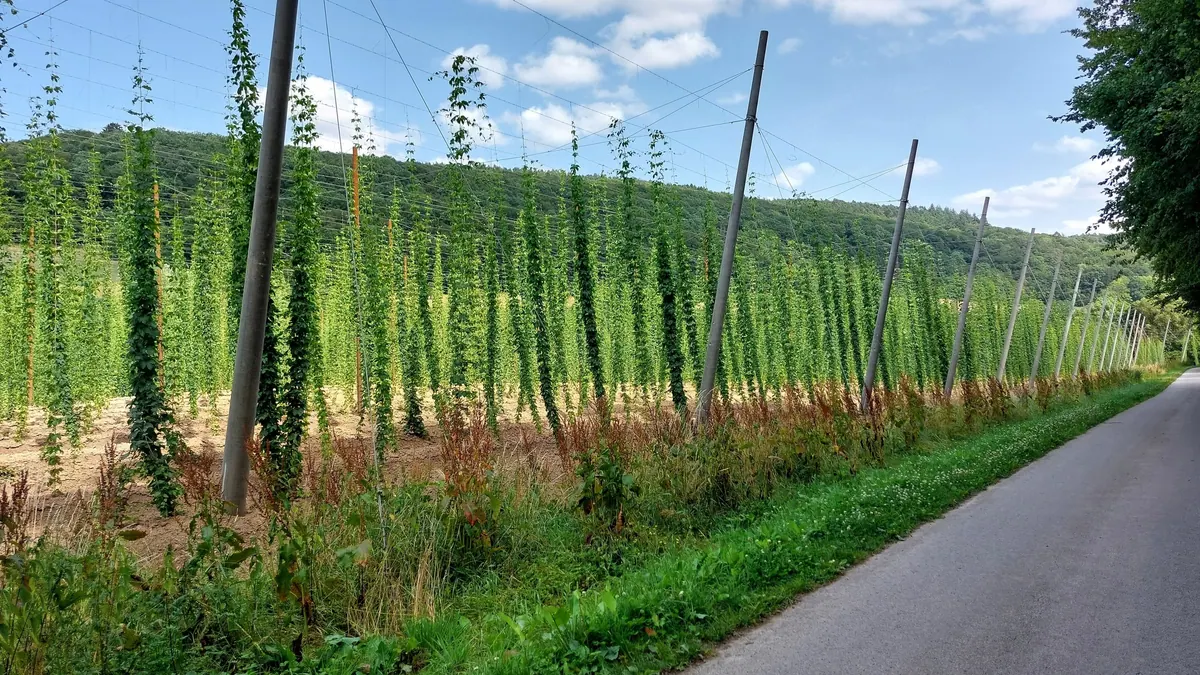
Hops, whole plant — BMP: 2 studies, weighted mean 161 m³ CH₄/t VS
161 m³ CH₄/t VS weighted mean from 2 studies
neutral — editorial rating for biogas plants≈52 %