Emissions and climateExplainer
Measuring methane emissions from biogas plants: tracer gas, drones, OGI cameras and satellites
Both point and remote methods are used to measure methane emissions from biogas plants: OGI cameras, tracer gas, plume analysers, drones and satellites. We compare their scope, accuracy and detection thresholds.
Other language versions: polski.
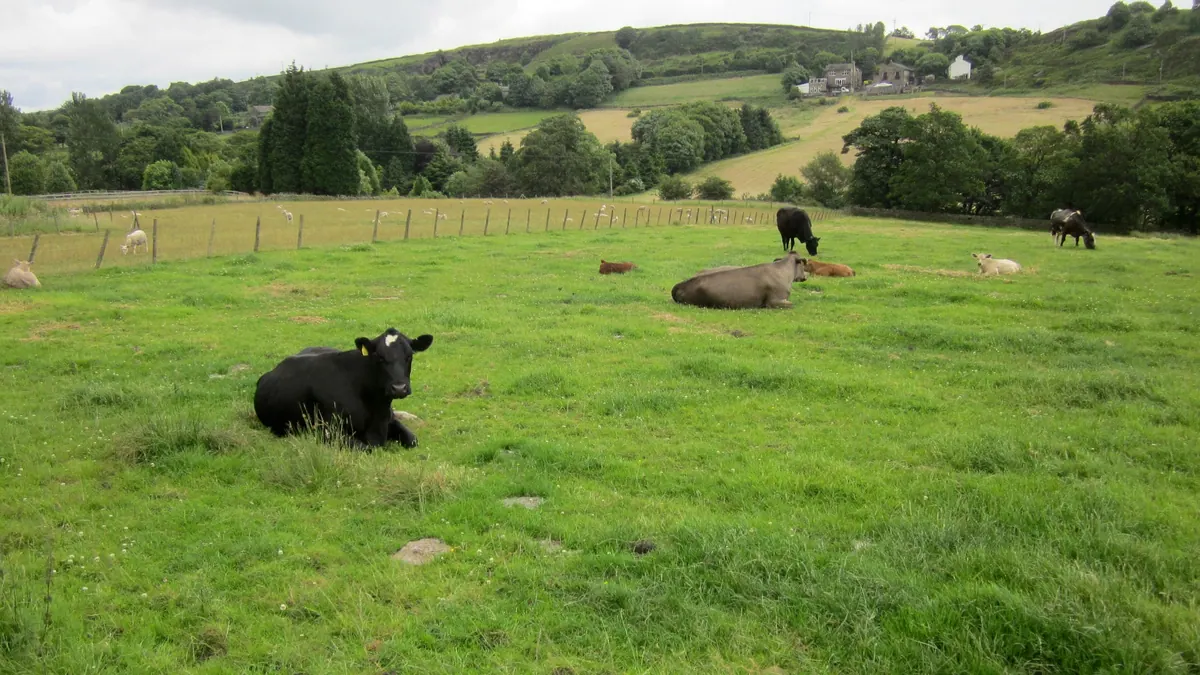

Methane emissions from biogas plants are measured with several complementary methods: an optical gas imaging (OGI) camera is used to locate leaks, the tracer gas method and plume analysis determine the total emissions of the installation, drones with laser analysers check hard-to-reach places, and satellites detect only the largest leaks. The choice of method depends on the aim: whether we want to know the total methane loss or to find specific leaks. A reliable result requires establishing the measurement boundaries, suitable weather conditions and an assessment of uncertainty.
Localisation methods (point sources)
- OGI camera – images the methane cloud in the infrared; it makes it possible to quickly inspect valves, membrane roofs and flanges. It requires a skilled operator and good conditions (wind, temperature contrast), and quantitative values are difficult to obtain.
- Portable detectors – measure concentration at the source; an Ex-rated version is required in explosion hazard zones.
- Foaming solution – a simple test of connections.
- Drones with analysers – make it possible to measure above tanks and roofs, including hard-to-reach ones.
Quantitative methods (total emissions)
- Tracer gas method – a known flow of gas (e.g. acetylene or N₂O) is released near the installation, and mobile analysers measure the concentrations of this gas and of methane in the plume downwind of the installation. The concentration ratio multiplied by the known flow gives the methane emission. The method is widely used in measurement campaigns in Europe; its uncertainty depends on conditions and the number of passes.
- Inverse dispersion modelling – open-path laser analysers or stationary ones and wind data are used to calculate the source flux with a gas dispersion model.
- Balance methods – comparing the amount of biogas produced with that used and estimating the losses; a method that is inaccurate for small losses but simple.
- Measurements in chambers and tanks – measurement chambers, analysis from the surface of open tanks.
Satellites and large scales
Satellite systems detect large leaks, usually from several dozen to several hundred kg CH₄ per hour (depending on the system and conditions). An installation producing 2.2 million m³ of methane per year with a loss of 1% loses 22 thousand m³, i.e. on average 2.75 m³/h ≈ 2 kg CH₄/h (22 thousand m³/year × 0.717 kg/m³ ≈ 15.8 t/year; 15.8 t/year ÷ 8000 h ≈ 2 kg/h). Such leaks are at least several dozen times smaller than the satellite detection threshold, so satellites are used to detect failures and large emitters, but not to monitor typical biogas plant losses.
Uncertainty and conditions
The result depends on wind direction and speed, atmospheric stability, distance, the geometry of the installation (whether all sources fall within the plume), emissions from neighbouring facilities (e.g. a cowshed, a landfill), the time of measurement (emissions change during the day, e.g. after unloading) and the operation of the plant. Reports should state the method, time, conditions, uncertainty and the sources included.
Example of a calculation by the tracer gas method
Assumptions: acetylene was released as a tracer gas at 0.5 kg/h, i.e. 500 g/h ÷ 26 g/mol ≈ 19.2 mol/h. After integrating the passes through the plume, the molar ratio of excess CH₄ to excess tracer gas is 2.5. Methane flux: 2.5 × 19.2 ≈ 48 mol/h, i.e. 48 × 16 g/mol ≈ 0.77 kg CH₄/h. Over 8000 h this is about 6.2 t per year, which corresponds to about 0.4% of methane production in an installation producing 2.2 million m³ CH₄ per year (about 1580 t). The data are illustrative; in practice the background, multiple passes and uncertainty must be taken into account.
How to plan a campaign
- Define the aim (total emissions or localisation).
- Choose a method and a contractor with experience in biogas.
- Set the period (several days in different conditions and operating phases).
- Prepare the installation's data (production, feeding and offtake schedule).
- After the measurement, carry out localisation with an OGI camera and repair the leaks.
- Repeat the measurement after repairs in order to assess the effect.
Interpreting the results
It is worth relating the result of the total emissions measurement to methane production during the measurement, in order to obtain a percentage loss indicator. A single measurement can be unrepresentative, because emissions vary during the day and the season (e.g. higher in summer from digestate, higher after failure events). For this reason several campaigns per year are recommended, or combining measurements with continuous leak-tightness monitoring. When comparing results with other installations, check whether the same method and definition of installation boundaries were used.
Summary
Methane emission measurements are becoming increasingly important from a regulatory and certification perspective. It is best to combine quantitative and localisation methods, and to treat the results as a starting point for remedial action.
Sources
Related articles