Biogas plant monitoring and automation: SCADA, sensors, alarms and data for optimisation
Which measurements are essential at a biogas plant, how to build a SCADA system, which alarms to set and how to use the data for optimisation and process diagnostics.
Other language versions: polski.
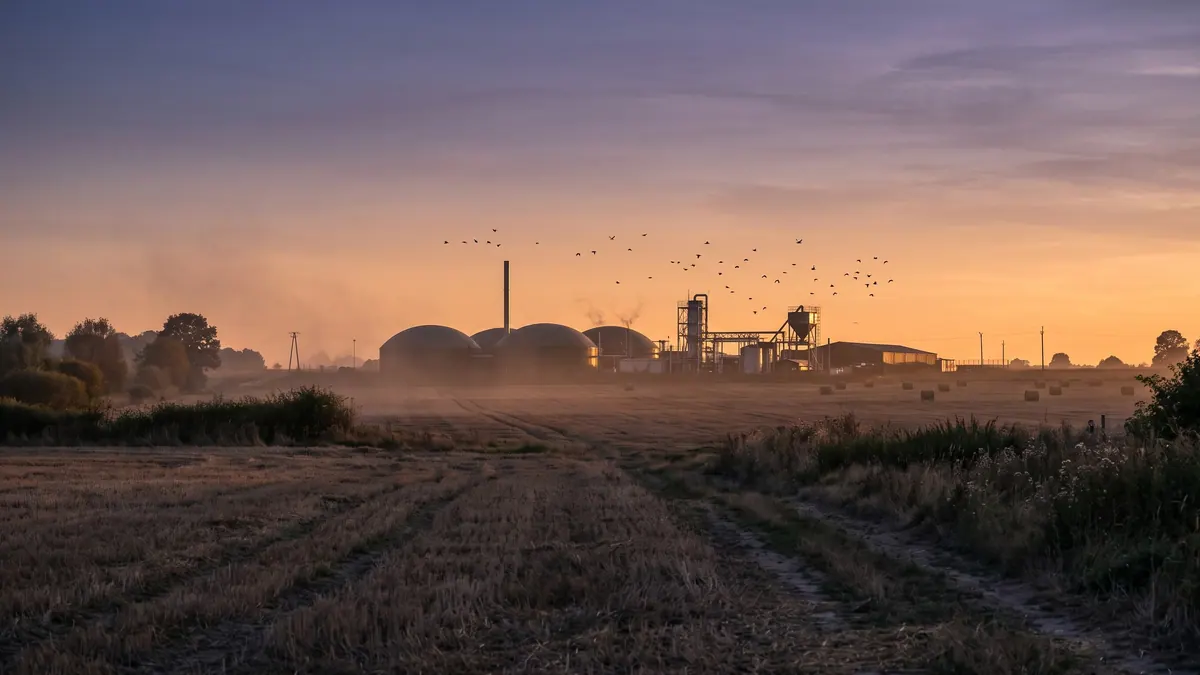
A biogas plant monitoring and automation system consists of sensors, PLC controllers, an operator panel or SCADA and a data archive. Continuous measurement is essential for temperature and levels in the tanks, substrate and biogas flows, gas composition (CH₄, CO₂, O₂, H₂S), pressure in the gas system, and electricity and heat, supplemented by regular laboratory analyses. A good system not only raises alarms but also builds the history needed for process optimisation.
Layers of the system
- Sensors and actuators — temperature, pressure and level transmitters, flow meters, gas analysers, valves, motors.
- PLC controllers — control logic (agitators, pumps, feeders, heating), interlocks and safeguards.
- SCADA/HMI — visualisation, trends, alarms, event log.
- Data archive — a time-series database with charts and export.
- Communication — industrial protocols, remote access.
Key measurements
| Area | Parameter | Why |
|---|---|---|
| Digesters | temperature (several points), level, gas pressure | process stability, safety |
| Substrates | mass or volume dosed, dosing time | OLR and HRT balance |
| Gas | flow, CH₄, CO₂, O₂, H₂S, temperature, pressure | yield, quality, engine protection |
| Gas tank | membrane fill level | control of CHP and flare |
| CHP | electrical power, heat, operating hours, temperatures | efficiency, servicing |
| Flare | status, operating time | safety, emissions documentation |
| Power supply | own energy consumption | net balance |
| Laboratory | pH, FOS/TAC, VFA, NH₄-N, TS/VS | process diagnosis |
Alarms — design
Distinguish three levels:
- critical (safety): gas detection (CH₄, H₂S), over- or under-pressure, high digestate level, fire, failure of engine room ventilation — they require an immediate response and often automatic shutdowns;
- process: temperature exceeded, a fall in CH₄, high H₂S, a rise in FOS/TAC — they require a response within hours;
- informational: an approaching service date, deviations from the plan.
Principles: every alarm has a clear description, an assigned recipient and a procedure; avoid an "alarm flood", set hysteresis and delays; periodically test the notification chain (SMS, e-mail, phone).
Using data for optimisation
Indicators can be calculated from the archive: biogas yield per tonne of substrate, own energy consumption, CHP efficiency, availability, heat balance. Example: comparing CH₄ production (m³/d) with the VS feed (kg/d) gives the yield per VS; a fall of 5–10% at a constant feed signals a problem in the process or a measurement error. Correlating changes in pH, FOS/TAC and gas composition with feeds helps to develop control rules.
Measurement quality
- Gas analysers require calibration with a reference gas in accordance with the manual; the reading can drift.
- Biogas flow meters require pressure and temperature compensation; an error here distorts all the balances.
- Level sensors in foam or a scum layer may read incorrectly.
- Feeder scales require periodic verification or checking.
- It is worth verifying critical data with a second, independent measurement.
Cybersecurity and continuity
Remote access requires a VPN, multi-factor authentication and separation of the control network from the office network. Make backups of the PLC and SCADA configuration, establish an emergency procedure for loss of communication (local operation, switching to a safe mode), and update the software in line with the manufacturer's recommendations.
Implementation checklist
- Define the objectives (safety, balances, optimisation).
- Make a list of signals and their measurement points.
- Set alarm thresholds with the operators and the service provider.
- Plan calibrations and sensor inspections.
- Provide crew training and documentation.
- Review the reports and alarms once a month.
Well-designed monitoring makes it possible to detect a problem earlier than the symptoms in the gas, which can be the difference between a correction of the feed and a crisis lasting several weeks.
Example of a control rule
A typical rule linked to the gas tank: when the membrane fill level exceeds 85%, the controller increases CHP output (if possible) or opens the route to the flare once the safety threshold is exceeded; below 20% it limits engine output to avoid running on suction. The thresholds are chosen to suit the tank design and the operator's experience, and every change requires a test. Similar rules apply to feeding: automatic suspension of substrate feeding when the temperature in the digester falls below a set value or when the agitator is not running.
Logs and reports
The system should generate a daily and a monthly report: gas and energy production, CHP operating hours, failures, alarms, own consumption, substrate feeds. Reports make discussions with the service provider, the bank, the energy buyer and the supervisory authorities easier. Also record manual interventions (changes of settings, bypassing of interlocks) — this makes it possible to reconstruct the course of events after a failure.
Maintenance of the measurement system
Plan a schedule: calibration of gas analysers in line with the manual (often every few months to a year, with a check against a reference gas), replacement of electrochemical sensors after the recommended service life, cleaning of level and temperature probes, testing of explosive and toxic gas sensors with test gas. Keep a calibration register — it is also important during inspections and in the event of an accident. Treat the sensors of safety systems as a priority: their malfunction is an unacceptable situation.
Integration with the laboratory
The results of FOS/TAC, VFA, TAN and TS/VS analyses are best entered into the same database as the online data. This makes it possible to draw joint charts, e.g. the VS feed, FOS/TAC and CH₄ share, and to pick up relationships. Even a simple spreadsheet with a daily entry is better than scattered notes.
Sources
Related articles