

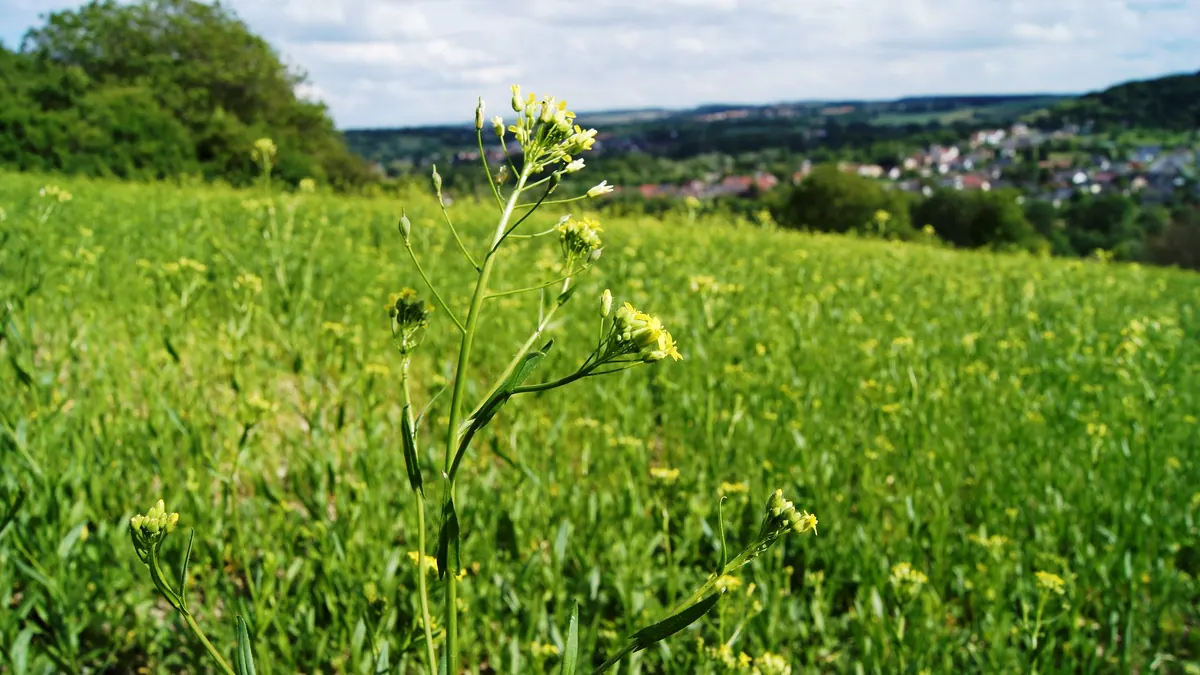
BMP testingGrasses, green forage and fodder plantssingle study (5 samples)
Cereal/pea and camelina mixtures — BMP: 5 studies, weighted mean 282 m³ CH₄/t VS
Mixtures of cereals and peas with camelina are green forage or silage from extensive crops, studied as an alternative to maize. The dataset is based on a single study with several variants.
rating: goodCH₄ ≈ 52 % (estimate)
Photo Bliesgauoele / Wikimedia Commons, licence CC BY-SA 4.0, source file; changes: cropping

- Weighted mean
- 282m³ CH₄/t VS
- Range
- 252–318m³ CH₄/t VS
- Records
- 5single study (5 samples)
- Publications
- 1source
- Temperatures
- 37 °Cof the test
Methane in biogas
Medium methane content · ≈ 5.2 kWh/m³ of biogas
estimate from the substrate type The collected studies contain no measurement. The interval follows from the approximate composition (carbohydrate-dominated (no protein or fat characteristics)) and the yields of compound groups according to FNR.
Rating for biogas plants
good — editorial rating for biogas plantsStable, usually accepted without a fee
Potential per tonne of fresh matter: high (90 m³ CH₄/t); no particular threats to stability. No additional handling requirements.
Why? Rating factors
Potential per tonne +2
- +2potential 90 m³ CH₄/t fresh matter (BMP 282 × DM 34.5 % × VS 92.2 %)
Process stability 0
- 0no factors
Handling and costs 0
- 0no factors
Total points: 2 · thresholds: ≥ 2.5 very good, ≥ 1 good, below — neutral; negative with cumulative process risk.
Add to the co-digestion calculator CSV data
BMP curves from 5 studies
Weighted mean Individual records
Dashed lines are a model curve (first-order kinetics, B(t) = B₀·(1 − e−kt)); the end point comes from the publication. All curves are model curves.
Cumulative methane production over the test [m³ CH₄/t VS]. The thick line is the weighted mean of all records (282); dots mark the end values given in the publications. Point at the chart to read values; click a legend item to hide or show a record.
Records and sources
Download CSV| Source | BMP m³ CH₄/t VS | Temperature | Sample | Curve |
|---|---|---|---|---|
| Kaiser (2007) · 1 | 252 | 37 °C · mesophilic | Mix fibers (Wheat; Camelina) silage | end point (model curve) |
| Kaiser (2007) · 2 | 270 | 37 °C · mesophilic | Mix fibers (Pea; Camelina) silage | end point (model curve) |
| Kaiser (2007) · 3 | 279 | 37 °C · mesophilic | Mix fibers (Wheat; Camelina) fresh | end point (model curve) |
| Kaiser (2007) · 4 | 293 | 37 °C · mesophilic | Mix fibers (Wheat; Pea; Camelina) silage | end point (model curve) |
| Kaiser (2007) · 5 | 318 | 37 °C · mesophilic | Mix fibers (Barley; Camelina) silage | end point (model curve) |
| Weighted mean | 282 | arithmetic mean 282, SD 25 | ||
Typical composition
- Dry matter (DM)
- 34.5% (range 30.3–36.8)
- Volatile solids (VS)
- 92.2 % DM (range 87.2–94.9)
Median and range of the determinations reported in the publications behind this substrate's BMP records (read from: MY-D); dry matter: 5 determinations, volatile solids: 5 determinations.
Sources: Kaiser (2007).
The composition of the raw material varies between batches — for plant calculations use an analysis of your own sample. The calculator inserts typical values automatically.
Process properties
Low confidence: the description is based on general characteristics of the substrate group, not on studies of this material. Treat it as a hint to be verified.
Advantages
- Methane potential in the database: weighted mean 282 m³ CH₄/t VS (median 279; range 252–318; 5 records from 1 sources).
- Green forage and silage of cereal and pea mixtures with flax-leaved grass described in Kaiser 2007 (effect of composition on digestibility).
Drawbacks and risks
- Spread of results in the database: standard deviation 25 at a mean of 282 m³ CH₄/t VS (5 records from 1 sources).
Co-digestion — what to combine it with, what to watch out for
- combines well
group: Animal excreta (slurry, manure, poultry litter)
Co-digestion with excreta (slurry/solid manure) is the standard arrangement for plant biomass: they supply alkalinity and microflora.[1][2]
Dosing
Introduce gradually, starting with a small dose and monitoring the process (e.g. FOS/TAC, pH, gas composition).
Practical requirements
- Ensiling makes it possible to store seasonal biomass; properly ensiled plants (in the study maize, sorghum, forage rye, triticale) can be stored for up to a year without loss of methane production (Herrmann et al. 2011).
Sources of the process data
- Kaiser, F.L. (2007) Einfluss der stofflichen Zusammensetzung auf die Verdaulichkeit nachwachsender Rohstoffe beim anaeroben Abbau in Biogasreaktoren. Dissertation, Technische Universität München, Wissenschaftszentrum Weihenstephan
- Weiland, P. (2010) Biogas production: current state and perspectives. Applied Microbiology and Biotechnology
- Herrmann et al. (2011). Effects of ensiling, silage additives and storage period on methane formation of biogas crops. Bioresour. Technol.
The co-digestion calculator will assess a specific mixture containing this substrate.
What it is and where it comes from
Camelina (Camelina sativa) is an oilseed plant of the cabbage family, with modest soil requirements and a short growing season. Grown in mixtures with cereals or peas, it is the subject of research as an extensive energy crop that could compete with maize where maize cultivation is limited. The dataset includes several records from a single publication: wheat with camelina (silage and fresh matter), peas with camelina, wheat with peas and camelina, and barley with camelina, all under mesophilic conditions.
Properties relevant to digestion
The composition depends on the proportions of the species. Cereals supply carbohydrates and fibre, peas supply protein, and camelina contributes a small amount of lipids and, as a brassica, sulphur compounds. Green forage is wet and spoils quickly, so ensiling is the basic method of storage. Mixtures are sometimes easier to ensile than pure legumes if the share of cereals provides a sufficient amount of sugars. Sulphur from camelina can increase the hydrogen sulphide content of the biogas, but at typical shares of the plants in the mix the effect is usually small.
How to read the spread of results
The several records represent different combinations of species and two forms of material: fresh matter and silage, so the differences between them are not measurement noise. In real crops the result depends on the proportions of the components in the crop, the harvest date, the development stage of the cereals, moisture and the method of ensiling. Because all the records come from a single publication, they do not capture variability between laboratories and years. Differences in comminution, inoculum and substrate-to-inoculum ratio are added to this.
In biogas plant practice
Mixtures with camelina are a niche supplement to the feedstock base, of interest where soil conditions or regulations restrict maize. They are harvested as green forage or silage, shredded and ensiled like other fodder plants. The dose in the mix should take into account possible changes in sulphur and protein content, and their effect is monitored by measuring H₂S and ammonia. Yield and composition are variable, so before wider use it is worth running a BMP test on your own mixture. In addition, it is worth checking whether growing mixtures with camelina is agronomically justified on a given farm, because the green mass yield is sometimes lower than that of maize, and the choice of plant should also take crop rotation and soil protection into account.
Methodology in brief
BMP is the amount of methane obtained from volatile solids (VS) in a batch test, given in m³ CH₄ per tonne of VS (numerically the same as NmL CH₄/g VS in the publications) and converted to normal conditions (0 °C, 101.325 kPa). The weighted mean gives each publication a total weight of 1, split equally between its results for the substrate — a paper testing twenty varieties does not outweigh a paper with a single sample. In inter-laboratory programmes the unit is the laboratory (total weight 1), and within it the weight of a test grows with the number of bottles (replicates). Results after pretreatment (e.g. thermal, chemical, enzymatic) are shown separately and are not included in the mean.
Solid lines are curves measured in the tests. Where a publication gives only the final result, we draw a first-order kinetic model, B(t) = B₀·(1 − e−kt): only the end point comes from the publication, and the shape of the curve serves purely as visualisation — do not read the production on a particular day from it. For this substrate k = 0.091 d−1 was assumed (no kinetic data for the group – the median of all available rate constants k (93 values) was used).
The statistics describe the spread of published results — a descriptive compilation, not a meta-analysis or a guarantee of plant yield.
Bibliography
- Kaiser, F.L. (2007). Einfluss der stofflichen Zusammensetzung auf die Verdaulichkeit nachwachsender Rohstoffe beim anaeroben Abbau in Biogasreaktoren. Dissertation, Technische Universität München, Wissenschaftszentrum Weihenstephan. https://mediatum.ub.tum.de/631394 source
All sources of the site: bibliography.
Other substrates in the group “Grasses, green forage and fodder plants”
Meadow hay — BMP: 16 studies, weighted mean 279 m³ CH₄/t VS
279 m³ CH₄/t VS weighted mean from 16 studies
very good — editorial rating for biogas plants53 %
Lucerne (alfalfa) — BMP: 7 studies, weighted mean 366 m³ CH₄/t VS
366 m³ CH₄/t VS weighted mean from 7 studies
neutral — editorial rating for biogas plants66 %
Millet/foxtail millet and clover mixtures — BMP: 5 studies, weighted mean 304 m³ CH₄/t VS
304 m³ CH₄/t VS weighted mean from 5 studies
good — editorial rating for biogas plants≈53 %
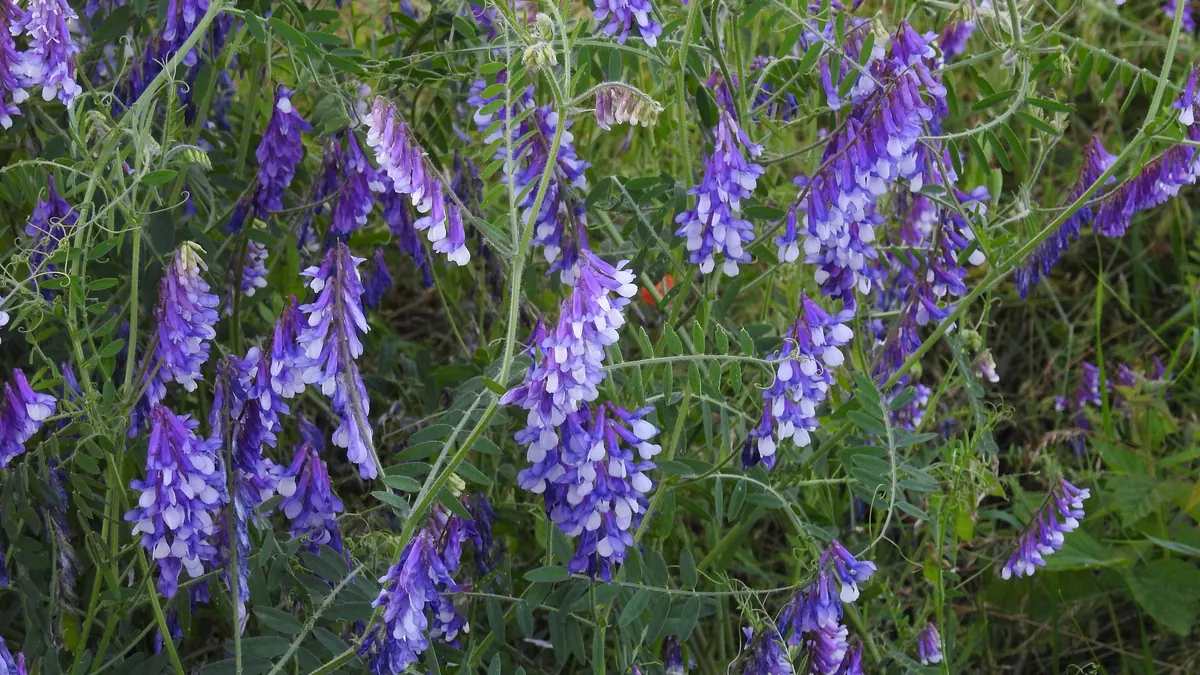
Rye and vetch mixture — BMP: 2 studies, weighted mean 270 m³ CH₄/t VS
270 m³ CH₄/t VS weighted mean from 2 studies
good — editorial rating for biogas plants≈52 %