

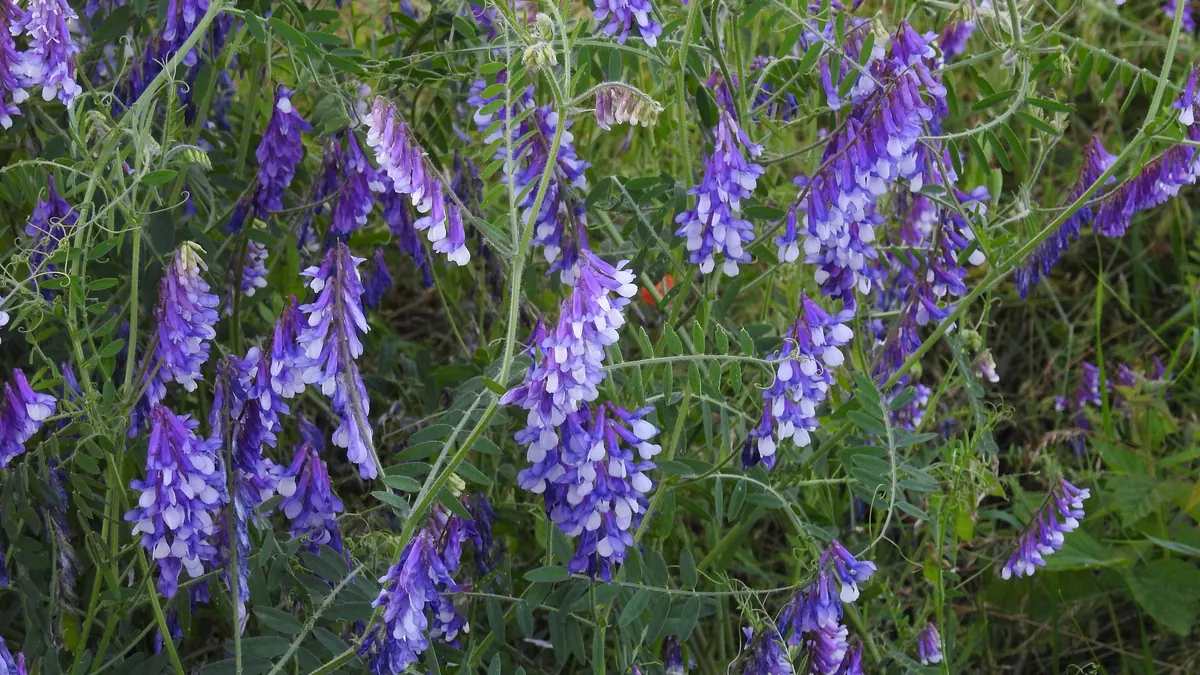
BMP testingGrasses, green forage and fodder plantssingle study (2 samples)
Rye and vetch mixture — BMP: 2 studies, weighted mean 270 m³ CH₄/t VS
A rye and vetch mixture is a winter catch crop harvested in spring as green forage or silage. In the dataset it is described by a small number of records from a single publication, so the data are indicative.
rating: goodCH₄ ≈ 52 % (estimate)
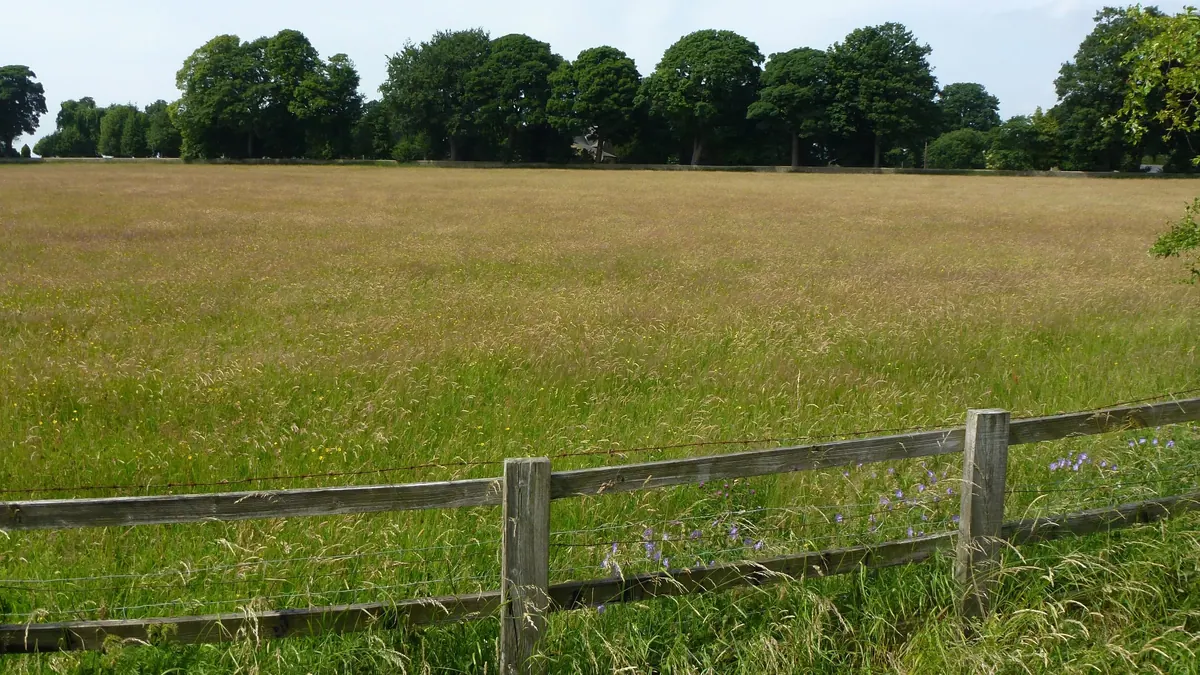
Photo Robert Flogaus-Faust / Wikimedia Commons, licence CC BY 4.0, source file; changes: cropping

- Weighted mean
- 270m³ CH₄/t VS
- Range
- 255–285m³ CH₄/t VS
- Records
- 2single study (2 samples)
- Publications
- 1source
- Temperatures
- 38 °Cof the test
Methane in biogas
Medium methane content · ≈ 5.2 kWh/m³ of biogas
estimate from the substrate type The collected studies contain no measurement. The interval follows from the approximate composition (protein from total nitrogen (N 0.9 % DM × 6.25)) and the yields of compound groups according to FNR.
Rating for biogas plants
good — editorial rating for biogas plantsStable, usually accepted without a fee
Potential per tonne of fresh matter: high (98 m³ CH₄/t); no particular threats to stability. No additional handling requirements.
Why? Rating factors
Potential per tonne +2
- +2potential 98 m³ CH₄/t fresh matter (BMP 270 × DM 38.9 % × VS 93.5 %)
Process stability 0
- 0no factors
Handling and costs 0
- 0no factors
Total points: 2 · thresholds: ≥ 2.5 very good, ≥ 1 good, below — neutral; negative with cumulative process risk.
Add to the co-digestion calculator CSV data
BMP curves from 2 studies
Weighted mean Individual records
Dashed lines are a model curve (first-order kinetics, B(t) = B₀·(1 − e−kt)); the end point comes from the publication. All curves are model curves.
Cumulative methane production over the test [m³ CH₄/t VS]. The thick line is the weighted mean of all records (270); dots mark the end values given in the publications. Point at the chart to read values; click a legend item to hide or show a record.
Records and sources
Download CSV| Source | BMP m³ CH₄/t VS | Temperature | Sample | Curve |
|---|---|---|---|---|
| Lallement et al. (2023) · 1 DOI | 255 | 38 °C · mesophilic | rye and vetch | end point (model curve) |
| Lallement et al. (2023) · 2 DOI | 285 | 38 °C · mesophilic | rye and vetch | end point (model curve) |
| Weighted mean | 270 | arithmetic mean 270, SD 21 | ||
Typical composition
- Dry matter (DM)
- 38.9% (range 28.3–49.4)
- Volatile solids (VS)
- 93.5 % DM (range 93–94)
- Nitrogen
- 0.9 % DM
- C/N ratio
- 49.8
Median and range of the determinations reported in the publications behind this substrate's BMP records (read from: MY-D); dry matter: 2 determinations, volatile solids: 2 determinations. C/N was calculated as the ratio of C and N content (% DM) from the same source.
Sources: Lallement et al. (2023).
The composition of the raw material varies between batches — for plant calculations use an analysis of your own sample. The calculator inserts typical values automatically.
Process properties
Low confidence: the description is based on general characteristics of the substrate group, not on studies of this material. Treat it as a hint to be verified.
Advantages
- Methane potential in the database: weighted mean 270 m³ CH₄/t VS (median 270; range 255–285; 2 records from 1 sources).
Drawbacks and risks
- Spread of results in the database: standard deviation 21 at a mean of 270 m³ CH₄/t VS (2 records from 1 sources).
Co-digestion — what to combine it with, what to watch out for
- combines well
group: Animal excreta (slurry, manure, poultry litter)
Co-digestion with excreta (slurry/solid manure) is the standard arrangement for plant biomass: they supply alkalinity and microflora.[1][2]
Dosing
Introduce gradually, starting with a small dose and monitoring the process (e.g. FOS/TAC, pH, gas composition).
Practical requirements
- Ensiling makes it possible to store seasonal biomass; properly ensiled plants (in the study maize, sorghum, forage rye, triticale) can be stored for up to a year without loss of methane production (Herrmann et al. 2011).
Sources of the process data
- Lallement, A.; Peyrelasse, C.; Lagnet, C.; Barakat, A.; Schraauwers, B.; Maunas, S.; Monlau, F. (2023) A Detailed Database of the Chemical Properties and Methane Potential of Biomasses Covering a Large Range of Common Agricultural Biogas Plant Feedstocks. Waste 1(1), 195–227
- Weiland, P. (2010) Biogas production: current state and perspectives. Applied Microbiology and Biotechnology
- Herrmann et al. (2011). Effects of ensiling, silage additives and storage period on methane formation of biogas crops. Bioresour. Technol.
The co-digestion calculator will assess a specific mixture containing this substrate.
What it is and where it comes from
The rye and vetch mixture is a winter catch crop: it is sown in autumn after the main crop is harvested and harvested in spring before sowing the next crop, for example maize. Such a system, referred to in the literature by the abbreviation CIVE (from the French cultures intermédiaires à vocation énergétique), makes it possible to obtain additional biomass without occupying the field during the growing season of the main crop, while also protecting the soil against erosion and nitrogen leaching. The dataset is based on a small number of records from a single publication, carried out under mesophilic conditions.
Properties relevant to digestion
Rye supplies fibre and carbohydrates, vetch supplies protein, and their mutual proportions determine the C to N ratio. Digestibility depends on the harvest date: rye harvested at an early heading stage is much more digestible than at the mature stage, when woody tissues dominate. Spring harvest carries the risk of cool, wet weather, and the yield is sometimes low compared with the main crop. The material is suitable for ensiling, but the protein content increases buffering capacity, so wilting is recommended. At a large share there is a risk of ammonia release.
How to read the spread of results
Both values come from a single study and describe the same type of mixture, so they do not capture the full variability. In real conditions the composition and the result depend on the ratio of rye to vetch, the harvest date, moisture, the form of the material and the weather during the season. Test parameters are added to this: inoculum, S/I ratio and time. The spread of catch crop results between years is usually larger than for main crops, because it depends on the course of winter and spring.
In biogas plant practice
A rye and vetch catch crop is attractive for farms that want to increase biomass production without enlarging the area of energy crops. However, the harvest dates must be planned so as not to delay the sowing of the following crop, and the crop must be ensiled in a way that allows long storage. In the feed the mixture can replace part of the maize silage, provided that ammonia is monitored. A dedicated BMP test is recommended, because the data come from a single publication. The use of such a catch crop is also consistent with the idea of limiting erosion and nitrogen losses in winter, which may be an additional agronomic argument, independent of the biogas balance, and influence the decision to grow it on the farm.
Methodology in brief
BMP is the amount of methane obtained from volatile solids (VS) in a batch test, given in m³ CH₄ per tonne of VS (numerically the same as NmL CH₄/g VS in the publications) and converted to normal conditions (0 °C, 101.325 kPa). The weighted mean gives each publication a total weight of 1, split equally between its results for the substrate — a paper testing twenty varieties does not outweigh a paper with a single sample. In inter-laboratory programmes the unit is the laboratory (total weight 1), and within it the weight of a test grows with the number of bottles (replicates). Results after pretreatment (e.g. thermal, chemical, enzymatic) are shown separately and are not included in the mean.
Solid lines are curves measured in the tests. Where a publication gives only the final result, we draw a first-order kinetic model, B(t) = B₀·(1 − e−kt): only the end point comes from the publication, and the shape of the curve serves purely as visualisation — do not read the production on a particular day from it. For this substrate k = 0.091 d−1 was assumed (no kinetic data for the group – the median of all available rate constants k (93 values) was used).
The statistics describe the spread of published results — a descriptive compilation, not a meta-analysis or a guarantee of plant yield.
Bibliography
- Lallement, A.; Peyrelasse, C.; Lagnet, C.; Barakat, A.; Schraauwers, B.; Maunas, S.; Monlau, F. (2023). A Detailed Database of the Chemical Properties and Methane Potential of Biomasses Covering a Large Range of Common Agricultural Biogas Plant Feedstocks. Waste 1(1), 195–227. DOI: 10.3390/waste1010014 DOI
All sources of the site: bibliography.
Other substrates in the group “Grasses, green forage and fodder plants”
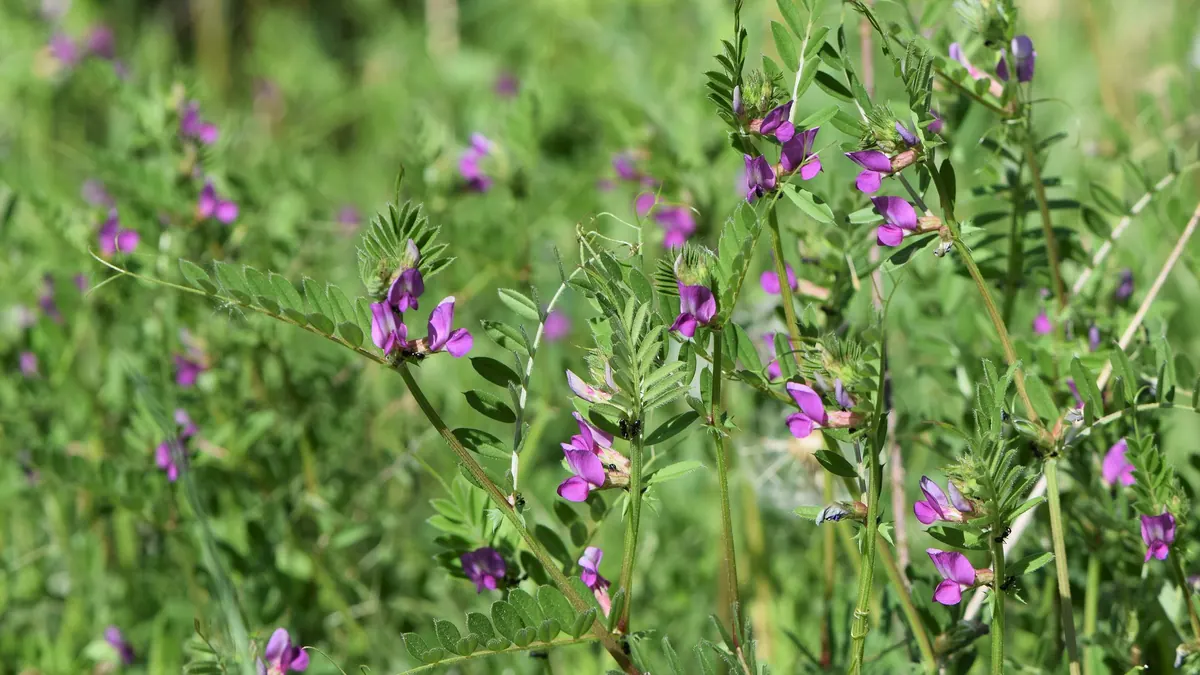
Vetch-oat mixture — BMP: 2 studies, weighted mean 405 m³ CH₄/t VS
405 m³ CH₄/t VS weighted mean from 2 studies
≈52 %
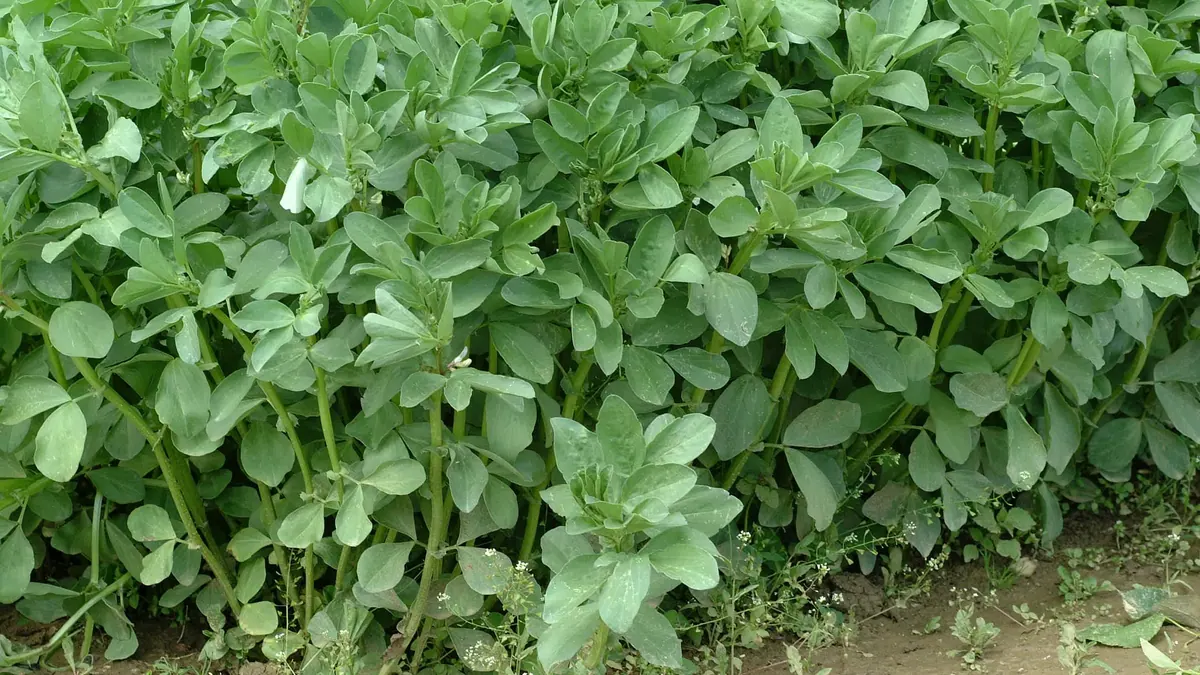
Faba bean, whole crop — BMP: 2 studies, weighted mean 296 m³ CH₄/t VS
296 m³ CH₄/t VS weighted mean from 2 studies
≈52 %
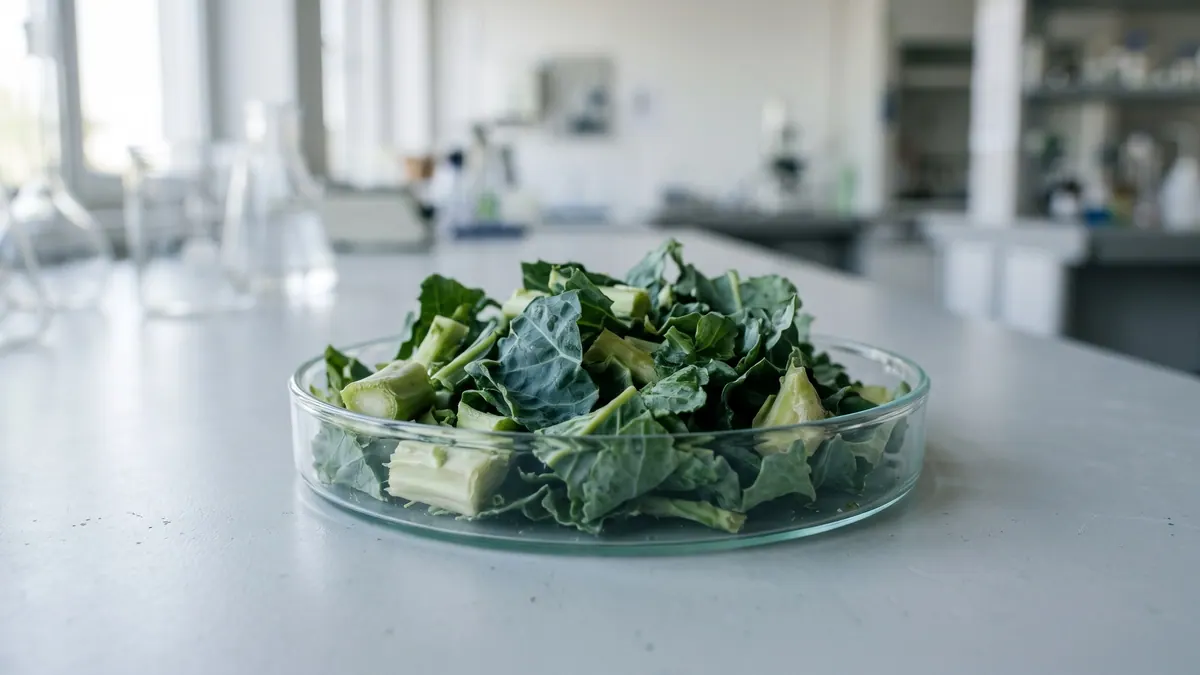
Marrow kale — BMP: 2 studies, weighted mean 315 m³ CH₄/t VS
315 m³ CH₄/t VS weighted mean from 2 studies
≈52 %
Meadow hay — BMP: 16 studies, weighted mean 279 m³ CH₄/t VS
279 m³ CH₄/t VS weighted mean from 16 studies
very good — editorial rating for biogas plants53 %