

BMP testingAlgae and aquatic plants
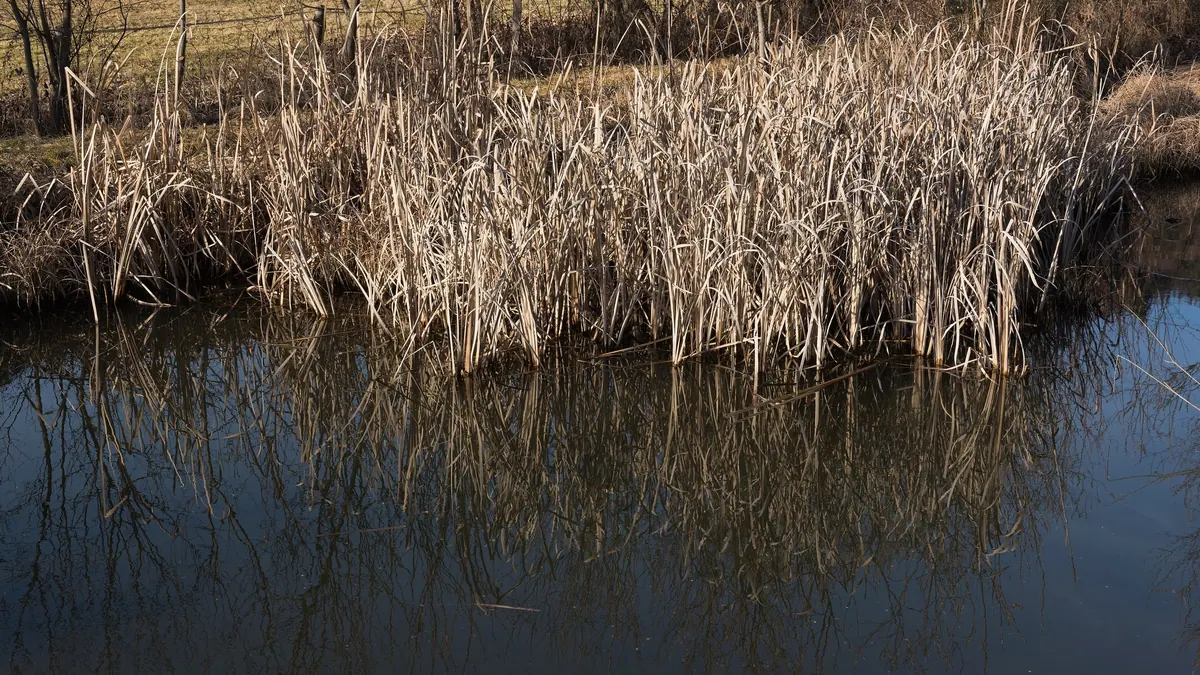
Cattail (Typha spp.) — BMP: 11 studies, weighted mean 154 m³ CH₄/t VS
Cattail (Typha latifolia, T. angustifolia) is a tall marsh plant, considered as a raw material from wetlands (paludiculture); the result depends on fertilisation and harvest date.
Photo Johann Jaritz / Wikimedia Commons, licence CC BY-SA 4.0, source file; changes: cropping

- Weighted mean
- 154m³ CH₄/t VS
- Range
- 24–249m³ CH₄/t VS
- Records
- 11studies
- Publications
- 3sources
- Temperatures
- 37 °Cof the test
Methane in biogas
Medium methane content · ≈ 5.2 kWh/m³ of biogas
estimate from the substrate type The collected studies contain no measurement. The interval follows from the approximate composition (carbohydrate-dominated (no protein or fat characteristics)) and the yields of compound groups according to FNR.
Rating for biogas plants
not rated — editorial rating for biogas plants
Not rated: no dry matter or volatile solids in the data. We calculate the rating when the dry matter and volatile solids of the material are known.
Add to the co-digestion calculator CSV data
BMP curves from 11 studies
Weighted mean Individual records
Dashed lines are a model curve (first-order kinetics, B(t) = B₀·(1 − e−kt)); the end point comes from the publication. All curves are model curves.
Cumulative methane production over the test [m³ CH₄/t VS]. The thick line is the weighted mean of all records (154); dots mark the end values given in the publications. Point at the chart to read values; click a legend item to hide or show a record.
Records and sources
Download CSV| Source | BMP m³ CH₄/t VS | Temperature | Sample | Curve |
|---|---|---|---|---|
| Eller et al. (2020) · 1 DOI | 140 | — | T. angustifolia, fertilization A | end point (model curve) |
| Eller et al. (2020) · 2 DOI | 172 | — | T. angustifolia, fertilization B | end point (model curve) |
| Eller et al. (2020) · 3 DOI | 204 | — | T. angustifolia, fertilization C | end point (model curve) |
| Eller et al. (2020) · 4 DOI | 213 | — | T. latifolia, fertilization A | end point (model curve) |
| Eller et al. (2020) · 5 DOI | 249 | — | T. latifolia, fertilization C | end point (model curve) |
| Czubaszek et al. (2021) · 1 DOI | 185 | — | Typha latifolia (TL), dry fermentation | end point (model curve) |
| Czubaszek et al. (2021) · 2 DOI | 237 | — | Typha latifolia (TL), wet fermentation | end point (model curve) |
| Moretti et al. (2023) · 1 DOI | 24 | 37 °C · mesophilic | Typha dominguensis (cattail), S/I ratio 0.25 gVS/gVS, coarse granulometry (0.25-C) | end point (model curve) |
| Moretti et al. (2023) · 2 DOI | 50 | 37 °C · mesophilic | Typha dominguensis (cattail), S/I ratio 0.25 gVS/gVS, fine granulometry (0.25-F) | end point (model curve) |
| Moretti et al. (2023) · 3 DOI | 70 | 37 °C · mesophilic | Typha dominguensis (cattail), S/I ratio 0.50 gVS/gVS, coarse granulometry (0.50-C) | end point (model curve) |
| Moretti et al. (2023) · 4 DOI | 80 | 37 °C · mesophilic | Typha dominguensis (cattail), S/I ratio 0.50 gVS/gVS, fine granulometry (0.50-F) | end point (model curve) |
| Weighted mean | 154 | arithmetic mean 148, SD 80 | ||
Process properties
Advantages
- Methane yield in the compendium: median 172 (range 24–249) m³ CH₄/t VS, 11 records from 3 papers (weighted mean 154).
- Bulrush was studied among wetland plants with regard to harvest date and methane yield (Eller et al. (2020); Moretti et al. (2023))
- Wetland biomass was studied in both wet and dry digestion (Czubaszek et al. (2021))
Dosing
The sources do not give a safe share of this substrate in the feed.
Sources of the process data
- Biomethane Yield from Different European Phragmites australis Genotypes, Compared with Other Herbaceous Wetland Species Grown at Different Fertilization Regimes
- Specific Methane Yield of Wetland Biomass in Dry and Wet Fermentation Technologies
- Biogas from aquatic plants: A bioenergetics incentive for constructed wetlands usage
- Biochemical methane potential and biodegradability of complex organic substrates
- Effects of size and thermophilic pre-hydrolysis of banana peel during anaerobic digestion, and biomethanation potential of key tropical fruit wastes
- Effect of particle size on biogas generation from biomass residues
The co-digestion calculator will assess a specific mixture containing this substrate.
What it is and where it comes from
Cattail (Typha) is a genus of tall marsh plants; in Poland the broadleaf cattail (Typha latifolia) and the narrowleaf cattail (Typha angustifolia) grow. It forms dense reedbeds in shallow water, on the banks of water bodies and on flooded fields. The dataset groups broadleaf and narrowleaf cattail, as well as samples from different fertilisation variants and one dry digestion variant. Cattail is grown experimentally as biomass on rewetted peatlands within paludiculture, that is, farming on wetlands.
Properties relevant to digestion
Cattail biomass is lignocellulosic: it contains cellulose, hemicelluloses and lignin, the share of which increases as the plant matures. Young leaves are more readily degradable than mature, woody shoots and rhizomes. The plant usually has a moderate protein and ash content, and its susceptibility depends on harvesting at the vegetative stage or after drying on the stem. The material is fibrous and requires size reduction, as otherwise it forms a floating crust and layers. Sand and sediment from the substrate may contaminate biomass from natural stands.
How to read the spread of results
The spread in the dataset is wide because it includes different cattail species, fertilisation variants, different harvest dates and different digestion techniques, including dry digestion. The maturity of the plant is crucial: green summer biomass has a different composition from dry winter biomass. Size reduction, temperature, substrate-to-inoculum ratio and test length also have an effect. Low values usually correspond to mature, woody biomass or to tests in which the plateau was not reached.
In biogas plant practice
Cattail is not a typical substrate for agricultural biogas plants, but it is sometimes considered as biomass from controlled wetland cultivation, combining energy production with peatland protection. Harvesting on wetlands requires specialist equipment. The biomass should be size-reduced, preferably harvested at a younger stage and combined with substrates richer in readily available carbohydrates and nitrogen. Legal requirements concern, among other things, the use of protected areas and wetlands and sustainability criteria, if the biomass is to be used for fuel production.
It is worth adding that harvesting cattail in winter, when the plant is dry, eases logistics and storage, but at the cost of lower susceptibility to degradation. The choice of harvest date is therefore a compromise between yield and cost.
Methodology in brief
BMP is the amount of methane obtained from volatile solids (VS) in a batch test, given in m³ CH₄ per tonne of VS (numerically the same as NmL CH₄/g VS in the publications) and converted to normal conditions (0 °C, 101.325 kPa). The weighted mean gives each publication a total weight of 1, split equally between its results for the substrate — a paper testing twenty varieties does not outweigh a paper with a single sample. In inter-laboratory programmes the unit is the laboratory (total weight 1), and within it the weight of a test grows with the number of bottles (replicates). Results after pretreatment (e.g. thermal, chemical, enzymatic) are shown separately and are not included in the mean.
Solid lines are curves measured in the tests. Where a publication gives only the final result, we draw a first-order kinetic model, B(t) = B₀·(1 − e−kt): only the end point comes from the publication, and the shape of the curve serves purely as visualisation — do not read the production on a particular day from it. For this substrate k = 0.102 d−1 was assumed (median of rate constants k reported in the sources and/or fitted to the mean measured curves).
The statistics describe the spread of published results — a descriptive compilation, not a meta-analysis or a guarantee of plant yield.
Bibliography
- Eller, F.; Ehde, P.M.; Oehmke, C.; Ren, L.; Brix, H.; Sorrell, B.K.; Weisner, S.E.B. (2020). Biomethane Yield from Different European Phragmites australis Genotypes, Compared with Other Herbaceous Wetland Species Grown at Different Fertilization Regimes. Resources 9(5), 57. DOI: 10.3390/resources9050057 DOI
- Czubaszek, R.; Wysocka-Czubaszek, A.; Wichtmann, W.; Banaszuk, P. (2021). Specific Methane Yield of Wetland Biomass in Dry and Wet Fermentation Technologies. Energies 14(24), 8373. DOI: 10.3390/en14248373 DOI
- Moretti, E.R.; Roston, D.M.; da Silva, A.J.; Reyes, I.P. (2023). Biogas from aquatic plants: A bioenergetics incentive for constructed wetlands usage. Heliyon 9(2), e12537. DOI: 10.1016/j.heliyon.2022.e12537 DOI
All sources of the site: bibliography.
Other substrates in the group “Algae and aquatic plants”
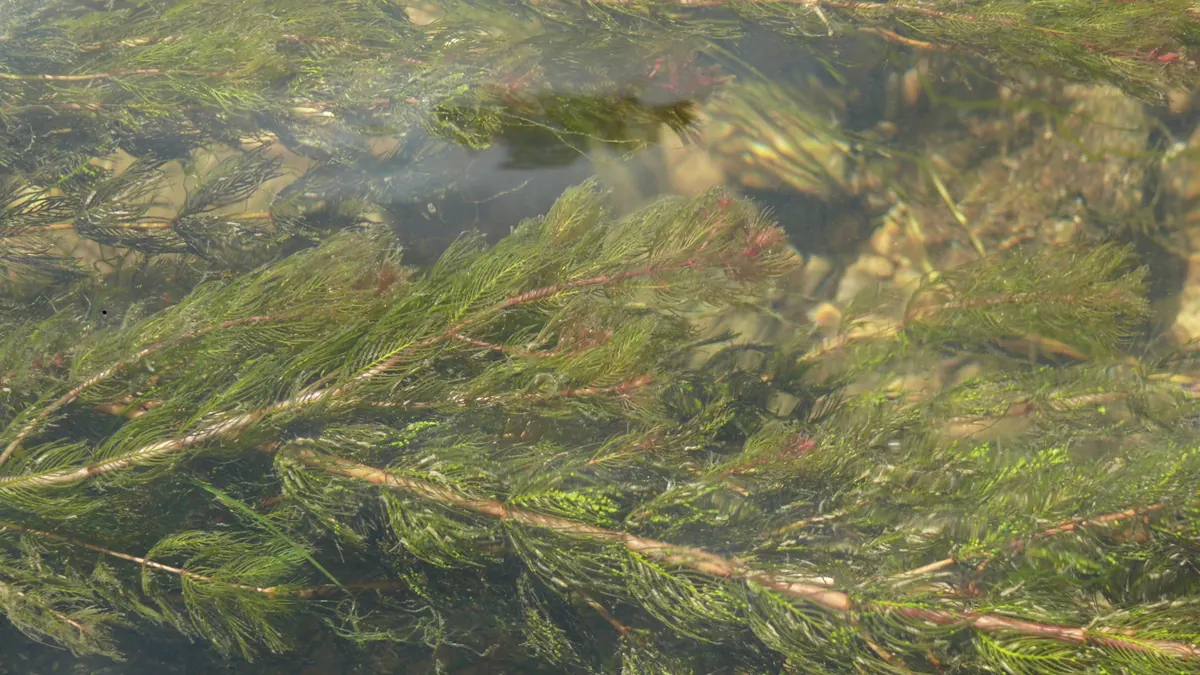
Watermilfoil — BMP: 2 studies, weighted mean 220 m³ CH₄/t VS
220 m³ CH₄/t VS weighted mean from 2 studies
≈52 %
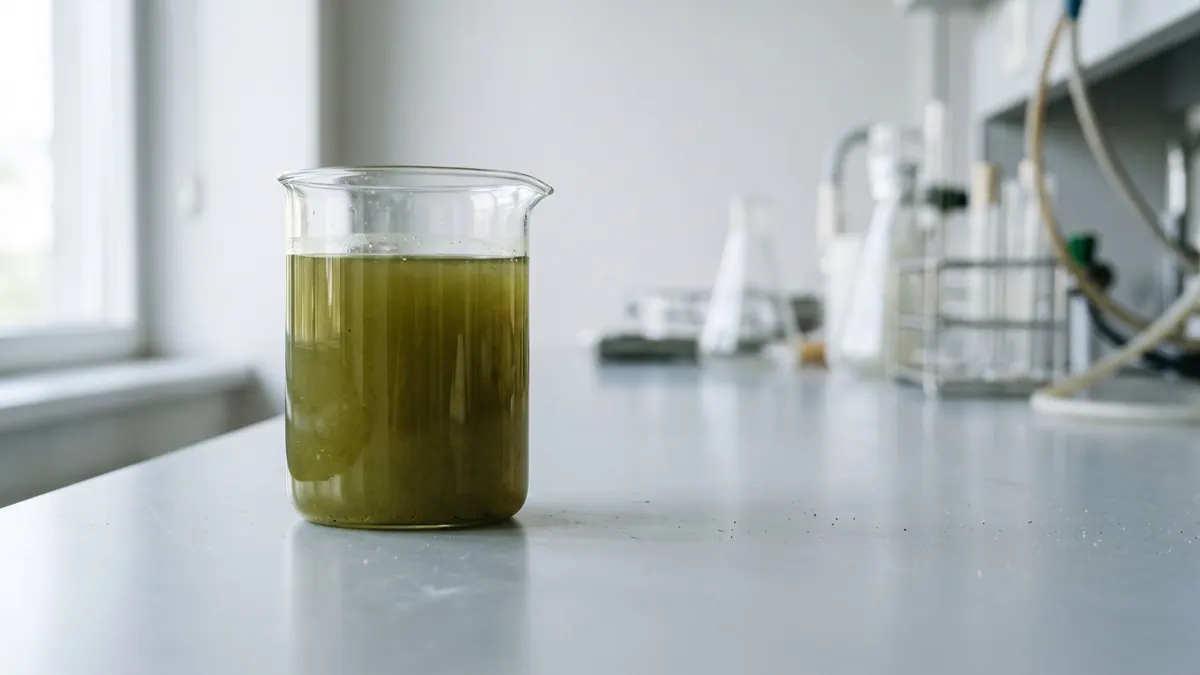
Nannochloropsis salina — BMP: 8 studies, weighted mean 417 m³ CH₄/t VS
417 m³ CH₄/t VS weighted mean from 8 studies
≈58 %
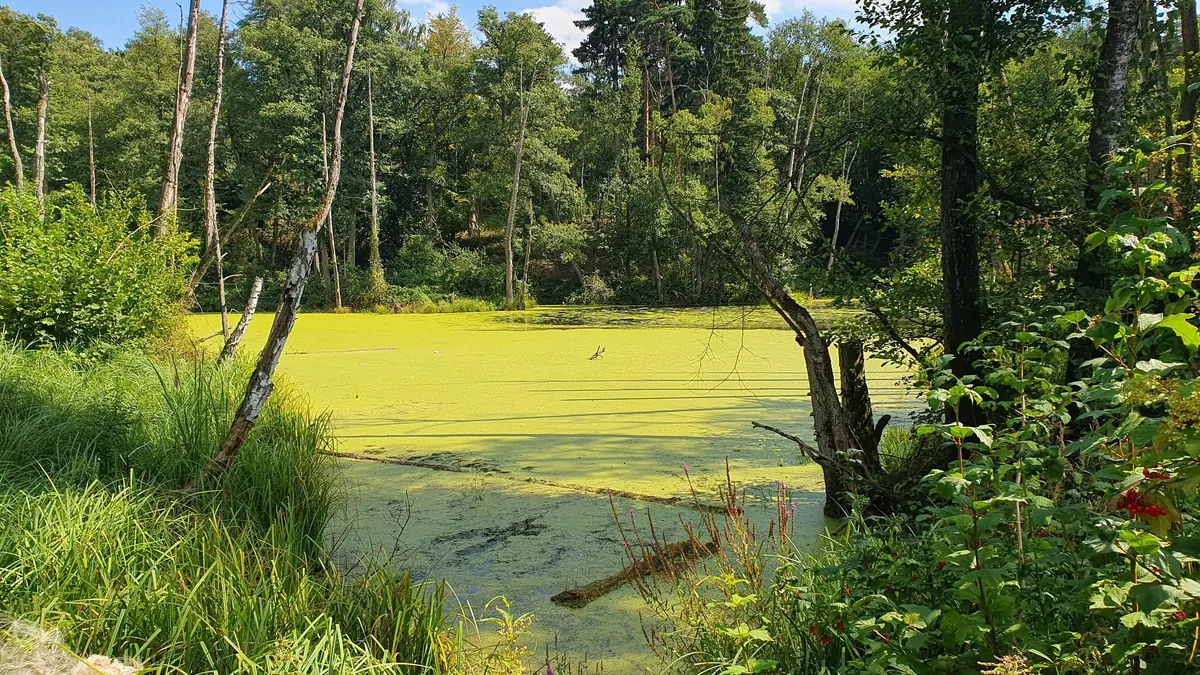
Floating aquatic plants (duckweed, frogbit, water lettuce, salvinia, water chestnut) — BMP: 5 studies, mean 310 m³ CH₄/t VS
310 m³ CH₄/t VS weighted mean from 5 studies
neutral — editorial rating for biogas plants≈52 %
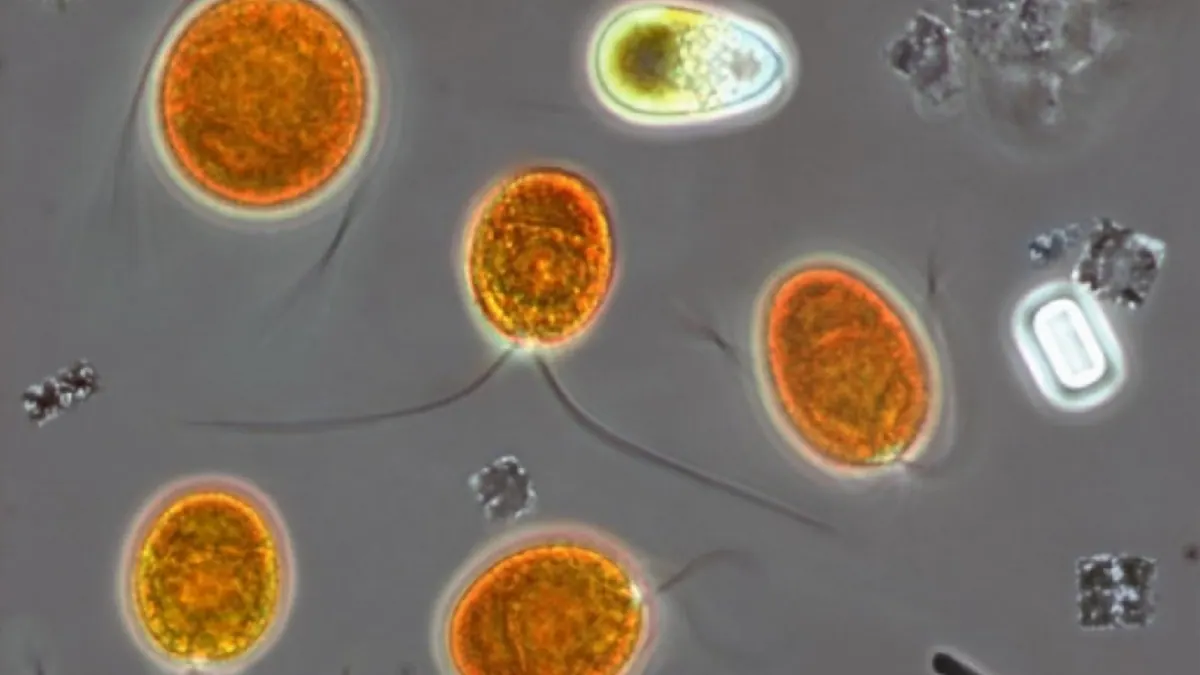
Dunaliella salina — BMP: 3 studies, weighted mean 221 m³ CH₄/t VS
221 m³ CH₄/t VS weighted mean from 3 studies
≈58 %