

BMP testingAlgae and aquatic plantssingle study (8 samples)
Nannochloropsis salina — BMP: 8 studies, weighted mean 417 m³ CH₄/t VS
Nannochloropsis salina (Microchloropsis salina) is a marine microalga with a resistant cell wall; the dataset contains several values from a single review with different preparation.
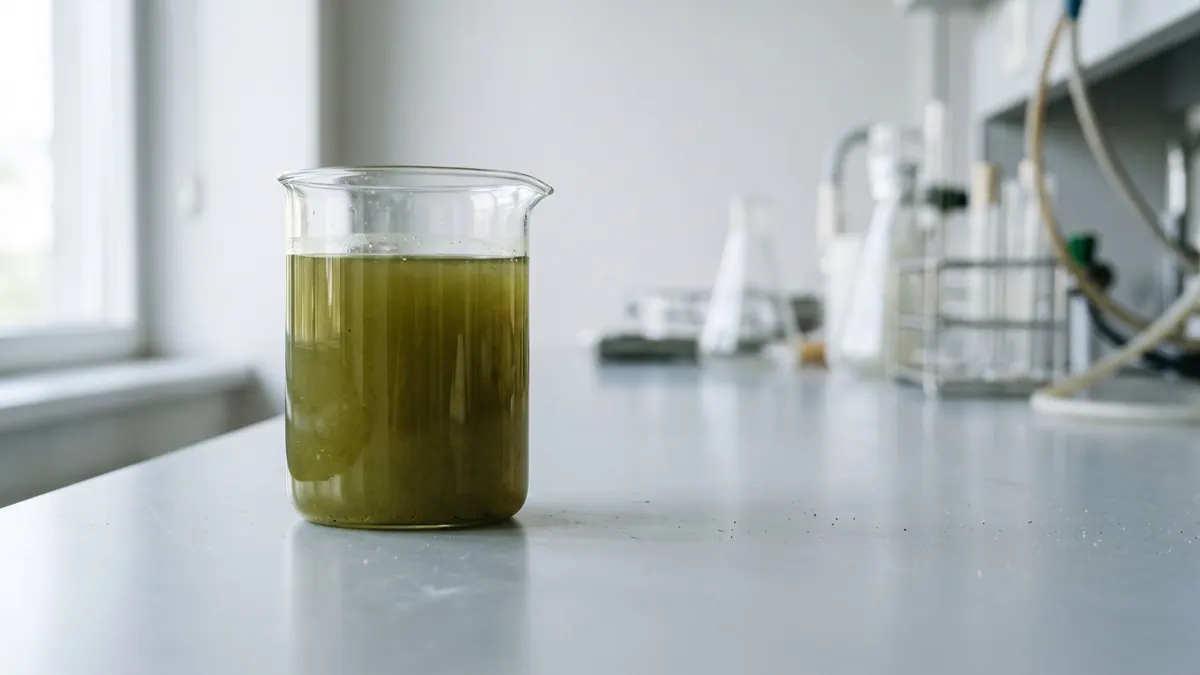
Illustration: FeedstockData (AI, Google Gemini)
- Weighted mean
- 417m³ CH₄/t VS
- Range
- 233–557m³ CH₄/t VS
- Records
- 8single study (8 samples)
- Publications
- 1source
- Temperatures
- 35 °C, 38 °Cof the test
Methane in biogas
Medium methane content · ≈ 5.8 kWh/m³ of biogas
estimate from the substrate type The collected studies contain no measurement. The interval follows from the approximate composition (protein-rich (process classification)) and the yields of compound groups according to FNR.
Rating for biogas plants
not rated — editorial rating for biogas plants
Not rated: no dry matter or volatile solids in the data. We calculate the rating when the dry matter and volatile solids of the material are known.
Add to the co-digestion calculator CSV data
BMP curves from 8 studies
Weighted mean Individual records
Dashed lines are a model curve (first-order kinetics, B(t) = B₀·(1 − e−kt)); the end point comes from the publication. All curves are model curves.
Cumulative methane production over the test [m³ CH₄/t VS]. The thick line is the weighted mean of all records (417); dots mark the end values given in the publications. Point at the chart to read values; click a legend item to hide or show a record.
Records and sources
Download CSV| Source | BMP m³ CH₄/t VS | Temperature | Sample | Curve |
|---|---|---|---|---|
| Jankowska et al. (2017) · 1 DOI | 233 | 38 °C · mesophilic | (orig.: “Nannochloropsis salina”): value quoted in a literature review · pretreatment: particle size reduction/sample preparation (MY-D: physical treatment) | end point (model curve) |
| Jankowska et al. (2017) · 2 DOI | 274 | 38 °C · mesophilic | (orig.: “Nannochloropsis salina”): value quoted in a literature review · pretreatment: particle size reduction/sample preparation (MY-D: physical treatment) | end point (model curve) |
| Jankowska et al. (2017) · 3 DOI | 347 | 38 °C · mesophilic | (orig.: “Nannochloropsis salina”): value quoted in a literature review | end point (model curve) |
| Jankowska et al. (2017) · 4 DOI | 430 | 35 °C · mesophilic | (orig.: “Nannochloropsis salina”): value quoted in a literature review | end point (model curve) |
| Jankowska et al. (2017) · 5 DOI | 460 | 38 °C · mesophilic | (orig.: “Nannochloropsis salina”): value quoted in a literature review · pretreatment: particle size reduction/sample preparation (MY-D: physical treatment) | end point (model curve) |
| Jankowska et al. (2017) · 6 DOI | 487 | 38 °C · mesophilic | (orig.: “Nannochloropsis salina”): value quoted in a literature review · pretreatment: particle size reduction/sample preparation (MY-D: physical treatment) | end point (model curve) |
| Jankowska et al. (2017) · 7 DOI | 549 | 38 °C · mesophilic | (orig.: “Nannochloropsis salina”): value quoted in a literature review · pretreatment: particle size reduction/sample preparation (MY-D: physical treatment) | end point (model curve) |
| Jankowska et al. (2017) · 8 DOI | 557 | 35 °C · mesophilic | (orig.: “Nannochloropsis salina”): value quoted in a literature review | end point (model curve) |
| Weighted mean | 417 | arithmetic mean 417, SD 121 | ||
Process properties
Low confidence: the description is based on general characteristics of the substrate group, not on studies of this material. Treat it as a hint to be verified.
Advantages
- Methane yield in the compendium: median 445 (range 233–557) m³ CH₄/t VS, 8 records from 1 papers (weighted mean 417).
Drawbacks and risks
- The high protein content of the cells causes release of ammonia, which can be toxic to the process (Sialve et al. (2009); Rajagopal et al. (2013))
- The presence of sodium in marine species may impair digester operation (Sialve et al. (2009))
Co-digestion — what to combine it with, what to watch out for
- combines well
substrates: carbon-rich — e.g. Wheat straw, Maize silage (whole crop), Cereal straw (unspecified), Willow (short rotation), Cardboard and paperboard
The low C/N of algal sludge was balanced by the addition of paper: 50-60% VS of paper increased the rate of methane production, optimum C/N 20-25.[1][2]
- caution
substrates: nitrogen-rich — e.g. Pig slurry, Poultry manure, Waste activated sludge (secondary sludge), Chlorella vulgaris, Lucerne (alfalfa)
Algal protein releases ammonia; additional nitrogen sources increase the risk of ammonia inhibition.[2][3]
- caution
substrates: saline — e.g. Food waste, Whey, Sargassum biomass, Poultry manure, Bread and bakery waste
Sodium from marine species may impair digester operation: do not combine with other salty substrates without monitoring salinity.[2]
Dosing
No source limits on the dose for this substrate.
Introduce gradually, starting with a small dose and monitoring the process (e.g. FOS/TAC, pH, gas composition).
Practical requirements
- Do not dry the biomass before feeding: drying lowered biogas production to about 80% (Mussgnug et al. (2010))
- Monitor ammonia (high protein) and, for marine species, sodium (Sialve et al. (2009))
Sources of the process data
- Anaerobic co-digestion of algal sludge and waste paper to produce methane
- Anaerobic digestion of microalgae as a necessary step to make microalgal biodiesel sustainable
- A critical review on inhibition of anaerobic digestion process by excess ammonia
- Biogas from microalgae: Review on microalgae's cultivation, harvesting and pretreatment for anaerobic digestion
- Microalgae as substrates for fermentative biogas production in a combined biorefinery concept
The co-digestion calculator will assess a specific mixture containing this substrate.
What it is and where it comes from
Nannochloropsis salina, in the newer classification Microchloropsis salina, is a marine microalga grown in tanks and photobioreactors, studied mainly for its lipid content. The records in the dataset come from a single review and include several variants of the same biomass. It is not a substrate used in biogas plants, and the values serve to assess the possibilities of managing algal biomass.
Properties relevant to digestion
The cell wall of Nannochloropsis contains biopolymers resistant to hydrolysis, so without pretreatment it is hard for enzymes to reach the cytoplasm. The biomass contains protein, lipids and carbohydrates in proportions that depend on the growing conditions. A high lipid content increases the methane potential, but can cause inhibition by long-chain fatty acids and foaming. Protein releases ammonia. The marine origin of the biomass is associated with the possible presence of salt, which at higher concentrations inhibits methanogenesis if the biomass has not been washed.
How to read the spread of results
The dataset contains several records from a single compilation, so the spread does not result from differences between laboratories, but from sample variants and conditions: pretreatment (cell disruption, heating), temperature (mesophilic variants occur in the dataset), biomass composition and digestion time. With work based on one source, differences in measurement methodology, which could give different values in another laboratory, are also not visible. The results were cited from the review, without a full description of all the conditions, which limits their comparability.
In biogas plant practice
Nannochloropsis salina is not a typical substrate. As a feedstock it is considered in biorefinery concepts, where lipids and pigments are obtained first and the residue is digested. To avoid problems, desalination or dilution of the biomass, cell disruption and limited dosing because of LCFA and ammonia are planned. Legal requirements depend on the origin and status of the biomass.
In practice a sensible strategy is to assess several pretreatment variants on your own batch of biomass, because the gain from cell disruption varies and does not always offset the energy cost. It is also worth measuring the sodium and ammonia concentration in the digester during tests.
For comparison with other microalgae, this genus is among the biomasses with a particularly high lipid content, which means both a higher potential and a greater risk of process disturbances.
Methodology in brief
BMP is the amount of methane obtained from volatile solids (VS) in a batch test, given in m³ CH₄ per tonne of VS (numerically the same as NmL CH₄/g VS in the publications) and converted to normal conditions (0 °C, 101.325 kPa). The weighted mean gives each publication a total weight of 1, split equally between its results for the substrate — a paper testing twenty varieties does not outweigh a paper with a single sample. In inter-laboratory programmes the unit is the laboratory (total weight 1), and within it the weight of a test grows with the number of bottles (replicates). Results after pretreatment (e.g. thermal, chemical, enzymatic) are shown separately and are not included in the mean.
Solid lines are curves measured in the tests. Where a publication gives only the final result, we draw a first-order kinetic model, B(t) = B₀·(1 − e−kt): only the end point comes from the publication, and the shape of the curve serves purely as visualisation — do not read the production on a particular day from it. For this substrate k = 0.102 d−1 was assumed (median of rate constants k reported in the sources and/or fitted to the mean measured curves).
The statistics describe the spread of published results — a descriptive compilation, not a meta-analysis or a guarantee of plant yield.
Bibliography
- Jankowska, E.; Sahu, A.K.; Oleskowicz-Popiel, P. (2017). Biogas from microalgae: Review on microalgae's cultivation, harvesting and pretreatment for anaerobic digestion. Renewable and Sustainable Energy Reviews 75, 692–709. DOI: 10.1016/j.rser.2016.11.045 DOI
All sources of the site: bibliography.
Other substrates in the group “Algae and aquatic plants”
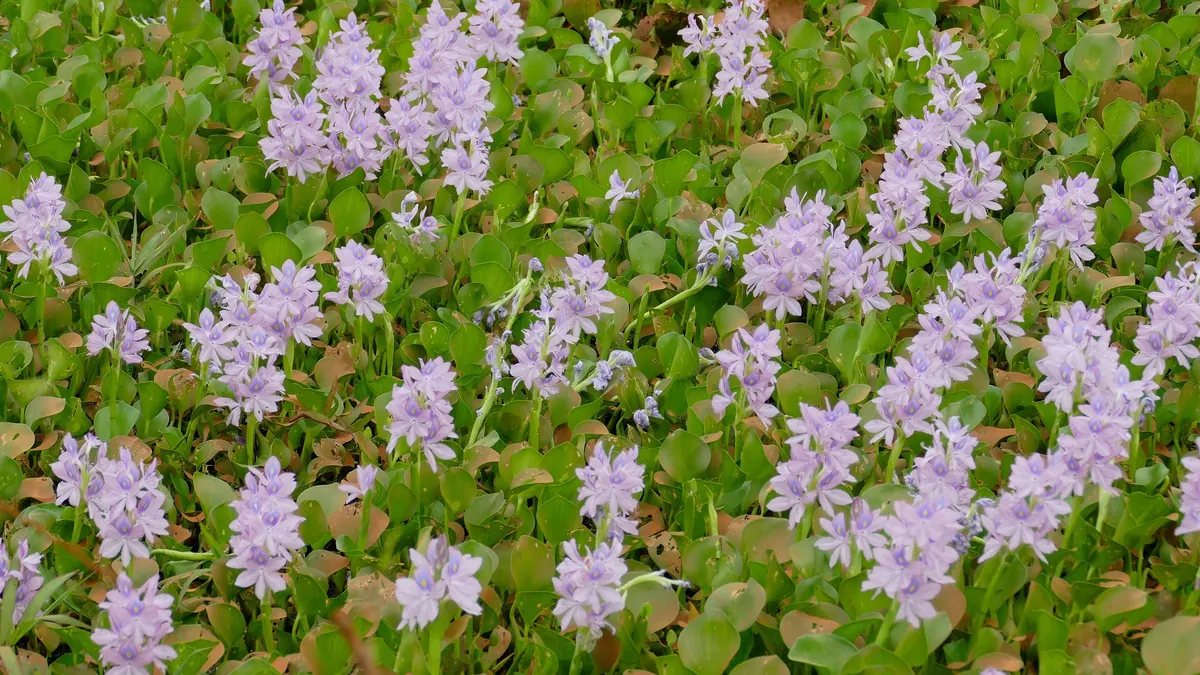
Water hyacinth — BMP: 3 studies, weighted mean 191 m³ CH₄/t VS
191 m³ CH₄/t VS weighted mean from 3 studies
≈52 %
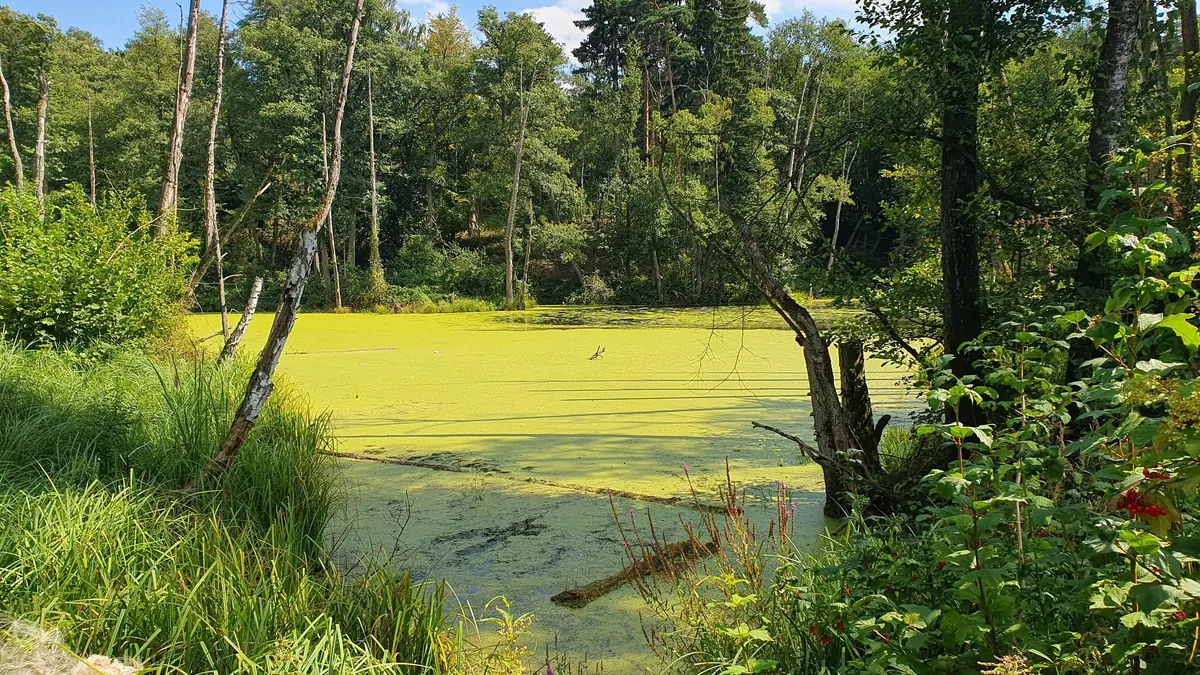
Floating aquatic plants (duckweed, frogbit, water lettuce, salvinia, water chestnut) — BMP: 5 studies, mean 310 m³ CH₄/t VS
310 m³ CH₄/t VS weighted mean from 5 studies
neutral — editorial rating for biogas plants≈52 %
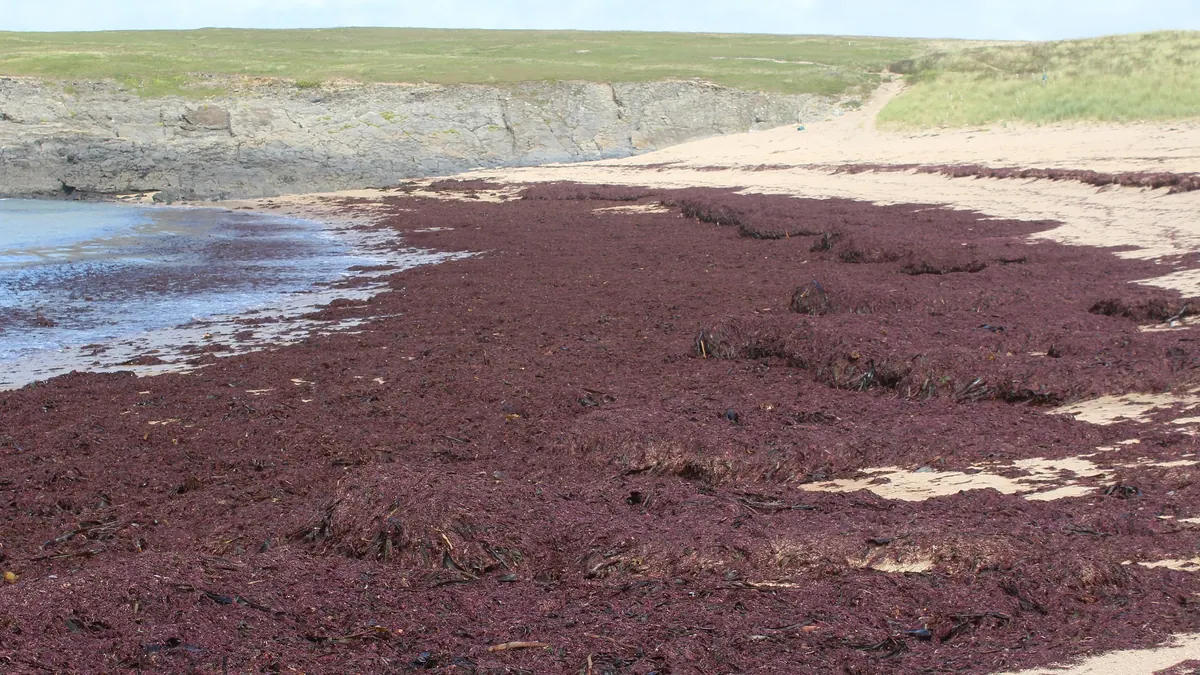
Beach-cast macroalgae (mix) — BMP: 5 studies, weighted mean 70 m³ CH₄/t VS
70 m³ CH₄/t VS weighted mean from 5 studies
≈56 %
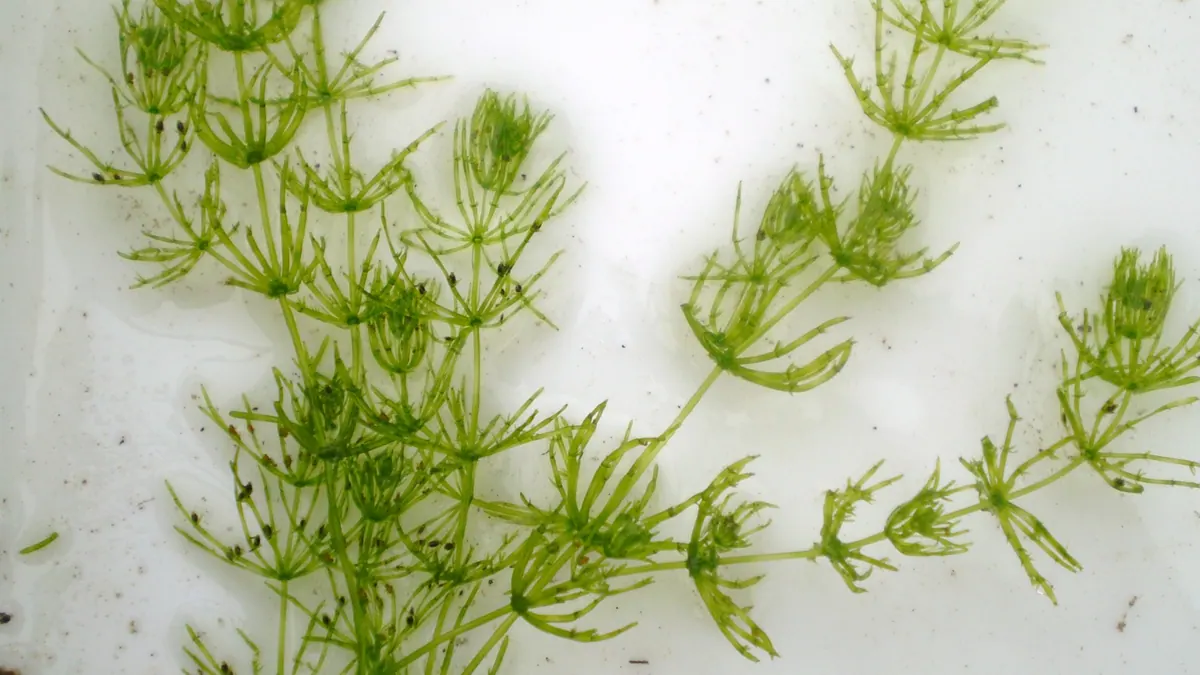
Submerged lake macrophytes (Chara, water celery) — BMP: 2 studies, weighted mean 385 m³ CH₄/t VS
385 m³ CH₄/t VS weighted mean from 2 studies
≈52 %