

BMP testingMilk, whey and dairy waste
Whey — BMP: 19 studies, weighted mean 416 m³ CH₄/t VS
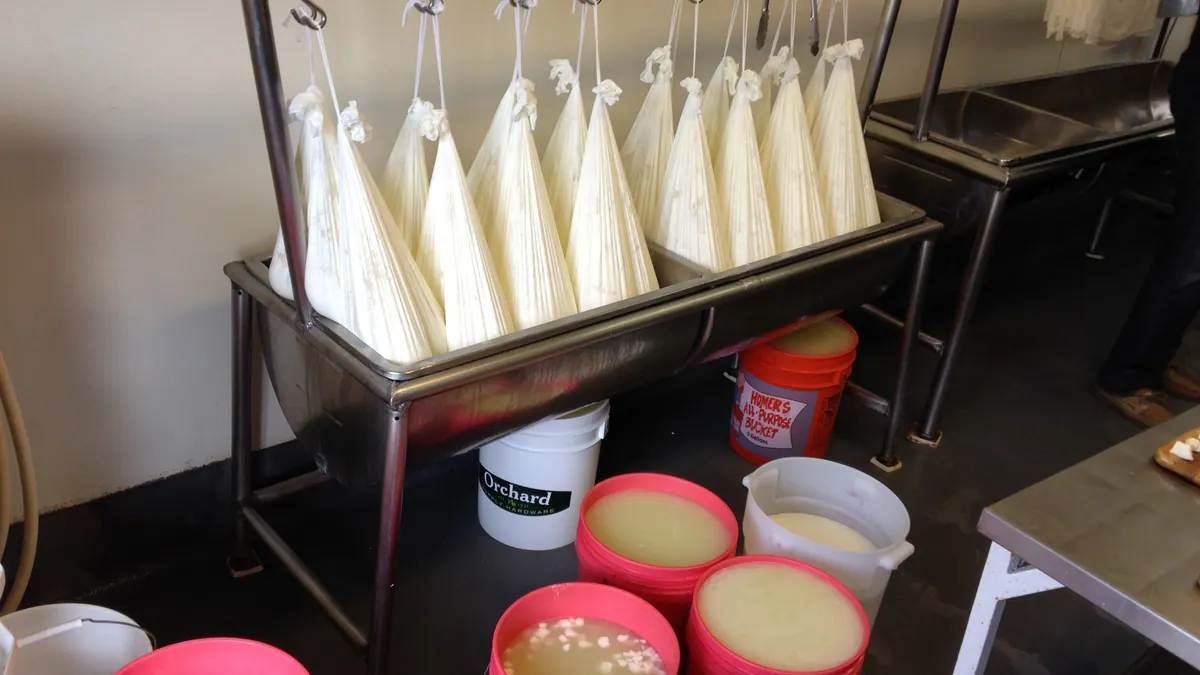
Whey, a by-product of cheesemaking, is a liquid substrate rich in lactose, which ferments quickly but readily acidifies the reactor and requires buffering.
rating: neutralCH₄ ≈ 53 % (estimate)
Photo chuck b. / Wikimedia Commons, licence CC BY 2.0, source file; changes: cropping

- Weighted mean
- 416m³ CH₄/t VS
- Range
- 274–526m³ CH₄/t VS
- Records
- 19studies
- Publications
- 8sources
- Temperatures
- 35 °C, 40 °Cof the test
Methane in biogas
Medium methane content · ≈ 5.3 kWh/m³ of biogas
estimate from the substrate type The collected studies contain no measurement. The interval follows from the approximate composition (protein from total nitrogen (N 1.8 % DM × 6.25)) and the yields of compound groups according to FNR.
Rating for biogas plants
neutral — editorial rating for biogas plantsNo clear advantages — worth charging a fee for accepting it
Potential per tonne of fresh matter: moderate (26 m³ CH₄/t); process risk: salt / sodium, acidification. No additional handling requirements.
Why? Rating factors
Potential per tonne +1
- +1potential 26 m³ CH₄/t fresh matter (BMP 416 × DM 6.9 % × VS 91.8 %)
Process stability −1.5
- −1salt / sodium: inhibition at high shares
- −0.5acidification: rapid degradation / acidic pH, risk of VFA accumulation, needs buffering
Handling and costs 0
- 0no factors
Total points: −0.5 · thresholds: ≥ 2.5 very good, ≥ 1 good, below — neutral; negative with cumulative process risk.
Add to the co-digestion calculator CSV data
BMP curves from 19 studies
Weighted mean Individual records
Dashed lines are a model curve (first-order kinetics, B(t) = B₀·(1 − e−kt)); the end point comes from the publication. Solid lines are measurements (5).
Cumulative methane production over the test [m³ CH₄/t VS]. The thick line is the weighted mean of all records (416); dots mark the end values given in the publications. Point at the chart to read values; click a legend item to hide or show a record.
Show the remaining records in the legend (7)
Records and sources
Download CSV| Source | BMP m³ CH₄/t VS | Temperature | Sample | Curve |
|---|---|---|---|---|
| Hafner et al. (2026) · lab. E18 · 1 DOI | 395 | — · mesophilic | Whey | measurement (31 pts) |
| Hafner et al. (2026) · lab. E18 · 2 DOI | 424 | — · mesophilic | Whey | measurement (31 pts) |
| Hafner et al. (2026) · lab. R05 DOI | 433 | — · mesophilic | Whey | measurement (31 pts) |
| Hafner et al. (2026) · lab. E07 DOI | 464 | — · mesophilic | Whey | measurement (31 pts) |
| Hafner et al. (2026) · lab. R03 DOI | 480 | — · mesophilic | Whey | measurement (31 pts) |
| Fernández-Rodríguez et al. (2021) DOI | 274 | — | Cheese whey (100% whey) | end point (model curve) |
| Rico et al. (2014) · 1 DOI | 337 | 35 °C · mesophilic | cheese whey (sample CW1) | end point (model curve) |
| Rico et al. (2014) · 2 DOI | 351 | 35 °C · mesophilic | cheese whey (sample CW3) | end point (model curve) |
| Dinuccio et al. (2010) DOI | 501 | 40 °C · mesophilic | Whey | end point (model curve) |
| Holliger et al. (2017) DOI | 526 | — | Whey | end point (model curve) |
| Labatut et al. (2011) DOI | 424 | 35 °C · mesophilic | Cheese whey | end point (model curve) |
| Mainardis et al. (2019) · 1 DOI | 350 | 35 °C · mesophilic | Fat CW4 (F4) | end point (model curve) |
| Mainardis et al. (2019) · 2 DOI | 353 | 35 °C · mesophilic | Skimmed CW3 (S3) | end point (model curve) |
| Mainardis et al. (2019) · 3 DOI | 365 | 35 °C · mesophilic | Fat CW1 (F1) | end point (model curve) |
| Mainardis et al. (2019) · 4 DOI | 380 | 35 °C · mesophilic | Fat CW3 (F3) | end point (model curve) |
| Mainardis et al. (2019) · 5 DOI | 408 | 35 °C · mesophilic | Mozzarella CW1 (M1) | end point (model curve) |
| Mainardis et al. (2019) · 6 DOI | 430 | 35 °C · mesophilic | Fat CW2 (F2) | end point (model curve) |
| Mainardis et al. (2019) · 7 DOI | 437 | 35 °C · mesophilic | Fat CW5 (F5) | end point (model curve) |
| Llanos-Lizcano et al. (2024) DOI | 335 | — | Dairy industry waste (DIW, lacto serum), ISR 2 | end point (model curve) |
| Weighted mean | 416 | arithmetic mean 404, SD 64 | ||
Typical composition
- Dry matter (DM)
- 6.9% (range 5.8–7.3)
- Volatile solids (VS)
- 91.8 % DM (range 84–92.7)
- Nitrogen
- 1.8 % DM
Median and range of the determinations reported in the publications behind this substrate's BMP records (read from: MY-D); dry matter: 8 determinations, volatile solids: 8 determinations.
Sources: Dinuccio et al. (2010); Labatut et al. (2011); Mainardis et al. (2019).
The composition of the raw material varies between batches — for plant calculations use an analysis of your own sample. The calculator inserts typical values automatically.
Process properties
Advantages
- Methane potential in the Substraty.pl BMP dataset: weighted mean 416.2 m³ CH₄/t VS (SD 64.0; 19 records, 8 sources).
- Whey co-digested with dairy slurry - biogas optimisation was carried out (Kavacik and Topaloglu 2010; Hublin et al. 2012).
- Low DM allows pumping and combining with solid substrates (Prazeres et al. 2012).
Drawbacks and risks
- Lactose ferments quickly and acidifies; whey has low alkalinity (Prazeres et al. 2012).
- High salt content in whey from salted cheeses (Prazeres et al. 2012).
Co-digestion — what to combine it with, what to watch out for
- combines well
substrates: high alkalinity (buffer) — e.g. Cattle manure, Pig slurry, Cattle slurry, Duck slurry, Rumen and digestive tract content
- caution
substrates: easily degradable — e.g. Maize silage (whole crop), Food waste, Sorghum, whole crop, Beet leaves and tops, Organic fraction of municipal solid waste
Dosing
No source-based percentage. A mix with slurry in optimisation studies (Hublin et al. 2012); start with a low share.
Introduce gradually, starting with a small dose and monitoring the process (e.g. FOS/TAC, pH, gas composition).
Practical requirements
- ABP cat. 3 (Art. 10 of Reg. 1069/2009; admitted to biogas plants by Art. 14): hygienisation before the digester in a mandatory unit: shredding to a maximum of 12 mm, temperature throughout the mass of at least 70 °C for at least 60 min without interruption (Reg. 142/2011, Annex V Ch. I Section 1 and Ch. III Section 1); the installation requires approval by the competent authority (Art. 24(1)(g) of Reg. 1069/2009).
- Milk, dairy products and colostrum may be used without hygienisation unless the authority considers there to be a risk of spreading a serious transmissible disease (Reg. 142/2011, Annex V, Chapter III, Section 1, point 1).
- Do not feed hygienised substrate into the digester hot (FNR 2010, Ch. 3: hygienisation).
Sources of the process data
- Kavacik, Topaloglu (2010). Biogas production from co-digestion of a mixture of cheese whey and dairy manure. Biomass Bioenergy
- Hublin, Zokic, Zelic (2012). Optimization of biogas production from co-digestion of whey and cow manure. Biotechnol. Bioprocess Eng.
- Prazeres, Carvalho, Rivas (2012). Cheese whey management: A review. J. Environ. Manage.
- Rozporządzenie (WE) nr 1069/2009 określające przepisy sanitarne dotyczące produktów ubocznych pochodzenia zwierzęcego (art. 9, 10, 12–14, 24)
- Rozporządzenie Komisji (UE) nr 142/2011 wykonujące rozporządzenie (WE) nr 1069/2009 (zał. IV rozdz. III, zał. V rozdz. I i III)
- FNR (2010). Guía sobre el Biogás – Desde la producción hasta el uso (hiszp. wydanie „Leitfaden Biogas”, GIZ 2013)
The co-digestion calculator will assess a specific mixture containing this substrate.
What it is and where it comes from
Whey is the liquid fraction remaining after casein is precipitated during the production of cheeses and curd cheeses. It arises in a quantity of several litres per kilogram of cheese, so for a dairy it is a mass by-product. Part of the whey goes to processing (whey proteins, lactose, feed), and surpluses and acid whey are sometimes directed to biogas plants. In Poland the dairy industry is well developed, so whey is an available feedstock in regions with large plants. The dataset contains samples of sweet and acid whey and measured curves from an inter-laboratory comparison programme.
Properties relevant to digestion
The dry matter of whey is only a few per cent, and most of it is lactose, alongside whey proteins, trace amounts of fat and mineral salts. Lactose is hydrolysed and fermented very quickly, which causes a rapid formation of organic acids. Whey has a low pH and little buffering capacity, so at too high a dose the pH in the digester falls, inhibiting methanogenic archaea. On the other hand, the ammonia content is low, and the low C/N can be corrected by mixing with slurry. A high salt content (particularly in whey from salted cheeses) may be inhibitory.
How to read the spread of results
The results are distributed moderately widely. Sweet and acid whey differ in composition, and whey from different cheese dairies also differs in protein, residual fat and salt content. Freshness matters: old whey has partly fermented and lost its readily available sugars. The result depends on the inoculum (its buffering and adaptation), the substrate-to-inoculum ratio, temperature, test length and the method of conversion to VS. The measured curves come from many laboratories that used different protocols.
In biogas plant practice
Whey is a good co-substrate in a mixture with slurry or manure, which provide buffer and nitrogen. It is dosed evenly, in a small share, with monitoring of pH and volatile acids. Storage requires cooling or a short time, because it sours quickly. As a product of animal origin, it is an animal by-product (ABP) within the meaning of Regulation (EC) No 1069/2009; the plant must be approved for processing such materials and meet requirements concerning, among other things, hygienisation, unless the authority permits a derogation.
Methodology in brief
BMP is the amount of methane obtained from volatile solids (VS) in a batch test, given in m³ CH₄ per tonne of VS (numerically the same as NmL CH₄/g VS in the publications) and converted to normal conditions (0 °C, 101.325 kPa). The weighted mean gives each publication a total weight of 1, split equally between its results for the substrate — a paper testing twenty varieties does not outweigh a paper with a single sample. In inter-laboratory programmes the unit is the laboratory (total weight 1), and within it the weight of a test grows with the number of bottles (replicates). Results after pretreatment (e.g. thermal, chemical, enzymatic) are shown separately and are not included in the mean.
Solid lines are curves measured in the tests. Where a publication gives only the final result, we draw a first-order kinetic model, B(t) = B₀·(1 − e−kt): only the end point comes from the publication, and the shape of the curve serves purely as visualisation — do not read the production on a particular day from it. For this substrate k = 0.270 d−1 was assumed (median of rate constants k reported in the sources and/or fitted to the mean measured curves).
The statistics describe the spread of published results — a descriptive compilation, not a meta-analysis or a guarantee of plant yield.
Bibliography
- Hafner, S.D.; Leca, E.; Sambusiti, C.; Astals, S.; Azam, O.; Koch, K.; Liu, J.; Møller, H.B.; Nistor, M.; Olaya-Rincon, M.; Peyrelasse, C.; Ward, A.J.; Zennaro, B.; Monlau, F. (2026). Reliable biochemical methane potential testing: insights and recommendations from global interlaboratory study. Bioresource Technology 446, 134136. DOI: 10.1016/j.biortech.2026.134136 DOI
- Fernández-Rodríguez, M.; Puntano, N.; Mancilla-Leytón, J.; Borja, R. (2021). Batch mesophilic anaerobic co-digestion of spent goat batch mesophilic anaerobic co-digestion of spent goat straw bedding and goat cheese whey: Comparison with the mono-digestion of the two sole substrates. Journal of Environmental Management 280, 111733. DOI: 10.1016/j.jenvman.2020.111733 DOI
- Rico, C.; Diego, R.; Valcarce, A.; Rico, J.L. (2014). Biogas Production from Various Typical Organic Wastes Generated in the Region of Cantabria (Spain): Methane Yields and Co-Digestion Tests. Smart Grid and Renewable Energy 05(06), 128–136. DOI: 10.4236/sgre.2014.56012 DOI
- Dinuccio, E.; Balsari, P.; Gioelli, F.; Menardo, S. (2010). Evaluation of the biogas productivity potential of some Italian agro-industrial biomasses. Bioresource Technology 101(10), 3780–3783. DOI: 10.1016/j.biortech.2009.12.113 DOI
- Holliger, C.; Fruteau de Laclos, H.; Hack, G. (2017). Methane Production of Full-Scale Anaerobic Digestion Plants Calculated from Substrate’s Biomethane Potentials Compares Well with the One Measured On-Site. Frontiers in Energy Research 5, 12. DOI: 10.3389/fenrg.2017.00012 DOI
- Labatut, R.A.; Angenent, L.T.; Scott, N.R. (2011). Biochemical methane potential and biodegradability of complex organic substrates. Bioresource Technology 102(3), 2255–2264. DOI: 10.1016/j.biortech.2010.10.035 DOI
- Mainardis, M.; Flaibani, S.; Trigatti, M.; Goi, D. (2019). Techno-economic feasibility of anaerobic digestion of cheese whey in small Italian dairies and effect of ultrasound pre-treatment on methane yield. Journal of Environmental Management 246, 557–563. DOI: 10.1016/j.jenvman.2019.06.014 DOI
- Llanos-Lizcano, R.; Senila, L.; Modoi, O.C. (2024). Evaluation of Biochemical Methane Potential and Kinetics of Organic Waste Streams for Enhanced Biogas Production. Agronomy 14(11), 2546. DOI: 10.3390/agronomy14112546 DOI
All sources of the site: bibliography.
Other substrates in the group “Milk, whey and dairy waste”
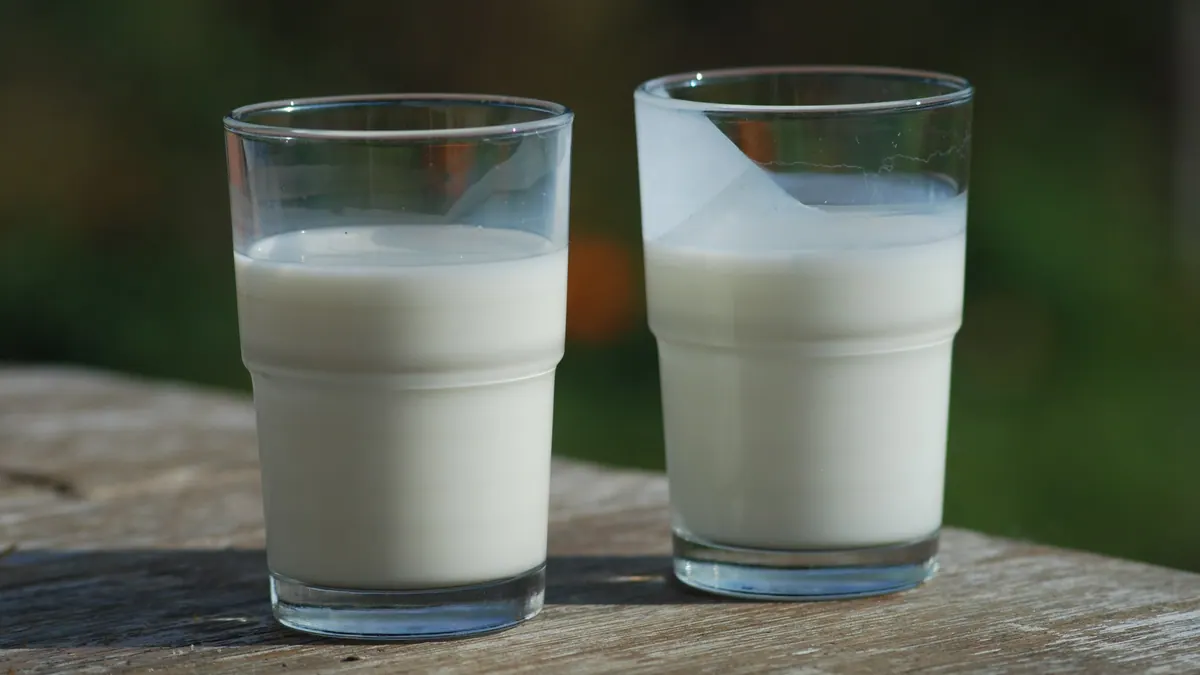
Milk and buttermilk — BMP: 5 studies, weighted mean 522 m³ CH₄/t VS
522 m³ CH₄/t VS weighted mean from 5 studies
neutral — editorial rating for biogas plants≈66 %
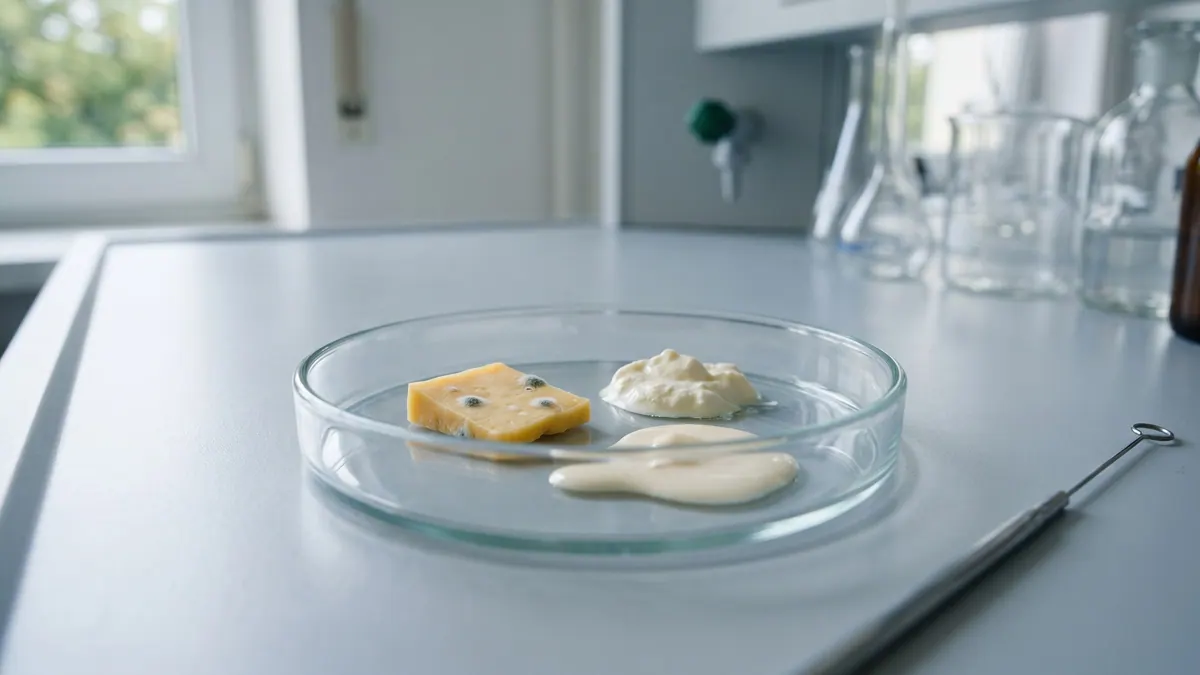
Dairy product waste (cheese, cream, ice cream) — BMP: 5 studies, weighted mean 504 m³ CH₄/t VS
504 m³ CH₄/t VS weighted mean from 5 studies
neutral — editorial rating for biogas plants≈66 %