

BMP testingStraws and crop residues
Beet leaves and tops — BMP: 18 studies, weighted mean 308 m³ CH₄/t VS
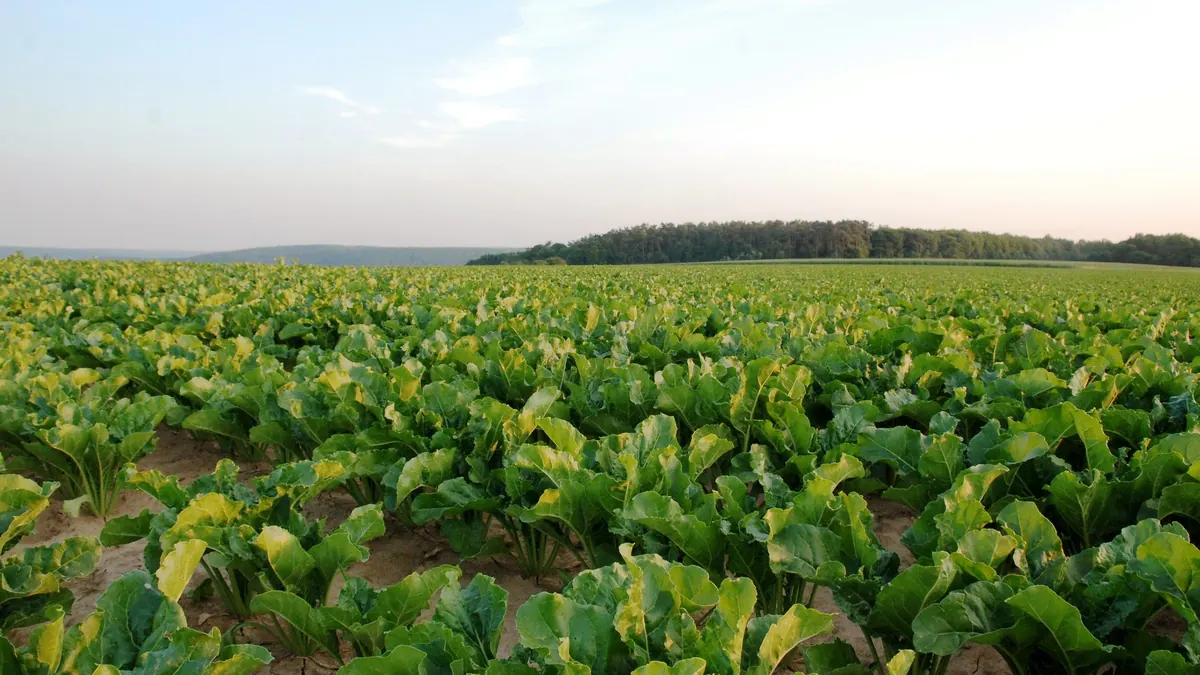
Beet leaves and crowns are post-harvest residues with a high moisture content and good digestibility, available in autumn. They are often contaminated with soil, which affects digester operation.
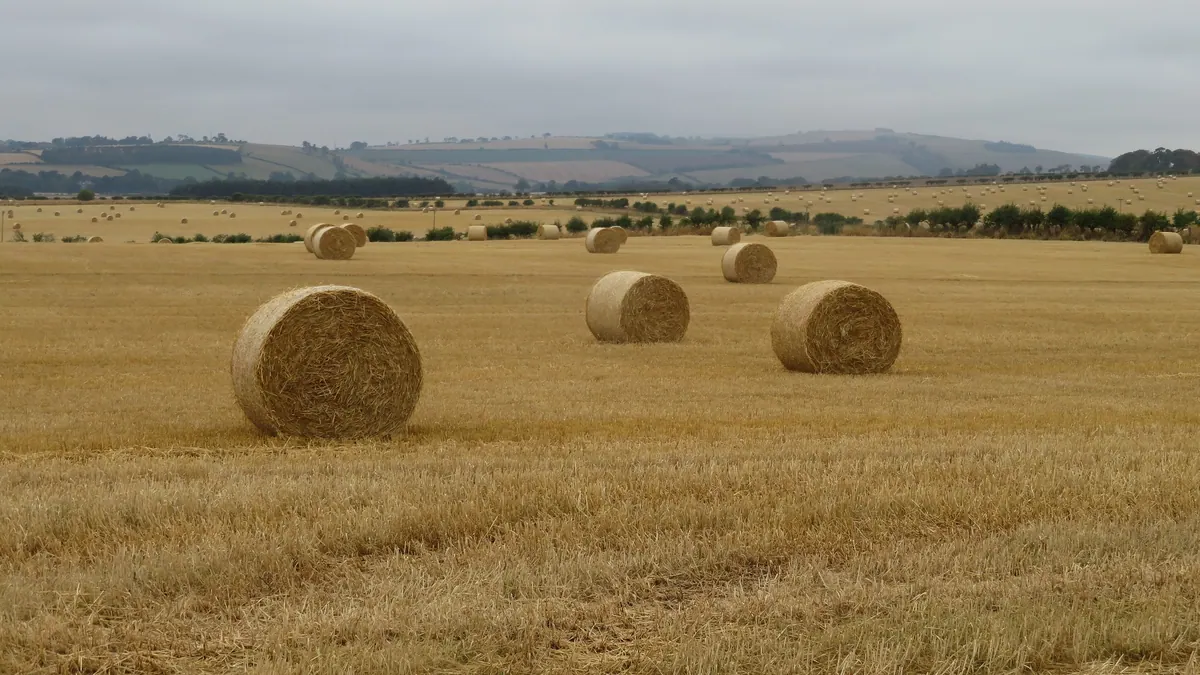
Photo Gilles San Martin from Namur, Belgium / Wikimedia Commons, licence CC BY-SA 2.0, source file; changes: cropping

- Weighted mean
- 308m³ CH₄/t VS
- Range
- 210–470m³ CH₄/t VS
- Records
- 18studies
- Publications
- 7sources
- Temperatures
- 35 °C, 37 °C, 38 °Cof the test
Methane in biogas
High methane content · ≈ 6.8 kWh/m³ of biogas
measured mean of 2 studies BMP, range 66.4–68.9 %; in a batch test the CH₄ share tends to be higher than in a plant.
Rating for biogas plants
neutral — editorial rating for biogas plantsNo clear advantages — worth charging a fee for accepting it
Potential per tonne of fresh matter: moderate (39 m³ CH₄/t); process risk: acidification. Handling costs: sand, stones, shells.
Why? Rating factors
Potential per tonne +1
- +1potential 39 m³ CH₄/t fresh matter (BMP 308 × DM 14 % × VS 89.9 %)
Process stability −0.5
- −0.5acidification: rapid degradation / acidic pH, risk of VFA accumulation, needs buffering
Handling and costs −0.5
- −0.5sand, stones, shells — sediment in the digester
Total points: 0 · thresholds: ≥ 2.5 very good, ≥ 1 good, below — neutral; negative with cumulative process risk.
Add to the co-digestion calculator CSV data
BMP curves from 18 studies
Weighted mean Individual records
Dashed lines are a model curve (first-order kinetics, B(t) = B₀·(1 − e−kt)); the end point comes from the publication. All curves are model curves.
Cumulative methane production over the test [m³ CH₄/t VS]. The thick line is the weighted mean of all records (308); dots mark the end values given in the publications. Point at the chart to read values; click a legend item to hide or show a record.
Show the remaining records in the legend (6)
Records and sources
Download CSV| Source | BMP m³ CH₄/t VS | CH₄ in biogas % vol., measured | Temperature | Sample | Curve |
|---|---|---|---|---|---|
| Amon et al. (2007) DOI | 210 | — | 38 °C · mesophilic | sugar beat Leaves | end point (model curve) |
| Lehtomaki (2005) · 1 | 310 | — | 35 °C · mesophilic | Sugar beet (tops) | end point (model curve) |
| Lehtomaki (2005) · 2 | 360 | — | 35 °C · mesophilic | Sugar beet (tops) | end point (model curve) |
| Lehtomaki (2005) · 3 | 430 | — | 35 °C · mesophilic | Sugar beet (tops) | end point (model curve) |
| Lehtomaki (2005) · 4 | 470 | — | 35 °C · mesophilic | Sugar beet (tops) | end point (model curve) |
| Lehtomaki (2006) | 340 | — | 35 °C · mesophilic | Sugar beet (tops (residue)) | end point (model curve) |
| Lehtomaki (2004) | 310 | — | 35 °C · mesophilic | Sugar beet (tops) | end point (model curve) |
| Zubr (1986) · 1 DOI | 360 | 66.4 % | 35 °C · mesophilic | Sugar beet | end point (model curve) |
| Zubr (1986) · 2 DOI | 381 | 68.9 % | 35 °C · mesophilic | Sugar beet · pretreatment: Silage: Air tight glass jars , fermented 30-40 days at 20 oC. | end point (model curve) |
| Gunaseelan (2004) DOI | 231 | — | 35 °C · mesophilic | garden Beet Leaves | end point (model curve) |
| Kaiser (2007) · 1 | 216 | — | 37 °C · mesophilic | Beets leafs silage | end point (model curve) |
| Kaiser (2007) · 2 | 268 | — | 37 °C · mesophilic | Beets leafs silage | end point (model curve) |
| Kaiser (2007) · 3 | 292 | — | 37 °C · mesophilic | Beets leafs silage | end point (model curve) |
| Kaiser (2007) · 4 | 296 | — | 37 °C · mesophilic | Beets leafs silage | end point (model curve) |
| Kaiser (2007) · 5 | 298 | — | 37 °C · mesophilic | Beets leafs silage | end point (model curve) |
| Kaiser (2007) · 6 | 328 | — | 37 °C · mesophilic | Beets leafs silage | end point (model curve) |
| Kaiser (2007) · 7 | 344 | — | 37 °C · mesophilic | Beets leafs silage | end point (model curve) |
| Kaiser (2007) · 8 | 355 | — | 37 °C · mesophilic | Beets leafs silage | end point (model curve) |
| Weighted mean | 308 | 67.7 % | arithmetic mean 322, SD 68 | ||
Typical composition
- Dry matter (DM)
- 14% (range 8.4–30.5)
- Volatile solids (VS)
- 89.9 % DM (range 73.6–94.9)
- Nitrogen
- 2.8 % DM
- C/N ratio
- 17
Median and range of the determinations reported in the publications behind this substrate's BMP records (read from: CROPGEN D4, MY-D); dry matter: 15 determinations, volatile solids: 10 determinations.
Sources: Lehtomaki (2005); Lehtomaki (2006); Lehtomaki (2004); Zubr (1986); Gunaseelan (2004); Kaiser (2007).
The composition of the raw material varies between batches — for plant calculations use an analysis of your own sample. The calculator inserts typical values automatically.
Process properties
Advantages
- Methane potential in the database: weighted mean 308 m³ CH₄/t VS (median 319; range 210-470; 18 records from 7 sources).
- Can be ensiled (Lehtomäki 2004, 2006) and stored out of season.
Drawbacks and risks
- Rapid degradation of soluble sugars may acidify the system (review by Chen 2008).
- Spread of results in the database: standard deviation 68 at a mean of 322 m³ CH₄/t VS (18 records from 7 sources).
Co-digestion — what to combine it with, what to watch out for
- combines well
substrates: high alkalinity (buffer) — e.g. Cattle manure, Pig slurry, Cattle slurry, Duck slurry, Rumen and digestive tract content
Slurry buffers acidification from easily degradable leaves.[1][2]
- caution
Beet roots (sugar/fodder beet)
Beet roots and leaves together increase the load of easily degradable carbon: risk of acidification.[3][4]
Dosing
No source dose limits; gradual dosing and VFA monitoring are recommended. Ensiling results are described in Lehtomäki 2004 and 2006.
Introduce gradually, starting with a small dose and monitoring the process (e.g. FOS/TAC, pH, gas composition).
Practical requirements
- Provide for removal of sand and heavy contaminants: sand is often strongly bound to organic matter and is released only in the digester, and sediments reduce its usable capacity, so a scraper or bottom drain is needed (FNR 2010, Ch. 3).
- Ensiling makes it possible to store seasonal biomass; properly ensiled plants (in the study maize, sorghum, forage rye, triticale) can be stored for up to a year without loss of methane production (Herrmann et al. 2011).
Sources of the process data
- Weiland, P. (2010) Biogas production: current state and perspectives. Applied Microbiology and Biotechnology
- Amon, T.; Amon, B.; Kryvoruchko, V.; Machmüller, A.; Hopfner-Sixt, K.; Bodiroza, V.; Hrbek, R.; Friedel, J.; Pötsch, E.; Wagentristl, H.; Schreiner, M.; Zollitsch, W. (2007) Methane production through anaerobic digestion of various energy crops grown in sustainable crop rotations. Bioresource Technology 98(17), 3204–3212
- Kaiser, F.L. (2007) Einfluss der stofflichen Zusammensetzung auf die Verdaulichkeit nachwachsender Rohstoffe beim anaeroben Abbau in Biogasreaktoren. Dissertation, Technische Universität München, Wissenschaftszentrum Weihenstephan
- Chen, Y.; Cheng, J.J.; Creamer, K.S. (2008) Inhibition of anaerobic digestion process: A review. Bioresource Technology
- Lehtomaki, A. Ronkainen, O.M. Rintala, J.A. (2005) Developing storage methods for optimised methane production from energy crops in northern conditions. ADSW 2005 Conference Proceedings Vol 1. 101-108
- Lehtomaki, A. Viinikainen, T.A. Rintala, J.A (2006) Screening boreal energy crops and crop residues for methane biofuel production. Submitted to Biomass and Bioenergy
- Lehtomaki, A. Viinikainen, T.A. Ronkainen, O.M. Alen, R. Rintala, J.A. (2004) Effect of pretreatments on methane production potential of energy crops and crop residues. Proceedings Anaerobic Digestion Conference 1016-1021
- Zubr, J. (1986) Methanogenic fermentation of fresh and ensiled plant materials. Biomass 11(3), 159–171
- Gunaseelan, V. (2004) Biochemical methane potential of fruits and vegetable solid waste feedstocks. Biomass and Bioenergy 26(4), 389–399
- FNR (2010). Guía sobre el Biogás – Desde la producción hasta el uso (hiszp. wydanie „Leitfaden Biogas”, GIZ 2013)
- Herrmann et al. (2011). Effects of ensiling, silage additives and storage period on methane formation of biogas crops. Bioresour. Technol.
The co-digestion calculator will assess a specific mixture containing this substrate.
What it is and where it comes from
Beet leaves are the above-ground part of the sugar or fodder beet: the leaf blades with their petioles, plus the so-called crowns, that is, the upper part of the root cut off during harvest. Traditionally they stay in the field as a post-harvest residue or are sometimes fed to livestock. In a biogas plant they can be used if they can be collected separately, which requires suitable equipment. In the dataset the records come from several studies and include both leaves alone and leaves with crowns.
Properties relevant to digestion
The material has a very high water content and low dry matter, and the organic matter is readily digestible and rich in easily available compounds. At the same time it contains a lot of ash and potassium and, especially with mechanical harvesting, considerable amounts of soil. Sand and soil settle at the bottom of the digester and in pipelines, increase the abrasion of pumps and shorten the working life of agitators. High moisture means rapid decomposition after harvest, and in unensiled clamps there are energy losses and unpleasant odours. Too large a share in the feed requires process monitoring, including the concentration of volatile fatty acids.
How to read the spread of results
The dataset includes records from different years, harvest dates and varieties, as well as from studies in which leaves, leaves with crowns and residues were described under different names. The result per gram of volatile solids changes with the share of crowns (richer in sugar), plant maturity and the degree of soiling. The way the sample was stored also matters: fresh, frozen or ensiled. Differences in the substrate-to-inoculum ratio and in temperature (mainly mesophilic conditions) add a further layer of variability.
In biogas plant practice
Beet leaves are best ensiled, preferably together with a drier material, which limits juice leachate. Before feeding, as much soil as possible must be separated, and the feeding system should allow sediments to be removed from the bottom of the tank. The share in the mix should be moderate, and monitoring covers pH, volatile fatty acids and potassium. Availability is limited to autumn and requires logistics, so this substrate is usually a supplement in areas of intensive beet growing, not the basis of the feed. When taking delivery from farmers, check whether it falls within the catalogue of substrates for which the biogas plant holds consent.
Methodology in brief
BMP is the amount of methane obtained from volatile solids (VS) in a batch test, given in m³ CH₄ per tonne of VS (numerically the same as NmL CH₄/g VS in the publications) and converted to normal conditions (0 °C, 101.325 kPa). The weighted mean gives each publication a total weight of 1, split equally between its results for the substrate — a paper testing twenty varieties does not outweigh a paper with a single sample. In inter-laboratory programmes the unit is the laboratory (total weight 1), and within it the weight of a test grows with the number of bottles (replicates). Results after pretreatment (e.g. thermal, chemical, enzymatic) are shown separately and are not included in the mean.
Solid lines are curves measured in the tests. Where a publication gives only the final result, we draw a first-order kinetic model, B(t) = B₀·(1 − e−kt): only the end point comes from the publication, and the shape of the curve serves purely as visualisation — do not read the production on a particular day from it. For this substrate k = 0.136 d−1 was assumed (median of rate constants k reported in the sources and/or fitted to the mean measured curves).
The statistics describe the spread of published results — a descriptive compilation, not a meta-analysis or a guarantee of plant yield.
Results after pretreatment (38) — excluded from the mean
| Source | BMP m³ CH₄/t VS | Pretreatment | Sample |
|---|---|---|---|
| Lehtomaki (2005) | 440 | — | Sugar beet (tops) |
| Lehtomaki (2005) | 410 | — | Sugar beet (tops) |
| Lehtomaki (2005) | 250 | — | Sugar beet (tops) |
| Lehtomaki (2005) | 380 | — | Sugar beet (tops) |
| Lehtomaki (2005) | 510 | — | Sugar beet (tops) |
| Lehtomaki (2005) | 450 | — | Sugar beet (tops) |
| Lehtomaki (2004) | 250 | — | Sugar beet (tops) |
| Lehtomaki (2004) | 260 | — | Sugar beet (tops) |
| Lehtomaki (2004) | 220 | — | Sugar beet (tops) |
| Lehtomaki (2004) | 110 | — | Sugar beet (tops) |
| Lehtomaki (2004) | 180 | — | Sugar beet (tops) |
| Lehtomaki (2004) | 200 | — | Sugar beet (tops) |
| Lehtomaki (2004) | 230 | — | Sugar beet (tops) |
| Lehtomaki (2004) | 190 | — | Sugar beet (tops) |
| Lehtomaki (2004) | 140 | — | Sugar beet (tops) |
| Lehtomaki (2004) | 280 | — | Sugar beet (tops) |
| Lehtomaki (2004) | 340 | — | Sugar beet (tops) |
| Lehtomaki (2004) | 190 | — | Sugar beet (tops) |
| Lehtomaki (2004) | 270 | — | Sugar beet (tops) |
| Lehtomaki (2004) | 160 | — | Sugar beet (tops) |
| Lehtomaki (2004) | 230 | — | Sugar beet (tops) |
| Lehtomaki (2004) | 190 | — | Sugar beet (tops) |
| Lehtomaki (2004) | 260 | — | Sugar beet (tops) |
| Lehtomaki (2004) | 130 | — | Sugar beet (tops) |
| Lehtomaki (2004) | 250 | — | Sugar beet (tops) |
| Lehtomaki (2004) | 180 | — | Sugar beet (tops) |
| Lehtomaki (2004) | 240 | — | Sugar beet (tops) |
| Lehtomaki (2004) | 150 | — | Sugar beet (tops) |
| Lehtomaki (2005) | 290 | — | Sugar beet (tops) |
| Lehtomaki (2005) | 330 | — | Sugar beet (tops) |
| Lehtomaki (2005) | 520 | — | Sugar beet (tops) |
| Lehtomaki (2005) | 370 | — | Sugar beet (tops) |
| Lehtomaki (2005) | 280 | — | Sugar beet (tops) |
| Lehtomaki (2005) | 380 | — | Sugar beet (tops) |
| Lehtomaki (2005) | 430 | — | Sugar beet (tops) |
| Lehtomaki (2005) | 360 | — | Sugar beet (tops) |
| Lehtomaki (2005) | 270 | — | Sugar beet (tops) |
| Lehtomaki (2005) | 320 | — | Sugar beet (tops) |
Bibliography
- Amon, T.; Amon, B.; Kryvoruchko, V.; Machmüller, A.; Hopfner-Sixt, K.; Bodiroza, V.; Hrbek, R.; Friedel, J.; Pötsch, E.; Wagentristl, H.; Schreiner, M.; Zollitsch, W. (2007). Methane production through anaerobic digestion of various energy crops grown in sustainable crop rotations. Bioresource Technology 98(17), 3204–3212. DOI: 10.1016/j.biortech.2006.07.007 DOI
- Lehtomaki, A. Ronkainen, O.M. Rintala, J.A. (2005). Developing storage methods for optimised methane production from energy crops in northern conditions. ADSW 2005 Conference Proceedings Vol 1. 101-108.
- Lehtomaki, A. Viinikainen, T.A. Rintala, J.A (2006). Screening boreal energy crops and crop residues for methane biofuel production. Submitted to Biomass and Bioenergy.
- Lehtomaki, A. Viinikainen, T.A. Ronkainen, O.M. Alen, R. Rintala, J.A. (2004). Effect of pretreatments on methane production potential of energy crops and crop residues. Proceedings Anaerobic Digestion Conference 1016-1021.
- Zubr, J. (1986). Methanogenic fermentation of fresh and ensiled plant materials. Biomass 11(3), 159–171. DOI: 10.1016/0144-4565(86)90064-8 DOI
- Gunaseelan, V. (2004). Biochemical methane potential of fruits and vegetable solid waste feedstocks. Biomass and Bioenergy 26(4), 389–399. DOI: 10.1016/j.biombioe.2003.08.006 DOI
- Kaiser, F.L. (2007). Einfluss der stofflichen Zusammensetzung auf die Verdaulichkeit nachwachsender Rohstoffe beim anaeroben Abbau in Biogasreaktoren. Dissertation, Technische Universität München, Wissenschaftszentrum Weihenstephan. https://mediatum.ub.tum.de/631394 source
All sources of the site: bibliography.
Other substrates in the group “Straws and crop residues”
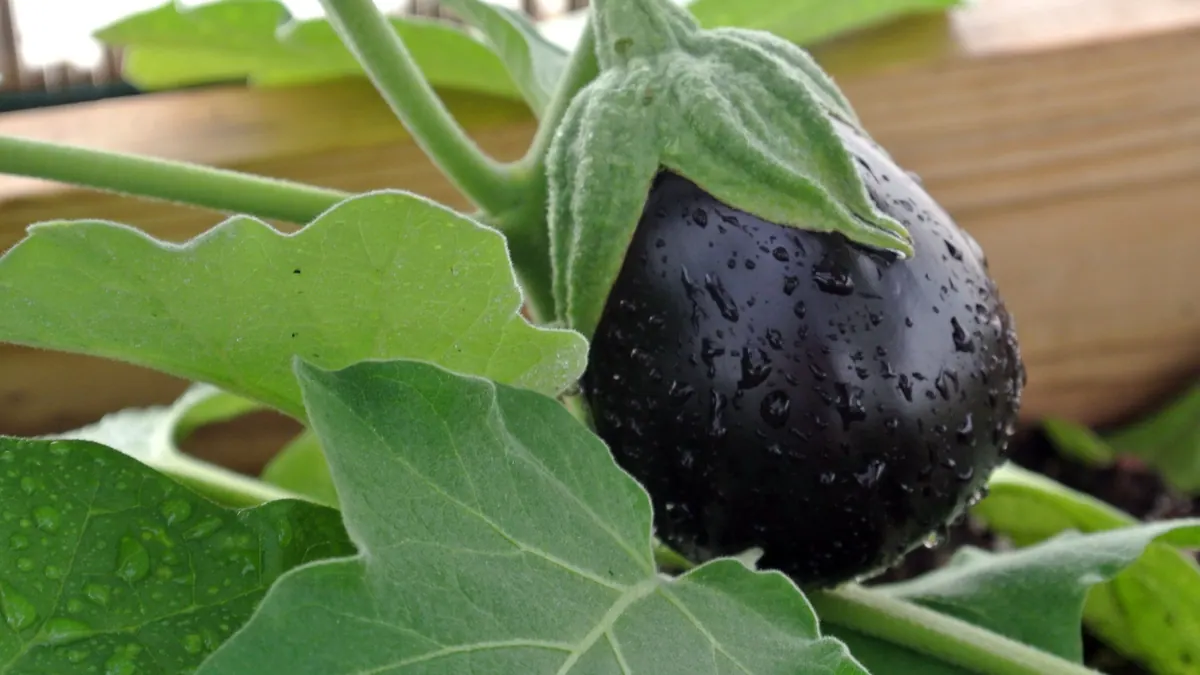
Eggplant stalks and leaves — BMP: 4 studies, weighted mean 218 m³ CH₄/t VS
218 m³ CH₄/t VS weighted mean from 4 studies
56 %
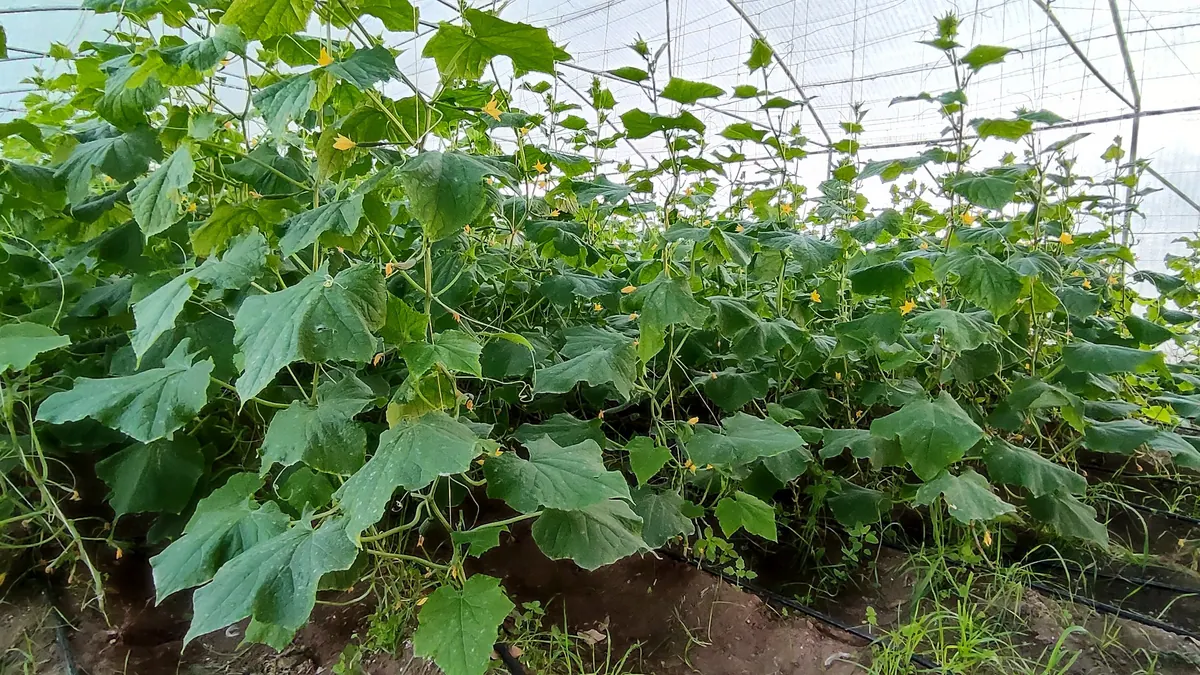
Cucumber leaves and stems — BMP: 6 studies, weighted mean 237 m³ CH₄/t VS
237 m³ CH₄/t VS weighted mean from 6 studies
60 %
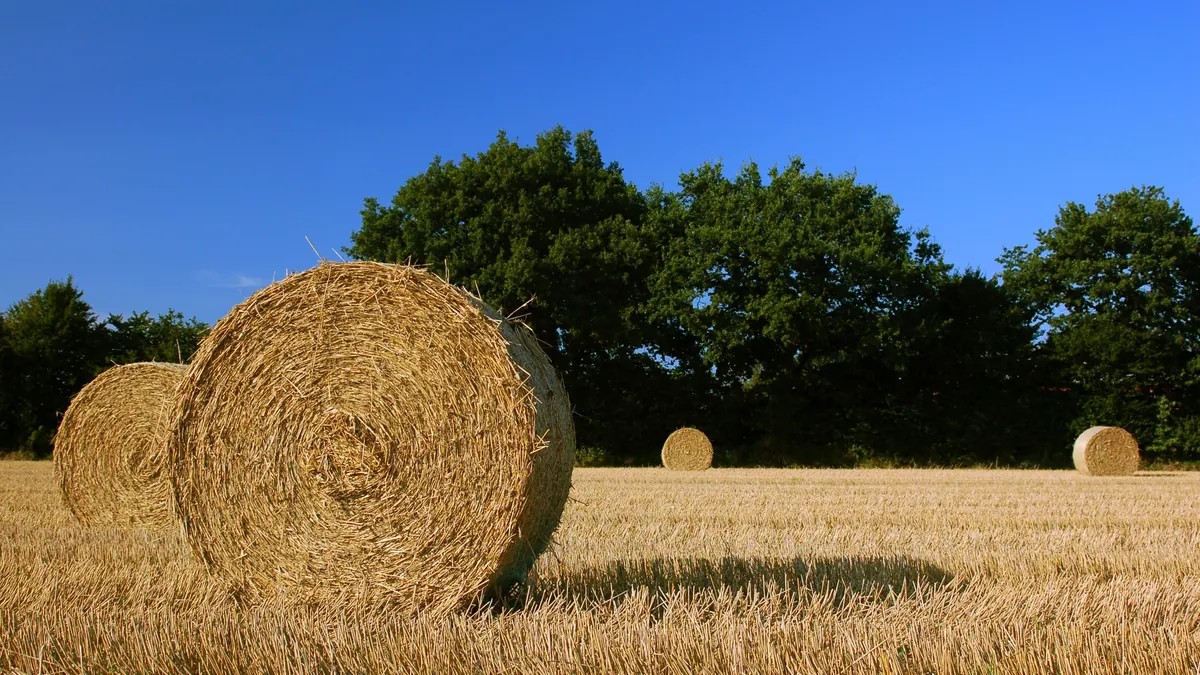
Cereal straw (unspecified) — BMP: 25 studies, weighted mean 268 m³ CH₄/t VS
268 m³ CH₄/t VS weighted mean from 25 studies
good — editorial rating for biogas plants≈51 %
Barley straw — BMP: 8 studies, weighted mean 238 m³ CH₄/t VS
238 m³ CH₄/t VS weighted mean from 8 studies
good — editorial rating for biogas plants≈52 %