

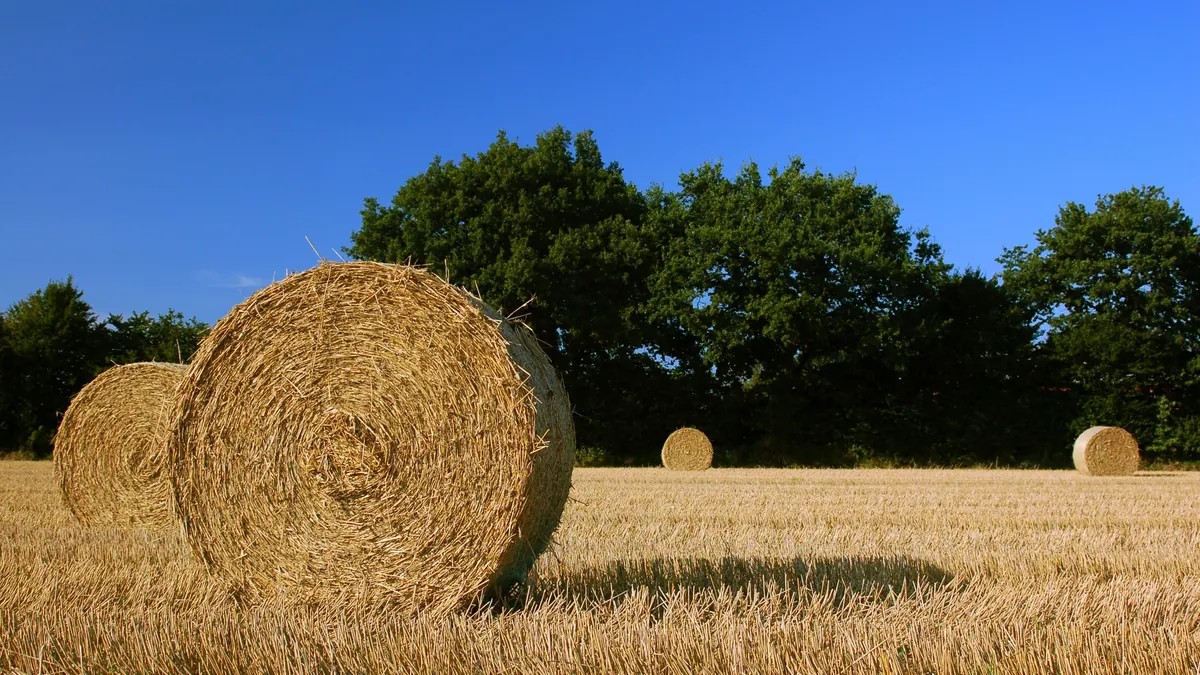
BMP testingStraws and crop residues
Cereal straw (unspecified) — BMP: 25 studies, weighted mean 268 m³ CH₄/t VS
Cereal straw without a specified species is a collective category from publications that did not state the cereal. It describes a typical lignocellulosic material, but with greater uncertainty than species-specific straws.
rating: goodCH₄ ≈ 51 % (estimate)
Photo Jan van der Crabben (Photographer) / Wikimedia Commons, licence CC BY-SA 2.0, source file; changes: cropping

- Weighted mean
- 268m³ CH₄/t VS
- Range
- 183–333m³ CH₄/t VS
- Records
- 25studies
- Publications
- 4sources
- Temperatures
- 37 °C, 38 °Cof the test
Methane in biogas
Low methane content · ≈ 5.1 kWh/m³ of biogas
estimate from the substrate type The collected studies contain no measurement. The interval follows from the approximate composition (protein from total nitrogen (N 0.4 % DM × 6.25)) and the yields of compound groups according to FNR.
Rating for biogas plants
good — editorial rating for biogas plantsStable, usually accepted without a fee
Potential per tonne of fresh matter: very high (220 m³ CH₄/t); no particular threats to stability. Handling costs: fibres, floating layer, slow degradation.
Why? Rating factors
Potential per tonne +3
- +3potential 220 m³ CH₄/t fresh matter (BMP 268 × DM 87.4 % × VS 94.1 %)
Process stability 0
- 0no factors
Handling and costs −1
- −0.5fibres, floating layer — shredding and intensive mixing
- −0.5slow degradation — long retention time
Total points: 2 · thresholds: ≥ 2.5 very good, ≥ 1 good, below — neutral; negative with cumulative process risk.
Add to the co-digestion calculator CSV data
BMP curves from 25 studies
Weighted mean Individual records
Dashed lines are a model curve (first-order kinetics, B(t) = B₀·(1 − e−kt)); the end point comes from the publication. All curves are model curves.
Cumulative methane production over the test [m³ CH₄/t VS]. The thick line is the weighted mean of all records (268); dots mark the end values given in the publications. Point at the chart to read values; click a legend item to hide or show a record.
Show the remaining records in the legend (13)
Records and sources
Download CSV| Source | BMP m³ CH₄/t VS | Temperature | Sample | Curve |
|---|---|---|---|---|
| Lallement et al. (2021) · 1 DOI | 253 | 38 °C · mesophilic | straw (inoculum 2) | end point (model curve) |
| Lallement et al. (2021) · 2 DOI | 333 | 38 °C · mesophilic | straw (inoculum 1) | end point (model curve) |
| Lallement et al. (2023) · 1 DOI | 200 | 38 °C · mesophilic | straw | end point (model curve) |
| Lallement et al. (2023) · 2 DOI | 240 | 38 °C · mesophilic | straw | end point (model curve) |
| Lallement et al. (2023) · 3 DOI | 267 | 38 °C · mesophilic | straw waste | end point (model curve) |
| Lallement et al. (2023) · 4 DOI | 274 | 38 °C · mesophilic | straw | end point (model curve) |
| Lallement et al. (2023) · 5 DOI | 278 | 38 °C · mesophilic | straw plant residues | end point (model curve) |
| Lallement et al. (2023) · 6 DOI | 280 | 38 °C · mesophilic | straw plant residues | end point (model curve) |
| Lallement et al. (2023) · 7 DOI | 284 | 38 °C · mesophilic | straw waste | end point (model curve) |
| Lallement et al. (2023) · 8 DOI | 291 | 38 °C · mesophilic | straw | end point (model curve) |
| Lallement et al. (2023) · 9 DOI | 293 | 38 °C · mesophilic | straw plant residues | end point (model curve) |
| Lallement et al. (2023) · 10 DOI | 294 | 38 °C · mesophilic | straw waste | end point (model curve) |
| Lallement et al. (2023) · 11 DOI | 299 | 38 °C · mesophilic | straw plant residues | end point (model curve) |
| Lallement et al. (2023) · 12 DOI | 302 | 38 °C · mesophilic | straw | end point (model curve) |
| Lallement et al. (2023) · 13 DOI | 306 | 38 °C · mesophilic | straw | end point (model curve) |
| Lallement et al. (2023) · 14 DOI | 310 | 38 °C · mesophilic | straw | end point (model curve) |
| Lallement et al. (2023) · 15 DOI | 330 | 38 °C · mesophilic | straw waste | end point (model curve) |
| Mönch-Tegeder et al. (2013) · 1 | 183 | 37 °C · mesophilic | Straw - horse bedding material | end point (model curve) |
| Mönch-Tegeder et al. (2013) · 2 | 200 | 37 °C · mesophilic | Straw - horse bedding material | end point (model curve) |
| Mönch-Tegeder et al. (2013) · 3 | 203 | 37 °C · mesophilic | Straw - horse bedding material | end point (model curve) |
| Mönch-Tegeder et al. (2013) · 4 | 214 | 37 °C · mesophilic | Straw - horse bedding material | end point (model curve) |
| Mönch-Tegeder et al. (2013) · 5 | 237 | 37 °C · mesophilic | Straw - horse bedding material | end point (model curve) |
| Mönch-Tegeder et al. (2013) · 6 | 247 | 37 °C · mesophilic | Straw-pellets as horse bedding material | end point (model curve) |
| Gievers et al. (2024) · 1 DOI | 274 | — | Straw (average of 7 samples: 6 wheat, 1 barley) | end point (model curve) |
| Gievers et al. (2024) · 2 DOI | 286 | — | Straw pellets (average) | end point (model curve) |
| Weighted mean | 268 | arithmetic mean 267, SD 42 | ||
Typical composition
- Dry matter (DM)
- 87.4% (range 54–91)
- Volatile solids (VS)
- 94.1 % DM (range 88–97)
- Nitrogen
- 0.4 % DM
- C/N ratio
- 107.2
Median and range of the determinations reported in the publications behind this substrate's BMP records (read from: MY-D); dry matter: 20 determinations, volatile solids: 12 determinations. C/N was calculated as the ratio of C and N content (% DM) from the same source. The DM range includes fresh samples as well as samples partly dried or dried before the test – for fresh material the lower part of the range applies, ideally your own measurement.
Sources: Lallement et al. (2023); Mönch-Tegeder et al. (2013).
The composition of the raw material varies between batches — for plant calculations use an analysis of your own sample. The calculator inserts typical values automatically.
Process properties
Advantages
- Methane potential in the database: weighted mean 268 m³ CH₄/t VS (median 278; range 183–333; 25 records from 4 sources).
- Pelletising straw improves dosing and storage (Gievers 2024).
Drawbacks and risks
- The method of preservation and the origin of the inoculum affect the result (Lallement 2021).
Co-digestion — what to combine it with, what to watch out for
- combines well
Where the type of straw is known, it is better to use the specific entry.[1]
Dosing
No source-based dose limits; properties and dosing are described for straw pellets (Gievers 2024).
Practical requirements
- Shred: shredding increases the surface available for degradation and speeds it up, but does not necessarily raise the final gas yield (FNR 2010, Ch. 3 “Triturado”).
Sources of the process data
- Lallement, A.; Peyrelasse, C.; Lagnet, C.; Barakat, A.; Schraauwers, B.; Maunas, S.; Monlau, F. (2023) A Detailed Database of the Chemical Properties and Methane Potential of Biomasses Covering a Large Range of Common Agricultural Biogas Plant Feedstocks. Waste 1(1), 195–227
- Lallement, A.; Siaud, A.; Peyrelasse, C.; Kaparaju, P.; Schraauwers, B.; Maunas, S.; Monlau, F. (2021) Impact of Operational Factors, Inoculum Origin, and Feedstock Preservation on the Biochemical Methane Potential. Bioengineering 8(11), 176
- Hendriks, A.T.W.M.; Zeeman, G. (2009) Pretreatments to enhance the digestibility of lignocellulosic biomass. Bioresource Technology
- Mönch-Tegeder, M.; Lemmer, A.; Oechsner, H.; Jungbluth, T. (2013) Investigation of the methane potential of horse manure. Agricultural Engineering International: CIGR Journal 15(2)
- Gievers, F.; Walz, M.; Loewe, K.; Loewen, A. (2024) Pelletized Straw for Biogas Production—Substrate Characterization and Methane Formation Potential. Processes 12(8), 1549
- Weiland, P. (2010) Biogas production: current state and perspectives. Applied Microbiology and Biotechnology
- FNR (2010). Guía sobre el Biogás – Desde la producción hasta el uso (hiszp. wydanie „Leitfaden Biogas”, GIZ 2013)
The co-digestion calculator will assess a specific mixture containing this substrate.
What it is and where it comes from
The category "cereal straw (species unspecified)" collects results from publications in which simply "straw" was studied and it was not stated which cereal it came from. In practice it is most often wheat, barley or rye straw, i.e. the material available after the threshing of all cereals. Straw is the largest stream of agricultural residues in Poland by mass, but its use is limited by competition: bedding, fodder, fuel and the cycling of organic matter in the soil.
Properties relevant to digestion
The shared characteristics of cereal straws are a high dry matter content, a large share of cellulose, hemicelluloses and lignin, and a very low protein content, and hence a wide C/N ratio. The waxy coating and silica in the epidermis hinder wetting and colonisation by microorganisms. In the digester straw tends to float and form scum, and its hydrolysis is the rate-limiting step of the process. Chopping improves availability, and co-digestion with slurry contributes nitrogen, trace elements and buffer. Straw stored in damp conditions loses value through the growth of mould and aerobic decomposition.
How to read the spread of results
The collective category means that the records may come from different species, varieties and years. To this are added differences in sample preparation (cutting, milling, drying), in inoculum (the dataset includes inoculum variants from one study) and in the substrate-to-inoculum ratio and test length. The results of some studies come from projects in which straw was only one of many wastes examined, and the description of the sample is brief. For comparisons this category should therefore be treated as a broad picture of the material, not as an exact description of a specific straw.
In biogas plant practice
At agricultural plants straw is sometimes used in a small share, in order to increase dry matter and provide structure, particularly in dry fermentation or in mixtures with liquid excreta. It requires chopping, dry storage and control of contaminants (stones, bale wire, twine). The share is limited by the risk of scum and by the load on the mixing system. With constant deliveries it is worth recording the straw species, because variability between species and crop years is significant, and a BMP test of your own batch gives a more reliable basis for planning than averaged data from the literature.
Methodology in brief
BMP is the amount of methane obtained from volatile solids (VS) in a batch test, given in m³ CH₄ per tonne of VS (numerically the same as NmL CH₄/g VS in the publications) and converted to normal conditions (0 °C, 101.325 kPa). The weighted mean gives each publication a total weight of 1, split equally between its results for the substrate — a paper testing twenty varieties does not outweigh a paper with a single sample. In inter-laboratory programmes the unit is the laboratory (total weight 1), and within it the weight of a test grows with the number of bottles (replicates). Results after pretreatment (e.g. thermal, chemical, enzymatic) are shown separately and are not included in the mean.
Solid lines are curves measured in the tests. Where a publication gives only the final result, we draw a first-order kinetic model, B(t) = B₀·(1 − e−kt): only the end point comes from the publication, and the shape of the curve serves purely as visualisation — do not read the production on a particular day from it. For this substrate k = 0.136 d−1 was assumed (median of rate constants k reported in the sources and/or fitted to the mean measured curves).
The statistics describe the spread of published results — a descriptive compilation, not a meta-analysis or a guarantee of plant yield.
Bibliography
- Lallement, A.; Siaud, A.; Peyrelasse, C.; Kaparaju, P.; Schraauwers, B.; Maunas, S.; Monlau, F. (2021). Impact of Operational Factors, Inoculum Origin, and Feedstock Preservation on the Biochemical Methane Potential. Bioengineering 8(11), 176. DOI: 10.3390/bioengineering8110176 DOI
- Lallement, A.; Peyrelasse, C.; Lagnet, C.; Barakat, A.; Schraauwers, B.; Maunas, S.; Monlau, F. (2023). A Detailed Database of the Chemical Properties and Methane Potential of Biomasses Covering a Large Range of Common Agricultural Biogas Plant Feedstocks. Waste 1(1), 195–227. DOI: 10.3390/waste1010014 DOI
- Mönch-Tegeder, M.; Lemmer, A.; Oechsner, H.; Jungbluth, T. (2013). Investigation of the methane potential of horse manure. Agricultural Engineering International: CIGR Journal 15(2).
- Gievers, F.; Walz, M.; Loewe, K.; Loewen, A. (2024). Pelletized Straw for Biogas Production—Substrate Characterization and Methane Formation Potential. Processes 12(8), 1549. DOI: 10.3390/pr12081549 DOI
All sources of the site: bibliography.
Other substrates in the group “Straws and crop residues”
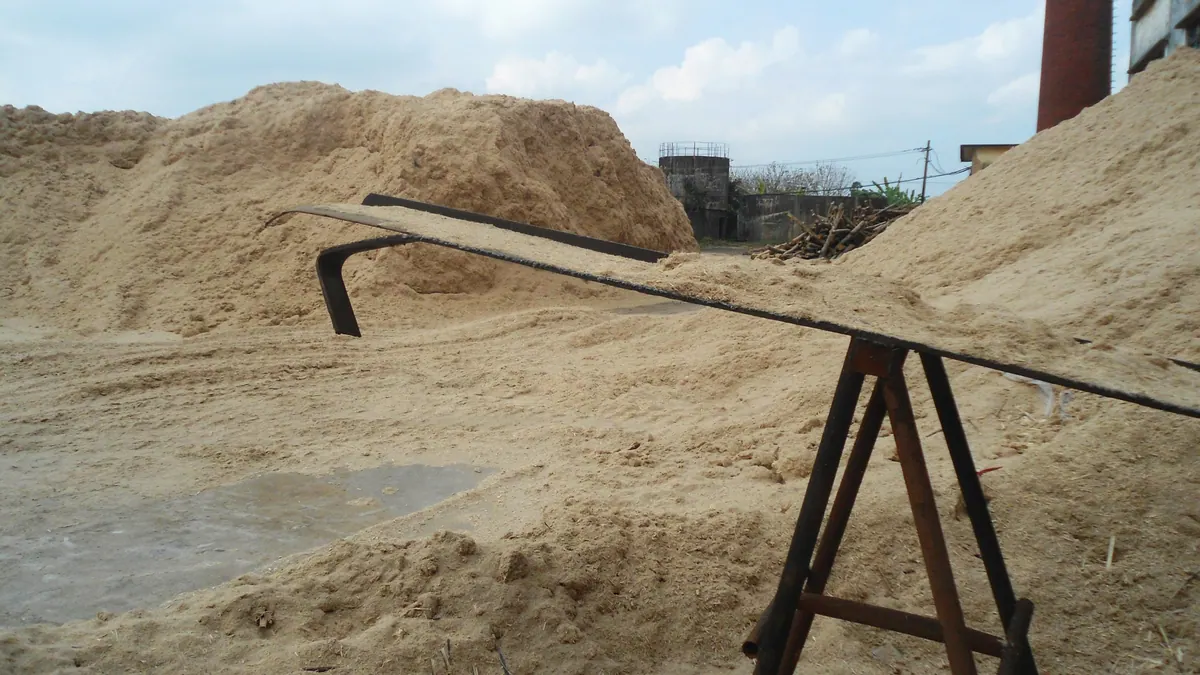
Sugarcane bagasse — BMP: 10 studies, weighted mean 205 m³ CH₄/t VS
205 m³ CH₄/t VS weighted mean from 10 studies
good — editorial rating for biogas plants≈51 %
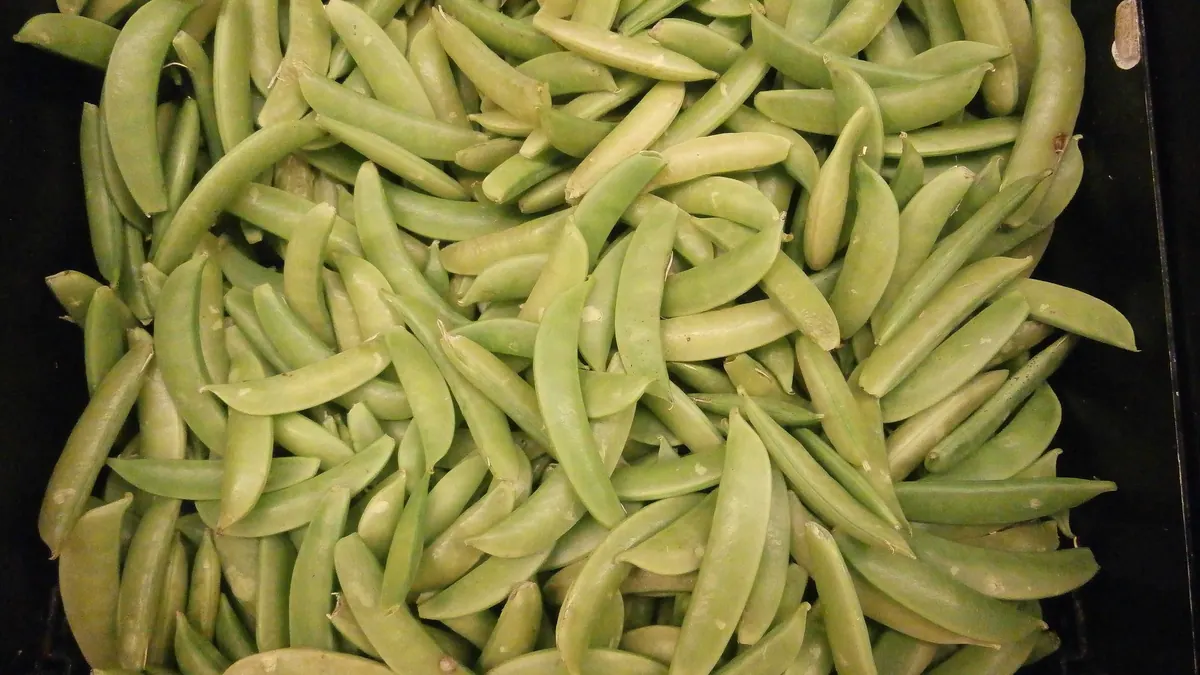
Legume crop and processing residues (pea pods, bean haulm and husks, pea leaves) — BMP: 5 studies, mean 264 m³ CH₄/t VS
264 m³ CH₄/t VS weighted mean from 5 studies
58 %
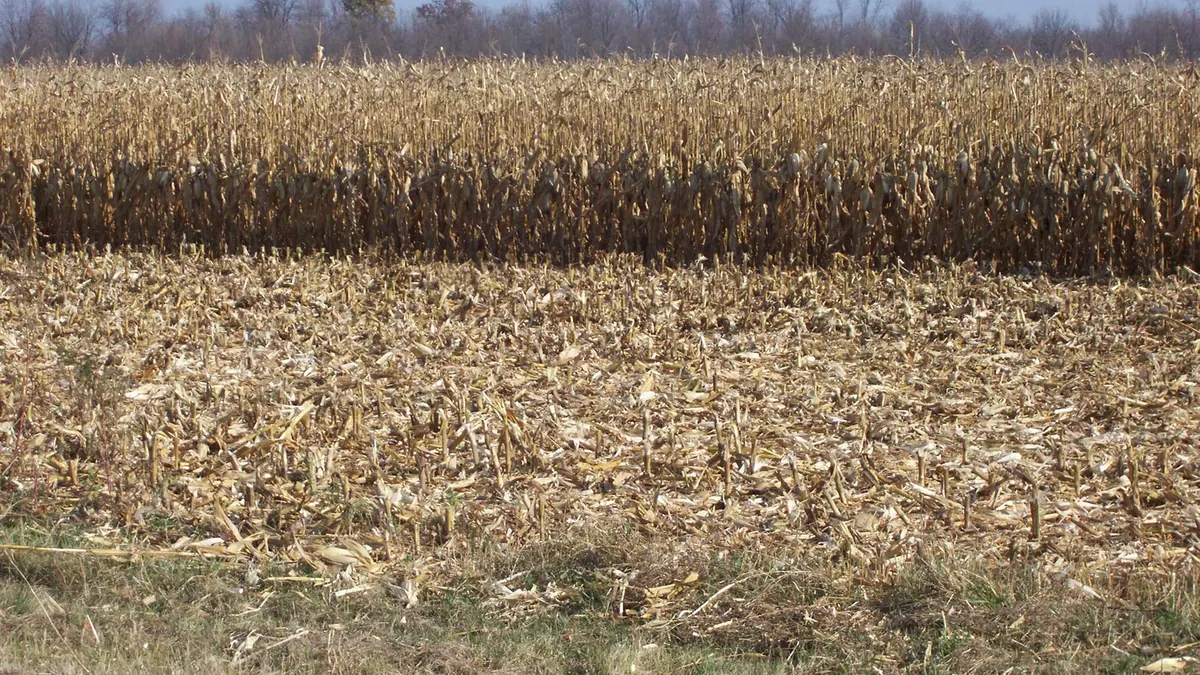
Maize stover — BMP: 10 studies, weighted mean 298 m³ CH₄/t VS
298 m³ CH₄/t VS weighted mean from 10 studies
good — editorial rating for biogas plants≈52 %
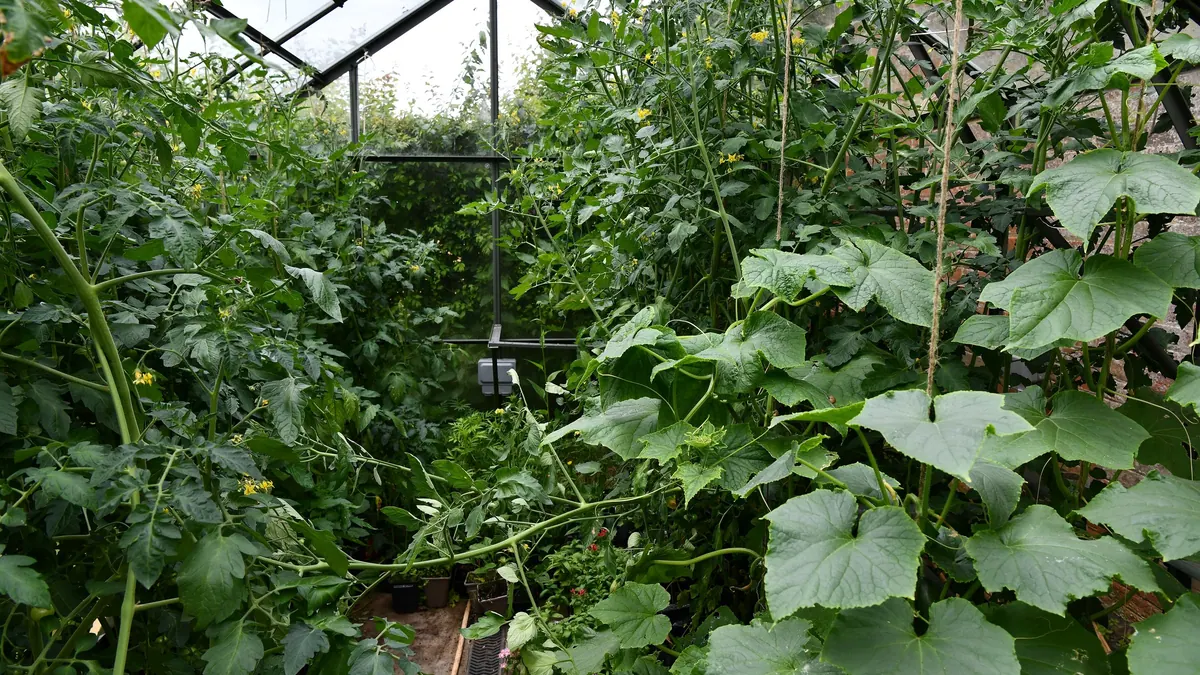
Tomato leaves and stems — BMP: 6 studies, weighted mean 200 m³ CH₄/t VS
200 m³ CH₄/t VS weighted mean from 6 studies
58 %