

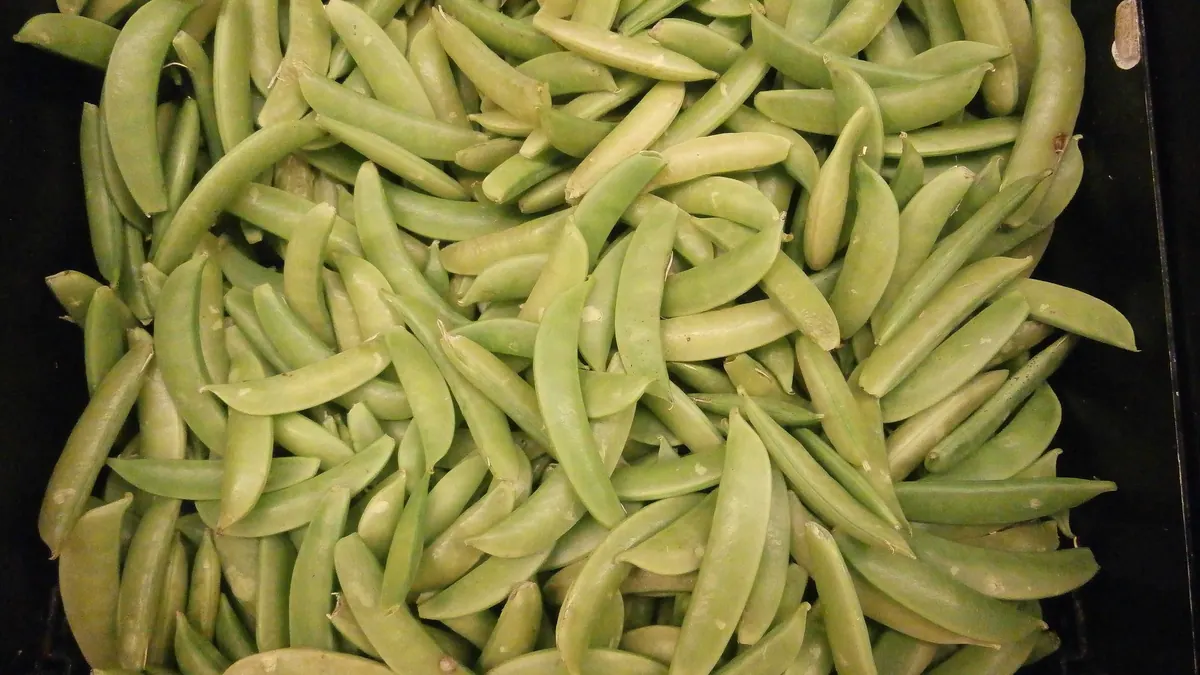
BMP testingStraws and crop residues
Legume crop and processing residues (pea pods, bean haulm and husks, pea leaves) — BMP: 5 studies, mean 264 m³ CH₄/t VS
Legume residues (pea pods, bean haulm and husks, pea leaves) comprise five materials from several studies; the result depends on the part of the plant and its maturity.
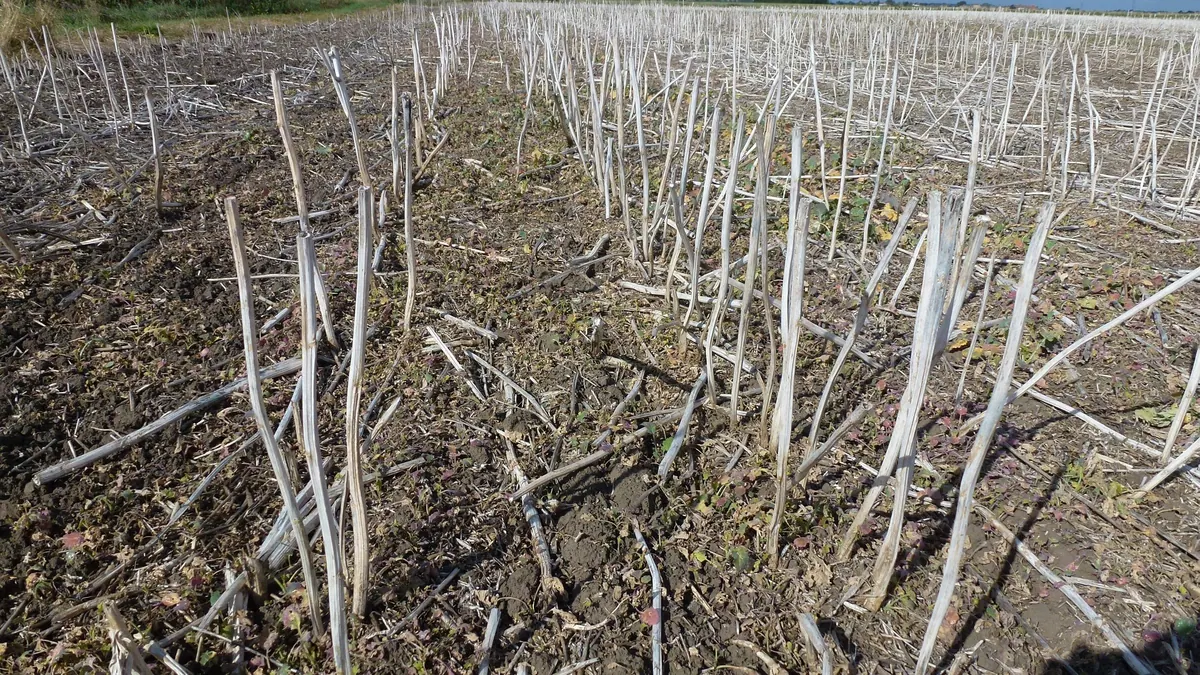
Photo Jeffery Martin / Wikimedia Commons, licence CC0 1.0, source file; changes: cropping

- Weighted mean
- 264m³ CH₄/t VS
- Range
- 147–390m³ CH₄/t VS
- Records
- 5studies
- Publications
- 5sources
- Temperatures
- 35 °C, 36 °Cof the test
Methane in biogas
Medium methane content · ≈ 5.8 kWh/m³ of biogas
measured mean of 1 study BMP; in a batch test the CH₄ share tends to be higher than in a plant.
Rating for biogas plants
not rated — editorial rating for biogas plants
Not rated: no dry matter or volatile solids in the data. We calculate the rating when the dry matter and volatile solids of the material are known.
Add to the co-digestion calculator CSV data
BMP curves from 5 studies
Weighted mean Individual records
Dashed lines are a model curve (first-order kinetics, B(t) = B₀·(1 − e−kt)); the end point comes from the publication. All curves are model curves.
Cumulative methane production over the test [m³ CH₄/t VS]. The thick line is the weighted mean of all records (264); dots mark the end values given in the publications. Point at the chart to read values; click a legend item to hide or show a record.
Records and sources
Download CSV| Source | BMP m³ CH₄/t VS | CH₄ in biogas % vol., measured | Temperature | Sample | Curve |
|---|---|---|---|---|---|
| Prajapati et al. (2018) DOI | 267 | — | — | mung bean husk (MBH) | end point (model curve) |
| Cai et al. (2019) DOI | 227 | — | — | Snow peas (Pisum sativum var. Saccharatum) – Leaf | end point (model curve) |
| Gunaseelan (2004) DOI | 390 | — | 35 °C · mesophilic | garden pea pods (seeds removed) | end point (model curve) |
| López-Dávila et al. (2022) DOI | 287 | — | — | Bean straw and box | end point (model curve) |
| Li et al. (2018) DOI | 147 | 58.4 % | 36 °C · mesophilic | Snap bean crop residues (SBR) | end point (model curve) |
| Weighted mean | 264 | 58.4 % | arithmetic mean 264, SD 89 | ||
Typical composition
- Volatile solids (VS)
- 85.8 % DM (range 79.7–91.8)
- Nitrogen
- 3.1 % DM
- C/N ratio
- 12.7
Median and range of the determinations reported in the publications behind this substrate's BMP records (read from: BCBPD, MY-D); dry matter: 0 determinations, volatile solids: 2 determinations. C/N was calculated as the ratio of C and N content (% DM) from the same source. No DM in the sources – the calculator has to ask for a value.
Sources: Cai et al. (2019); Gunaseelan (2004).
The composition of the raw material varies between batches — for plant calculations use an analysis of your own sample. The calculator inserts typical values automatically.
Process properties
Advantages
- Methane potential in the database: weighted mean 264 m³ CH₄/t VS (median 267; range 147–390; 5 records from 5 sources).
Drawbacks and risks
- Spread of results in the database: standard deviation 89 at a mean of 264 m³ CH₄/t VS (5 records from 5 sources).
Co-digestion — what to combine it with, what to watch out for
- caution
substrates: nitrogen-rich — e.g. Pig slurry, Poultry manure, Waste activated sludge (secondary sludge), Chlorella vulgaris, Nannochloropsis salina
Combining with poultry slurry or slaughterhouse waste increases the risk of ammonia inhibition.[1]
Dosing
No source-based dose limits; treat as an N-rich additive to carbon-rich materials.
Practical requirements
- Shred: shredding increases the surface available for degradation and speeds it up, but does not necessarily raise the final gas yield (FNR 2010, Ch. 3 “Triturado”).
Sources of the process data
- Chen, Y.; Cheng, J.J.; Creamer, K.S. (2008) Inhibition of anaerobic digestion process: A review. Bioresource Technology
- Prajapati, K.K.; Pareek, N.; Vivekanand, V. (2018) Pretreatment and Multi-Feed Anaerobic Co-digestion of Agro-Industrial Residual Biomass for Improved Biomethanation and Kinetic Analysis. Frontiers in Energy Research 6, 111
- Cai, F.; 1. Biomass Energy and Environmental Engineering Research Center, College of Chemical Engineering, Beijing University of Chemical Technology, Beijing 100029, China; Yan, H.; Zhang, R.; Liu, G.; Chen, C.; 2. Department of Biological and Agricultural Engineering, University of California, Davis, CA 95616, USA (2019) Prediction of methane production performances based on determination of organic components for different vegetable wastes. International Journal of Agricultural and Biological Engineering 12(3), 154–159
- Gunaseelan, V. (2004) Biochemical methane potential of fruits and vegetable solid waste feedstocks. Biomass and Bioenergy 26(4), 389–399
- Hendriks, A.T.W.M.; Zeeman, G. (2009) Pretreatments to enhance the digestibility of lignocellulosic biomass. Bioresource Technology
- López-Dávila, E.; Jiménez Hernández, J.; López González, L.M.; Barrera Cardoso, E.L.; Bravo Amarante, E.; Contreras Velázquez, L.M.; Romero-Romero, O. (2022) Biochemical methane potential of agro-wastes as a renewable source alternative for electrical energy production in Cuba. Ciencia & Tecnología Agropecuaria 23(1)
- Li, P.; Li, W.; Sun, M.; Xu, X.; Zhang, B.; Sun, Y. (2018) Evaluation of Biochemical Methane Potential and Kinetics on the Anaerobic Digestion of Vegetable Crop Residues. Energies 12(1), 26
- Weiland, P. (2010) Biogas production: current state and perspectives. Applied Microbiology and Biotechnology
- FNR (2010). Guía sobre el Biogás – Desde la producción hasta el uso (hiszp. wydanie „Leitfaden Biogas”, GIZ 2013)
The co-digestion calculator will assess a specific mixture containing this substrate.
What it is and where it comes from
Legumes (pea, bean, soya, broad bean) leave residues after the seeds are harvested: haulm, empty pods, husks and green leaves. Vegetable processing also generates waste from the shelling of peas and green beans. The dataset contains several records from several studies: mung bean husks, sugar pea leaves, seedless garden pea pods, bean haulm and pods from Cuba, and green bean residues. These materials differ in maturity and degree of processing.
Properties relevant to digestion
Leguminous plants accumulate more protein than cereals, so their residues contribute nitrogen and improve the C/N balance in mixtures with straw or grasses. On the other hand, when such material dominates the ration, the risk of ammonia increases. Green leaves and soft pods are readily degradable, whereas dry haulm, husks and mature stems contain lignin and break down more slowly. The wide variation in moisture content affects how the material is stored.
How to read the spread of results
Different species and plant parts from several studies, at different temperatures (some records without a stated temperature), have been gathered under one name, so the spread is considerable. Green, young residues have different values from dry haulm. Cultivar, harvest date, seed share, particle size, sample drying and inoculum also have an effect. This group should not be treated as a single substrate with constant parameters.
In biogas plant practice
Legume residues are a seasonal addition to the mix, particularly where vegetable processing operates around the biogas plant. Ensiling or prompt use of green residues and chopping of dry haulm are recommended. Where the share of protein-rich material is large, the ammonia concentration must be monitored. Residues left in the field have fertiliser value, so before harvesting it is worth assessing competing uses of the biomass. Planning is based on the BMP test.
Methodology in brief
BMP is the amount of methane obtained from volatile solids (VS) in a batch test, given in m³ CH₄ per tonne of VS (numerically the same as NmL CH₄/g VS in the publications) and converted to normal conditions (0 °C, 101.325 kPa). The weighted mean gives each publication a total weight of 1, split equally between its results for the substrate — a paper testing twenty varieties does not outweigh a paper with a single sample. In inter-laboratory programmes the unit is the laboratory (total weight 1), and within it the weight of a test grows with the number of bottles (replicates). Results after pretreatment (e.g. thermal, chemical, enzymatic) are shown separately and are not included in the mean.
Solid lines are curves measured in the tests. Where a publication gives only the final result, we draw a first-order kinetic model, B(t) = B₀·(1 − e−kt): only the end point comes from the publication, and the shape of the curve serves purely as visualisation — do not read the production on a particular day from it. For this substrate k = 0.136 d−1 was assumed (median of rate constants k reported in the sources and/or fitted to the mean measured curves).
The statistics describe the spread of published results — a descriptive compilation, not a meta-analysis or a guarantee of plant yield.
Bibliography
- Prajapati, K.K.; Pareek, N.; Vivekanand, V. (2018). Pretreatment and Multi-Feed Anaerobic Co-digestion of Agro-Industrial Residual Biomass for Improved Biomethanation and Kinetic Analysis. Frontiers in Energy Research 6, 111. DOI: 10.3389/fenrg.2018.00111 DOI
- Cai, F.; 1. Biomass Energy and Environmental Engineering Research Center, College of Chemical Engineering, Beijing University of Chemical Technology, Beijing 100029, China; Yan, H.; Zhang, R.; Liu, G.; Chen, C.; 2. Department of Biological and Agricultural Engineering, University of California, Davis, CA 95616, USA (2019). Prediction of methane production performances based on determination of organic components for different vegetable wastes. International Journal of Agricultural and Biological Engineering 12(3), 154–159. DOI: 10.25165/j.ijabe.20191203.4705 DOI
- Gunaseelan, V. (2004). Biochemical methane potential of fruits and vegetable solid waste feedstocks. Biomass and Bioenergy 26(4), 389–399. DOI: 10.1016/j.biombioe.2003.08.006 DOI
- López-Dávila, E.; Jiménez Hernández, J.; López González, L.M.; Barrera Cardoso, E.L.; Bravo Amarante, E.; Contreras Velázquez, L.M.; Romero-Romero, O. (2022). Biochemical methane potential of agro-wastes as a renewable source alternative for electrical energy production in Cuba. Ciencia & Tecnología Agropecuaria 23(1). DOI: 10.21930/rcta.vol23_num1_art:1890 DOI
- Li, P.; Li, W.; Sun, M.; Xu, X.; Zhang, B.; Sun, Y. (2018). Evaluation of Biochemical Methane Potential and Kinetics on the Anaerobic Digestion of Vegetable Crop Residues. Energies 12(1), 26. DOI: 10.3390/en12010026 DOI
All sources of the site: bibliography.
Other substrates in the group “Straws and crop residues”
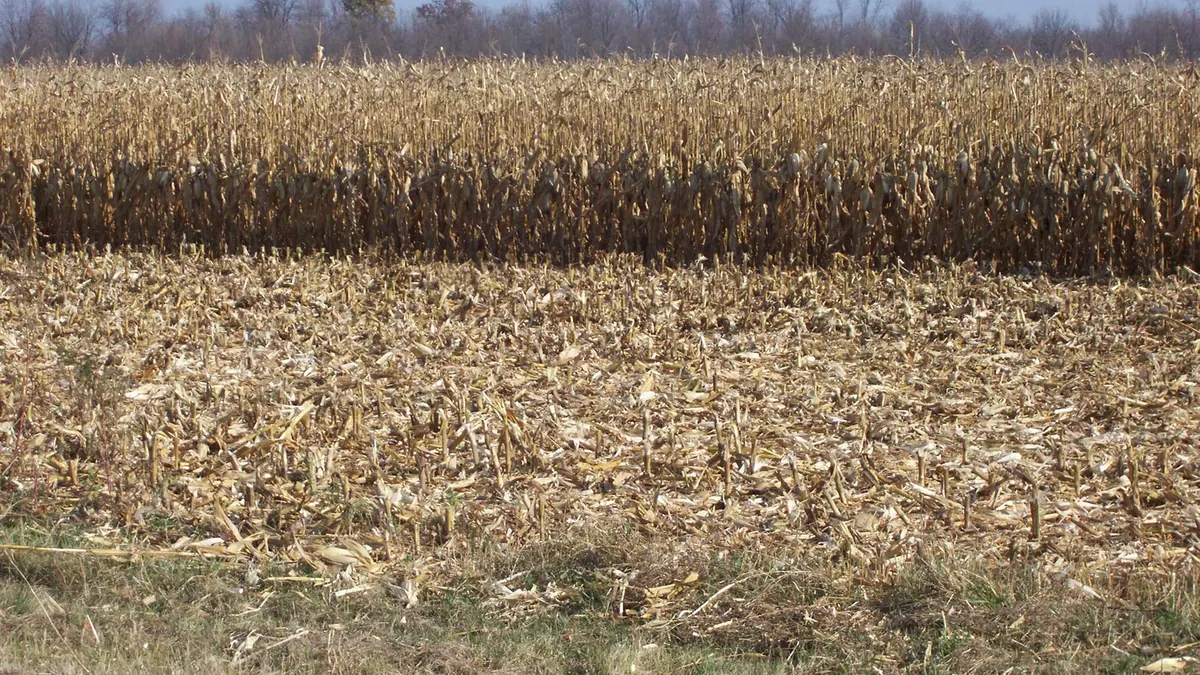
Maize stover — BMP: 10 studies, weighted mean 298 m³ CH₄/t VS
298 m³ CH₄/t VS weighted mean from 10 studies
good — editorial rating for biogas plants≈52 %
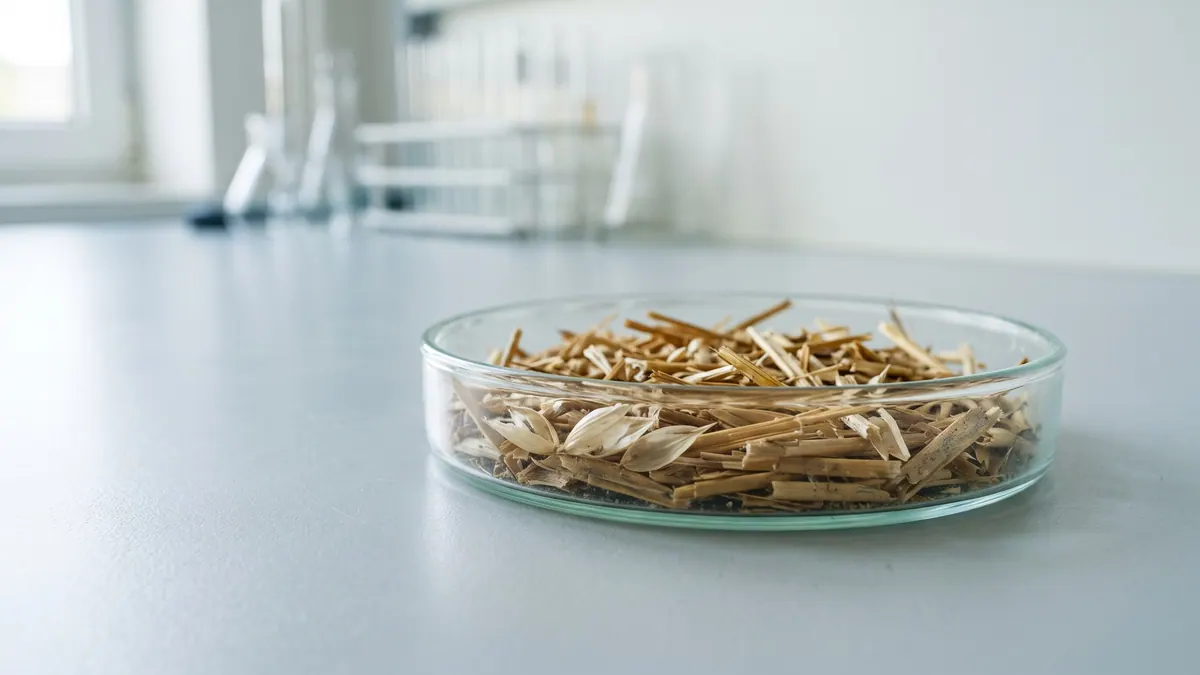
Oat straw — BMP: 2 studies, weighted mean 275 m³ CH₄/t VS
275 m³ CH₄/t VS weighted mean from 2 studies
≈52 %
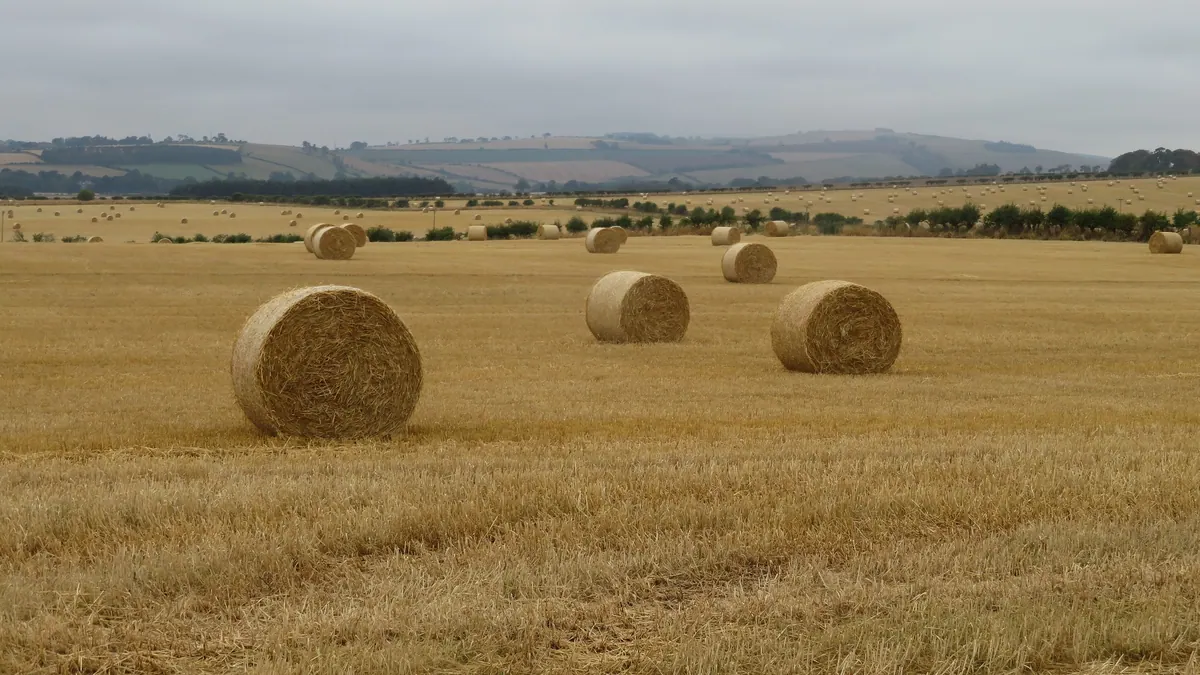
Barley straw — BMP: 8 studies, weighted mean 238 m³ CH₄/t VS
238 m³ CH₄/t VS weighted mean from 8 studies
good — editorial rating for biogas plants≈52 %
Rapeseed straw — BMP: 2 studies, weighted mean 241 m³ CH₄/t VS
241 m³ CH₄/t VS weighted mean from 2 studies
good — editorial rating for biogas plants≈53 %