

BMP testingSewage and industrial sludges
Waste activated sludge (secondary sludge) — BMP: 12 studies, weighted mean 151 m³ CH₄/t VS
Excess sludge (secondary, activated) is bacterial biomass from wastewater treatment plants, harder to digest than primary sludge; pretreatment improves it.
rating: negativeCH₄ ≈ 58 % (estimate)
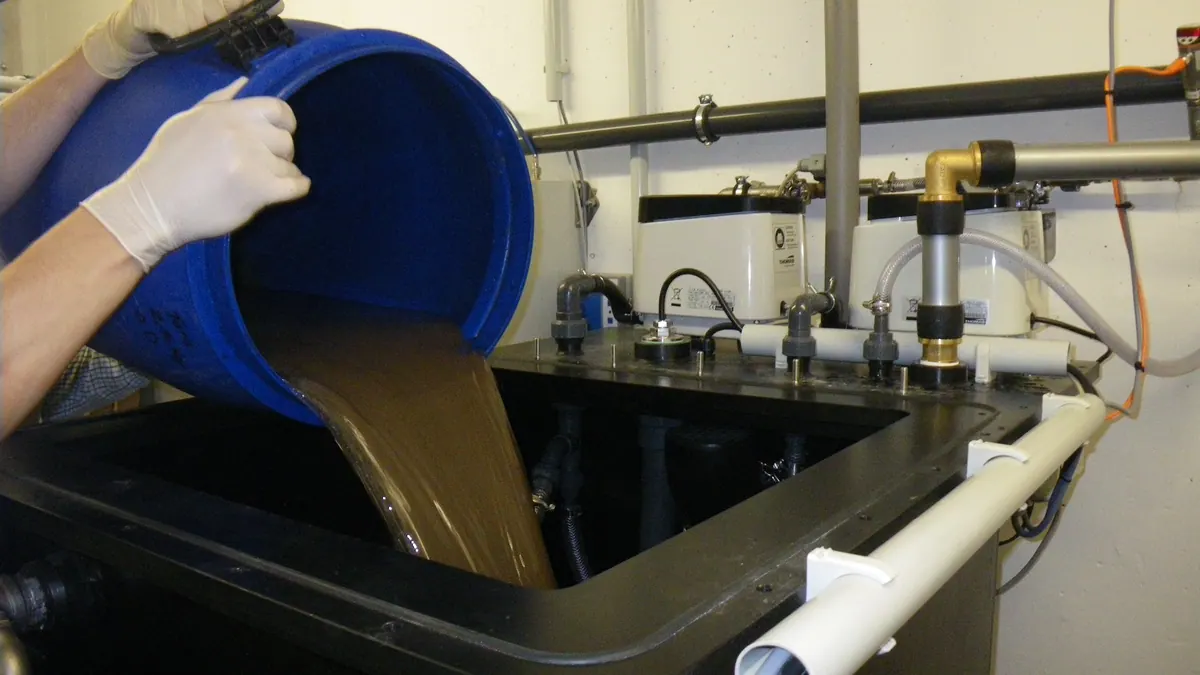
Photo SuSanA Secretariat / Wikimedia Commons, licence CC BY 2.0, source file; changes: cropping

- Weighted mean
- 151m³ CH₄/t VS
- Range
- 53–183m³ CH₄/t VS
- Records
- 12studies
- Publications
- 3sources
- Temperatures
- 35 °C, 36 °Cof the test
Methane in biogas
Medium methane content · ≈ 5.8 kWh/m³ of biogas
estimate from the substrate type The collected studies contain no measurement. The interval follows from the approximate composition (protein-rich (process classification)) and the yields of compound groups according to FNR.
Rating for biogas plants
negative — editorial rating for biogas plantsMay endanger process stability — not worth taking even with a large payment
Potential per tonne of fresh matter: very low (2 m³ CH₄/t); process risk: protein / nitrogen, inhibitors. Handling costs: slow degradation. Low potential combined with process risk and handling costs.
Why? Rating factors
Potential per tonne −1
- −1potential 2 m³ CH₄/t fresh matter (BMP 151 × DM 2.1 % × VS 48 %)
Process stability −1.5
- −1protein / nitrogen: risk of ammonia inhibition at higher shares
- −0.5inhibitors: natural or residues (e.g. limonene, polyphenols, antibiotics, metals)
Handling and costs −0.5
- −0.5slow degradation — long retention time
Total points: −3 · thresholds: ≥ 2.5 very good, ≥ 1 good, below — neutral; negative with cumulative process risk.
Low potential combined with process risk and handling costs.
Add to the co-digestion calculator CSV data
BMP curves from 12 studies
Weighted mean Individual records
Dashed lines are a model curve (first-order kinetics, B(t) = B₀·(1 − e−kt)); the end point comes from the publication. All curves are model curves.
Cumulative methane production over the test [m³ CH₄/t VS]. The thick line is the weighted mean of all records (151); dots mark the end values given in the publications. Point at the chart to read values; click a legend item to hide or show a record.
Records and sources
Download CSV| Source | BMP m³ CH₄/t VS | Temperature | Sample | Curve |
|---|---|---|---|---|
| Catenacci et al. (2019) · 1 DOI | 53 | 35 °C · mesophilic | secondary sludge | end point (model curve) |
| Catenacci et al. (2019) · 2 DOI | 95 | 35 °C · mesophilic | secondary sludge | end point (model curve) |
| Catenacci et al. (2019) · 3 DOI | 105 | 35 °C · mesophilic | secondary sludge | end point (model curve) |
| Catenacci et al. (2019) · 4 DOI | 125 | 35 °C · mesophilic | secondary sludge | end point (model curve) |
| Catenacci et al. (2019) · 5 DOI | 133 | 35 °C · mesophilic | secondary sludge | end point (model curve) |
| Catenacci et al. (2019) · 6 DOI | 155 | 35 °C · mesophilic | secondary sludge | end point (model curve) |
| Catenacci et al. (2019) · 7 DOI | 170 | 35 °C · mesophilic | secondary sludge | end point (model curve) |
| Catenacci et al. (2019) · 8 DOI | 175 | 35 °C · mesophilic | secondary sludge | end point (model curve) |
| Catenacci et al. (2019) · 9 DOI | 180 | 35 °C · mesophilic | secondary sludge | end point (model curve) |
| Catenacci et al. (2019) · 10 DOI | 183 | 35 °C · mesophilic | secondary sludge | end point (model curve) |
| Erden i Filibeli (2010) DOI | 151 | 36 °C · mesophilic | wastewater sludge | end point (model curve) |
| Nielfa et al. (2015) DOI | 164 | — | Biological sludge (BS) | end point (model curve) |
| Weighted mean | 151 | arithmetic mean 141, SD 40 | ||
Typical composition
- Dry matter (DM)
- 2.1% (range 2.1–2.1)
- Volatile solids (VS)
- 48 % DM (range 48–48)
Median and range of the determinations reported in the publications behind this substrate's BMP records (read from: MY-D); dry matter: 1 determination, volatile solids: 1 determination. DM from a single determination – indicative value.
Sources: Erden et al. (2010).
The composition of the raw material varies between batches — for plant calculations use an analysis of your own sample. The calculator inserts typical values automatically.
Process properties
Advantages
- Methane potential in the Substraty.pl BMP dataset: weighted mean 151.0 m³ CH₄/t VS (SD 40.0; 12 records, 3 sources).
- Bacterial biomass - a base for co-digestion; improved by pretreatment (Appels et al. 2008).
Drawbacks and risks
- Cell walls limit hydrolysis - the limiting step (Appels et al. 2008).
- Protein -> ammonia (Rajagopal et al. 2013).
- Heavy metal content depends on the wastewater (Chen et al. 2008).
Co-digestion — what to combine it with, what to watch out for
- combines well
substrates: fat-rich — e.g. Food waste, Spent coffee grounds, Primary sludge, Sunflower seeds, Olive pomace / olive mill solid waste
Sewage sludge is a good base for co-digestion of fats at a wastewater treatment plant (stable operation at FOG 10-30% VS).[1]
Dosing
No source threshold.
Introduce gradually, starting with a small dose and monitoring the process (e.g. FOS/TAC, pH, gas composition).
Sources of the process data
- Davidsson et al. (2008). Co-digestion of grease trap sludge and sewage sludge. Waste Manag.
- Appels et al. (2008). Principles and potential of the anaerobic digestion of waste-activated sludge. Prog. Energy Combust. Sci.
- Rajagopal, Masse, Singh (2013). A critical review on inhibition of anaerobic digestion process by excess ammonia. Bioresour. Technol.
- Chen, Cheng, Creamer (2008). Inhibition of anaerobic digestion process: A review. Bioresour. Technol.
The co-digestion calculator will assess a specific mixture containing this substrate.
What it is and where it comes from
Excess sludge, also known as secondary or activated sludge (WAS), is the surplus bacterial biomass removed from the activated sludge system of a municipal wastewater treatment plant. It is thickened mechanically and sent to dedicated digesters, often as a mixture with primary sludge. In Poland it makes up a large waste stream, and digesters at treatment plants are among the most numerous biogas installations. The dataset contains samples of secondary sludge tested at mesophilic temperature.
Properties relevant to digestion
The sludge consists mainly of bacterial cells, protein, extracellular polymers and a mineral fraction. The cell walls are resistant to hydrolysis, which is the limiting step, so degradation is slower and the yield lower than for primary sludge. Because of its high protein content the sludge releases ammonia. The content of heavy metals and micropollutants depends on the wastewater entering the plant. Sludges from plants with biological phosphorus removal may contain compounds that increase struvite formation.
How to read the spread of results
The results depend on the age of the sludge (the older it is, the more mineralised and the harder to digest), the type of treatment plant and nutrient removal, the composition of the wastewater, the thickening method and storage. The test conditions have a strong influence: temperature, inoculum, substrate-to-inoculum ratio and incubation length. If the sludge was disintegrated beforehand (ultrasound, heating), the result increases, but such records are marked separately in the dataset. The records here concern sludge without pretreatment.
In biogas plant practice
Excess sludge is digested primarily in treatment plant digesters, where sludge stabilisation is a required stage. Thermal hydrolysis or disintegration, which increase gas yield, are often applied. The digestate must be dewatered and managed in accordance with the rules on sewage sludge (code 19 08 05), which is costly and regulated. Co-digestion of sludge with wastes rich in carbohydrates or fats increases gas production, but requires a permit and process control.
Compared with primary sludge, excess sludge has slower kinetics, so the retention time in treatment plant digesters is determined, among other things, by its share. With longer ageing of the sludge in the biological system the result falls further, which should be taken into account when interpreting literature data from different treatment plants.
Methodology in brief
BMP is the amount of methane obtained from volatile solids (VS) in a batch test, given in m³ CH₄ per tonne of VS (numerically the same as NmL CH₄/g VS in the publications) and converted to normal conditions (0 °C, 101.325 kPa). The weighted mean gives each publication a total weight of 1, split equally between its results for the substrate — a paper testing twenty varieties does not outweigh a paper with a single sample. In inter-laboratory programmes the unit is the laboratory (total weight 1), and within it the weight of a test grows with the number of bottles (replicates). Results after pretreatment (e.g. thermal, chemical, enzymatic) are shown separately and are not included in the mean.
Solid lines are curves measured in the tests. Where a publication gives only the final result, we draw a first-order kinetic model, B(t) = B₀·(1 − e−kt): only the end point comes from the publication, and the shape of the curve serves purely as visualisation — do not read the production on a particular day from it. For this substrate k = 0.091 d−1 was assumed (no kinetic data for the group – the median of all available rate constants k (93 values) was used).
The statistics describe the spread of published results — a descriptive compilation, not a meta-analysis or a guarantee of plant yield.
Results after pretreatment (1) — excluded from the mean
| Source | BMP m³ CH₄/t VS | Pretreatment | Sample |
|---|---|---|---|
| Erden i Filibeli (2010) | 220 | physical | wastewater sludge |
Bibliography
- Catenacci, A.; Azzellino, A.; Malpei, F. (2019). Development of statistical predictive models for estimating the methane yield of Italian municipal sludges from chemical composition: a preliminary study. Water Science and Technology 79(3), 435–447. DOI: 10.2166/wst.2019.063 DOI
- Erden, G.; Filibeli, A. (2010). Ultrasonic pre‐treatment of biological sludge: consequences for disintegration, anaerobic biodegradability, and filterability. Journal of Chemical Technology & Biotechnology 85(1), 145–150. DOI: 10.1002/jctb.2298 DOI
- Nielfa, A.; Cano, R.; Fdz-Polanco, M. (2015). Theoretical methane production generated by the co-digestion of organic fraction municipal solid waste and biological sludge. Biotechnology Reports 5, 14–21. DOI: 10.1016/j.btre.2014.10.005 DOI
All sources of the site: bibliography.
Other substrates in the group “Sewage and industrial sludges”

Municipal sewage sludge (mixed) — BMP: 15 studies, weighted mean 250 m³ CH₄/t VS
250 m³ CH₄/t VS weighted mean from 15 studies
neutral — editorial rating for biogas plants≈54 %
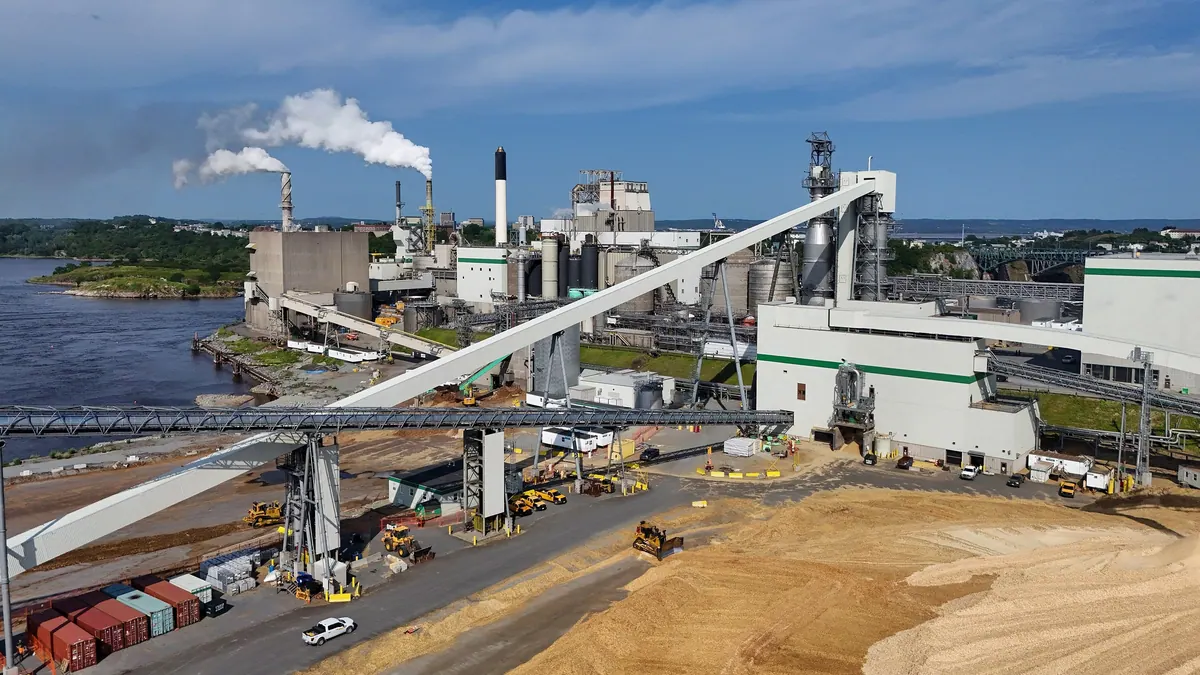
Pulp residues from paper industry — BMP: 2 studies, weighted mean 346 m³ CH₄/t VS
346 m³ CH₄/t VS weighted mean from 2 studies
≈52 %
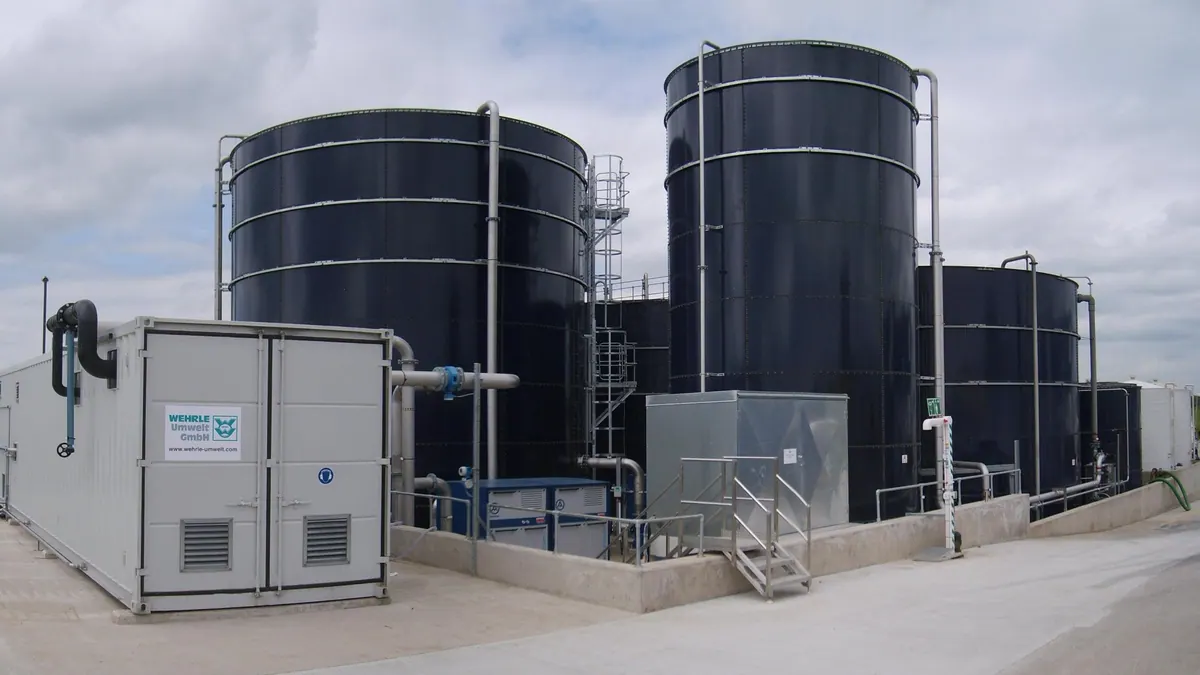
Dairy wastewater biological sludge — BMP: 2 studies, weighted mean 293 m³ CH₄/t VS
293 m³ CH₄/t VS weighted mean from 2 studies
negative — editorial rating for biogas plants≈66 %
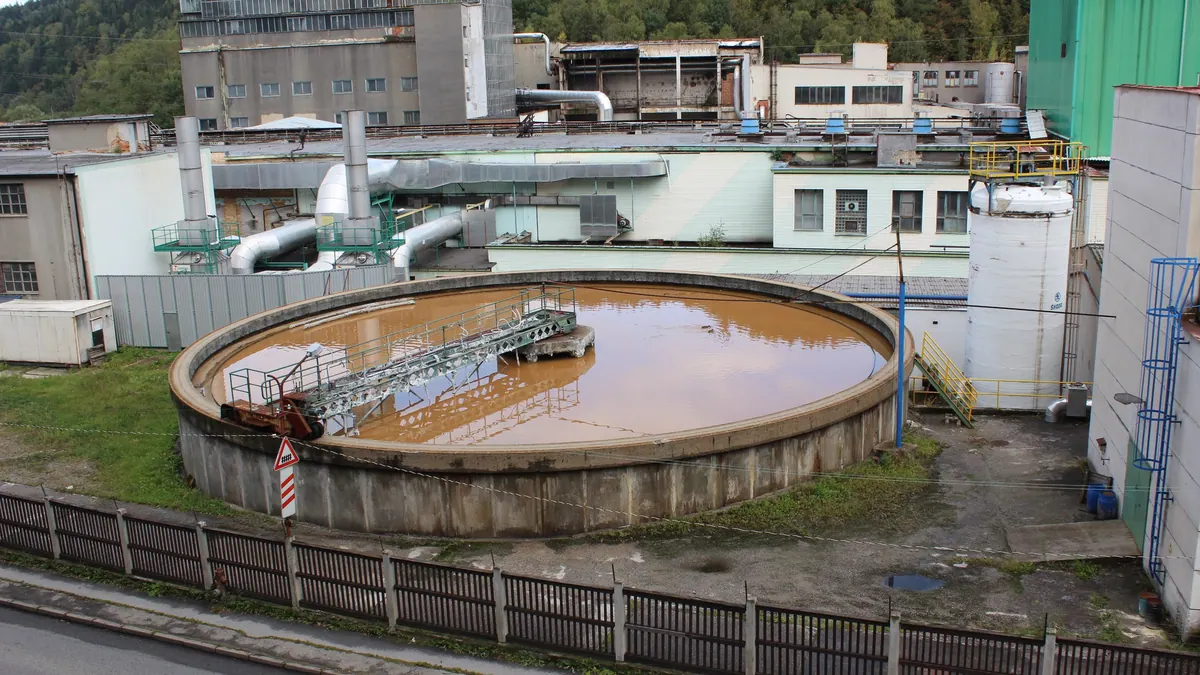
Pulp and paper mill biosludge — BMP: 25 studies, weighted mean 100 m³ CH₄/t VS
100 m³ CH₄/t VS weighted mean from 25 studies
negative — editorial rating for biogas plants≈52 %