


BMP testingSewage and industrial sludges
Municipal sewage sludge (mixed) — BMP: 15 studies, weighted mean 250 m³ CH₄/t VS
Municipal sewage sludge (mixed, unspecified) is a collective entry for primary and excess sludge; results are moderately dispersed and depend on the treatment plant.
rating: neutralCH₄ ≈ 54 % (estimate)
Photo Hannes Grobe 08:01, 27 October 2007 (UTC) / Wikimedia Commons, licence CC BY-SA 2.5, source file; changes: cropping

- Weighted mean
- 250m³ CH₄/t VS
- Range
- 111–407m³ CH₄/t VS
- Records
- 15studies
- Publications
- 8sources
- Temperatures
- 35 °C, 37 °C, 38 °Cof the test
Methane in biogas
Medium methane content · ≈ 5.4 kWh/m³ of biogas
estimate from the substrate type The collected studies contain no measurement. The interval follows from the approximate composition (protein from total nitrogen (N 2.2 % DM × 6.25)) and the yields of compound groups according to FNR.
Rating for biogas plants
neutral — editorial rating for biogas plantsNo clear advantages — worth charging a fee for accepting it
Potential per tonne of fresh matter: low (14 m³ CH₄/t); process risk: protein / nitrogen, inhibitors, sulphur. No additional handling requirements.
Why? Rating factors
Potential per tonne 0
- ±0potential 14 m³ CH₄/t fresh matter (BMP 250 × DM 6.9 % × VS 78.7 %)
Process stability −1.75
- −1protein / nitrogen: risk of ammonia inhibition at higher shares
- −0.5inhibitors: natural or residues (e.g. limonene, polyphenols, antibiotics, metals)
- −0.25sulphur: H₂S in the biogas (toxicity to bacteria, corrosion, desulphurisation)
Handling and costs 0
- 0no factors
Total points: −1.75 · thresholds: ≥ 2.5 very good, ≥ 1 good, below — neutral; negative with cumulative process risk.
Add to the co-digestion calculator CSV data
BMP curves from 15 studies
Weighted mean Individual records
Dashed lines are a model curve (first-order kinetics, B(t) = B₀·(1 − e−kt)); the end point comes from the publication. All curves are model curves.
Cumulative methane production over the test [m³ CH₄/t VS]. The thick line is the weighted mean of all records (250); dots mark the end values given in the publications. Point at the chart to read values; click a legend item to hide or show a record.
Show the remaining records in the legend (3)
Records and sources
Download CSV| Source | BMP m³ CH₄/t VS | Temperature | Sample | Curve |
|---|---|---|---|---|
| Browne et al. (2013) DOI | 247 | 37 °C · mesophilic | wastewater sludge · pretreatment: particle size reduction/sample preparation (MY-D: physical treatment) | end point (model curve) |
| Holliger et al. (2017) DOI | 407 | — | Waste sludge | end point (model curve) |
| Koch et al. (2017) · 1 DOI | 268 | 38 °C · mesophilic | sewage sludge | end point (model curve) |
| Koch et al. (2017) · 2 DOI | 270 | 38 °C · mesophilic | sewage sludge | end point (model curve) |
| Koch et al. (2017) · 3 DOI | 290 | 38 °C · mesophilic | sewage sludge | end point (model curve) |
| Koch et al. (2017) · 4 DOI | 295 | 38 °C · mesophilic | sewage sludge | end point (model curve) |
| Koch et al. (2017) · 5 DOI | 305 | 38 °C · mesophilic | sewage sludge | end point (model curve) |
| Koch et al. (2017) · 6 DOI | 315 | 38 °C · mesophilic | sewage sludge | end point (model curve) |
| Kolbl et al. (2014) DOI | 309 | 38 °C · mesophilic | municipal | end point (model curve) |
| Kouas et al. (2017) · 1 DOI | 126 | 35 °C · mesophilic | wastewater sludge | end point (model curve) |
| Kouas et al. (2017) · 2 DOI | 270 | 35 °C · mesophilic | wastewater sludge | end point (model curve) |
| Serrano et al. (2016) DOI | 111 | 35 °C · mesophilic | sewage sludge | end point (model curve) |
| Lallement et al. (2021) · 1 DOI | 242 | 38 °C · mesophilic | WWTP sludge (Inoculum 1) | end point (model curve) |
| Lallement et al. (2021) · 2 DOI | 243 | 38 °C · mesophilic | WWTP sludge (Inoculum 2) | end point (model curve) |
| Zahan et al. (2016) DOI | 192 | 37 °C · mesophilic | Sewage sludge (SS, primary + waste activated sludge mix) | end point (model curve) |
| Weighted mean | 250 | arithmetic mean 259, SD 74 | ||
Typical composition
- Dry matter (DM)
- 6.9% (range 4.1–23)
- Volatile solids (VS)
- 78.7 % DM (range 77–80)
- Nitrogen
- 2.2 % DM
- C/N ratio
- 19.7
Median and range of the determinations reported in the publications behind this substrate's BMP records (read from: MY-D); dry matter: 4 determinations, volatile solids: 3 determinations. C/N was calculated as the ratio of C and N content (% DM) from the same source.
Sources: Browne et al. (2013); Koch et al. (2017); Kolbl et al. (2014); Serrano et al. (2016).
The composition of the raw material varies between batches — for plant calculations use an analysis of your own sample. The calculator inserts typical values automatically.
Process properties
Advantages
- Methane potential in the Substraty.pl BMP dataset: weighted mean 249.6 m³ CH₄/t VS (SD 74.2; 15 records, 8 sources).
- A typical wastewater treatment plant substrate; co-digestion with fat or glycerol increased methane production (Fountoulakis et al. 2010; Davidsson et al. 2008).
Drawbacks and risks
- Sludge as a co-digestion base tolerated glycerol only up to approx. 1% (v/v) of the feed; above that the process was severely disrupted (Fountoulakis et al. 2010).
- Heavy metals, micropollutants depend on the wastewater (Chen et al. 2008).
Co-digestion — what to combine it with, what to watch out for
- combines well
substrates: fat-rich — e.g. Food waste, Spent coffee grounds, Primary sludge, Sunflower seeds, Olive pomace / olive mill solid waste
Sludge as a base for FOG/glycerol at a wastewater treatment plant.[1][2][3]
Dosing
No limit for the sludge itself — it is the base (matrix) for co-substrates. The limits from the literature relate to the added components: glycerol up to approx. 1% v/v of the feed (Fountoulakis et al. 2010), grease trap sludge 10–30% VS of the feed (Davidsson et al. 2008), sterilised slaughterhouse material up to 5% w/w (Pitkä et al. 2013) — see the entries for those substrates.
Sources of the process data
- Fountoulakis, Petousi, Manios (2010). Co-digestion of sewage sludge with glycerol to boost biogas production. Waste Manag.
- Davidsson et al. (2008). Co-digestion of grease trap sludge and sewage sludge. Waste Manag.
- Pitk et al. (2013). Co-digestion of sewage sludge and sterilized solid slaughterhouse waste: methane production efficiency and process limitations. Bioresour. Technol.
- Chen, Cheng, Creamer (2008). Inhibition of anaerobic digestion process: A review. Bioresour. Technol.
- Appels et al. (2008). Principles and potential of the anaerobic digestion of waste-activated sludge. Prog. Energy Combust. Sci.
The co-digestion calculator will assess a specific mixture containing this substrate.
What it is and where it comes from
Municipal sewage sludge is the sludge arising at domestic and municipal wastewater treatment plants: a mixture of primary and excess sludge, sometimes after thickening. The dataset contains samples described as sewage sludge, wastewater sludge or waste sludge, without indication of the fraction, tested mainly under mesophilic conditions. In Poland most larger treatment plants stabilise sludge in digesters, and the management of the digestate is a major challenge.
Properties relevant to digestion
The composition is a mixture of organic suspended solids and bacterial biomass: carbohydrates, proteins and fats, with a share of mineral fraction. The larger the share of primary sludge, the higher the potential; the larger the share of excess sludge, the lower and slower the degradation. Protein releases ammonia, and sulphur releases hydrogen sulphide. Sludges may contain heavy metals, micropollutants, microplastics and pathogens, which matters for the management of the digestate but not for digestion itself.
How to read the spread of results
The range is moderate because the entry averages many treatment plants. The result is influenced by the proportion of sludges, the age of the sludge, the plant technology, the share of industrial wastewater, thickening and storage, as well as the test conditions: temperature, inoculum (often sludge from a digester), substrate-to-inoculum ratio and incubation length. Records from many sources show typical variability, but for a specific treatment plant your own measurements are useful.
In biogas plant practice
Sludges are the basis of biogas production at wastewater treatment plants; they are usually digested in mesophilic digesters with a retention time that depends on the installation. Gas production can be increased by pretreatment of excess sludge and by co-digestion with waste. Sludges are waste (code 19 08 05) and are subject to the rules on waste management and on municipal sewage sludge, including its use in agriculture or the environment, and in Poland these rules are restrictive.
Compared with the primary and excess sludge entries, this entry is less precise but closer to what is seen in treatment plant digesters. For planning, it is recommended to use data for the separate fractions if their proportions at a given installation are known, and to supplement them with your own test.
A BMP test of your own is therefore recommended.
Methodology in brief
BMP is the amount of methane obtained from volatile solids (VS) in a batch test, given in m³ CH₄ per tonne of VS (numerically the same as NmL CH₄/g VS in the publications) and converted to normal conditions (0 °C, 101.325 kPa). The weighted mean gives each publication a total weight of 1, split equally between its results for the substrate — a paper testing twenty varieties does not outweigh a paper with a single sample. In inter-laboratory programmes the unit is the laboratory (total weight 1), and within it the weight of a test grows with the number of bottles (replicates). Results after pretreatment (e.g. thermal, chemical, enzymatic) are shown separately and are not included in the mean.
Solid lines are curves measured in the tests. Where a publication gives only the final result, we draw a first-order kinetic model, B(t) = B₀·(1 − e−kt): only the end point comes from the publication, and the shape of the curve serves purely as visualisation — do not read the production on a particular day from it. For this substrate k = 0.091 d−1 was assumed (no kinetic data for the group – the median of all available rate constants k (93 values) was used).
The statistics describe the spread of published results — a descriptive compilation, not a meta-analysis or a guarantee of plant yield.
Results after pretreatment (3) — excluded from the mean
| Source | BMP m³ CH₄/t VS | Pretreatment | Sample |
|---|---|---|---|
| Serrano et al. (2016) | 118 | physical | sewage sludge |
| Serrano et al. (2016) | 130 | physical | sewage sludge |
| Serrano et al. (2016) | 118 | physical | sewage sludge |
Bibliography
- Browne, J.D.; Allen, E.; Murphy, J.D. (2013). Evaluation of the biomethane potential from multiple waste streams for a proposed community scale anaerobic digester. Environmental Technology 34(13-14), 2027–2038. DOI: 10.1080/09593330.2013.812669 DOI
- Holliger, C.; Fruteau de Laclos, H.; Hack, G. (2017). Methane Production of Full-Scale Anaerobic Digestion Plants Calculated from Substrate’s Biomethane Potentials Compares Well with the One Measured On-Site. Frontiers in Energy Research 5, 12. DOI: 10.3389/fenrg.2017.00012 DOI
- Koch, K.; Lippert, T.; Drewes, J.E. (2017). The role of inoculum’s origin on the methane yield of different substrates in biochemical methane potential (BMP) tests. Bioresource Technology 243, 457–463. DOI: 10.1016/j.biortech.2017.06.142 DOI
- Kolbl, S.; Paloczi, A.; Panjan, J.; Stres, B. (2014). Addressing case specific biogas plant tasks: Industry oriented methane yields derived from 5L Automatic Methane Potential Test Systems in batch or semi-continuous tests using realistic inocula, substrate particle sizes and organic loading. Bioresource Technology 153, 180–188. DOI: 10.1016/j.biortech.2013.12.010 DOI
- Kouas, M.; Torrijos, M.; Sousbie, P.; Steyer, J.P.; Sayadi, S.; Harmand, J. (2017). Robust assessment of both biochemical methane potential and degradation kinetics of solid residues in successive batches. Waste Management 70, 59–70. DOI: 10.1016/j.wasman.2017.09.001 DOI
- Serrano, A.; Siles, J.; Martín, M.; Chica, A.; Estévez-Pastor, F.; Toro-Baptista, E. (2016). Improvement of anaerobic digestion of sewage sludge through microwave pre-treatment. Journal of Environmental Management 177, 231–239. DOI: 10.1016/j.jenvman.2016.03.048 DOI
- Lallement, A.; Siaud, A.; Peyrelasse, C.; Kaparaju, P.; Schraauwers, B.; Maunas, S.; Monlau, F. (2021). Impact of Operational Factors, Inoculum Origin, and Feedstock Preservation on the Biochemical Methane Potential. Bioengineering 8(11), 176. DOI: 10.3390/bioengineering8110176 DOI
- Zahan, Z.; Othman, M.Z.; Rajendram, W. (2016). Anaerobic Codigestion of Municipal Wastewater Treatment Plant Sludge with Food Waste: A Case Study. BioMed Research International 2016, 1–13. DOI: 10.1155/2016/8462928 DOI
All sources of the site: bibliography.
Other substrates in the group “Sewage and industrial sludges”
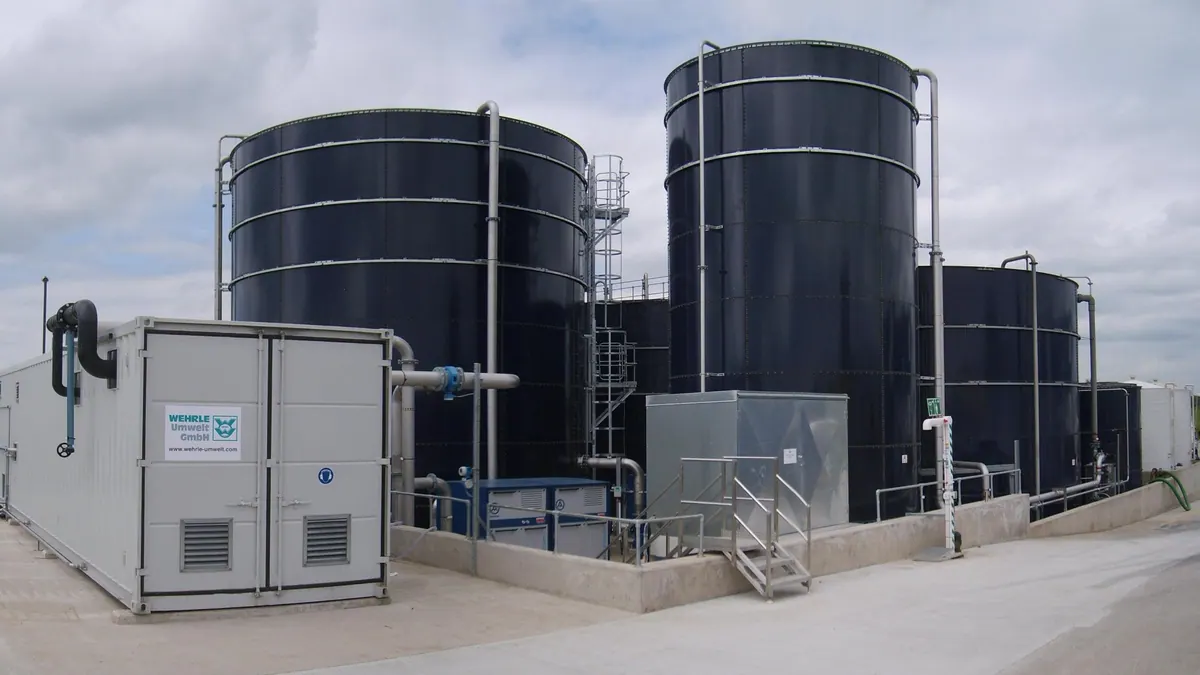
Dairy wastewater biological sludge — BMP: 2 studies, weighted mean 293 m³ CH₄/t VS
293 m³ CH₄/t VS weighted mean from 2 studies
negative — editorial rating for biogas plants≈66 %
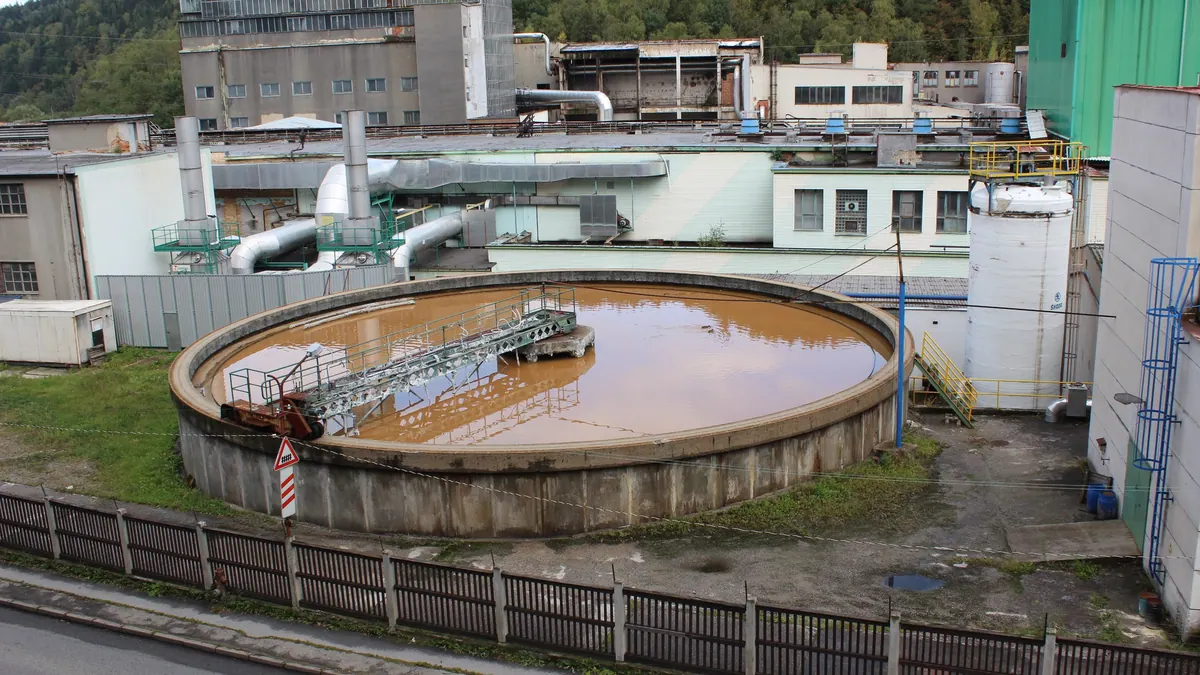
Pulp and paper mill biosludge — BMP: 25 studies, weighted mean 100 m³ CH₄/t VS
100 m³ CH₄/t VS weighted mean from 25 studies
negative — editorial rating for biogas plants≈52 %
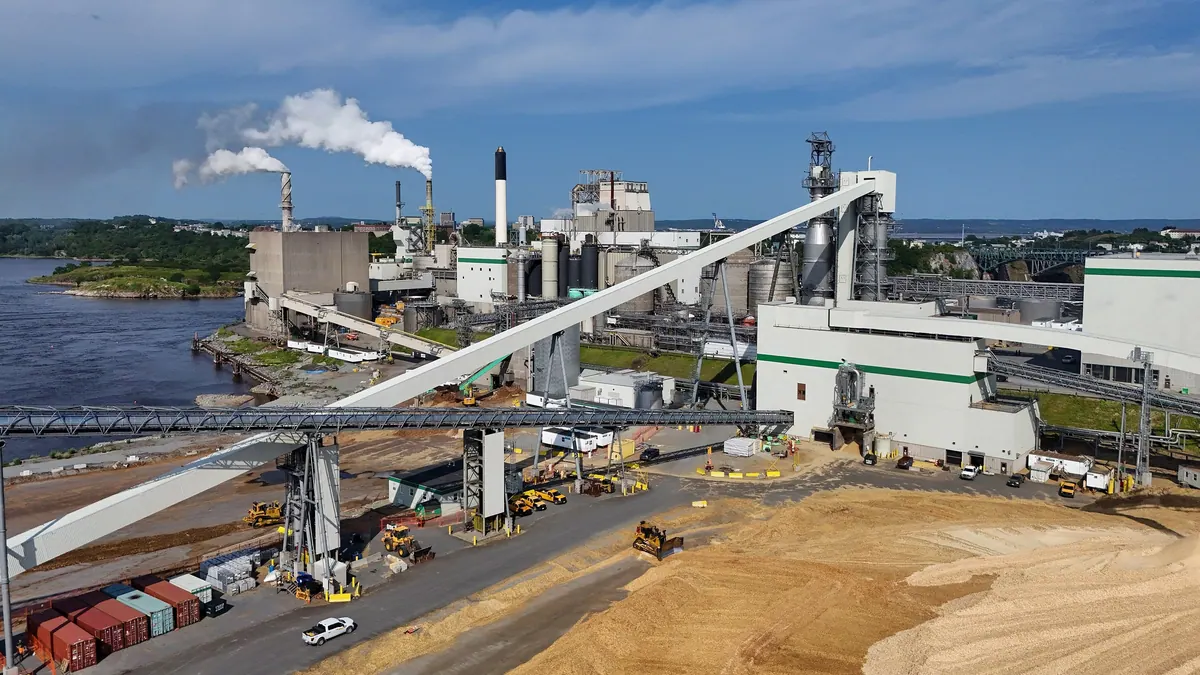
Pulp residues from paper industry — BMP: 2 studies, weighted mean 346 m³ CH₄/t VS
346 m³ CH₄/t VS weighted mean from 2 studies
≈52 %
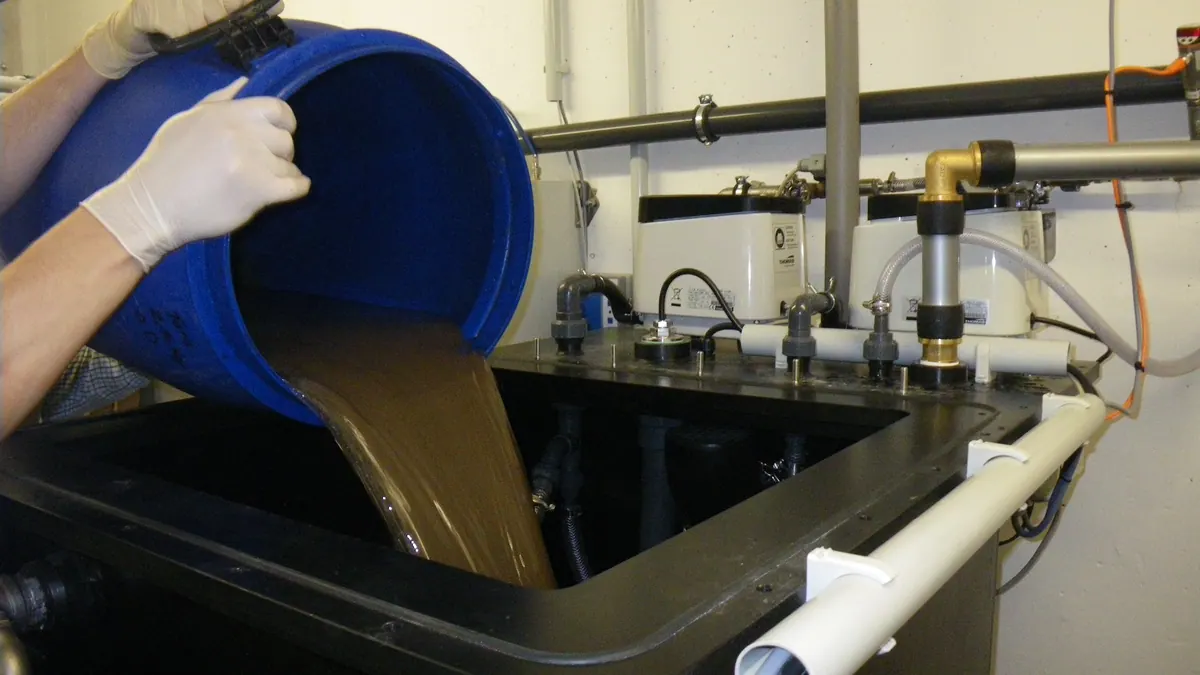
Waste activated sludge (secondary sludge) — BMP: 12 studies, weighted mean 151 m³ CH₄/t VS
151 m³ CH₄/t VS weighted mean from 12 studies
negative — editorial rating for biogas plants≈58 %