

BMP testingBy-products of the agri-food industry
Cassava residue — BMP: 4 studies, weighted mean 170 m³ CH₄/t VS
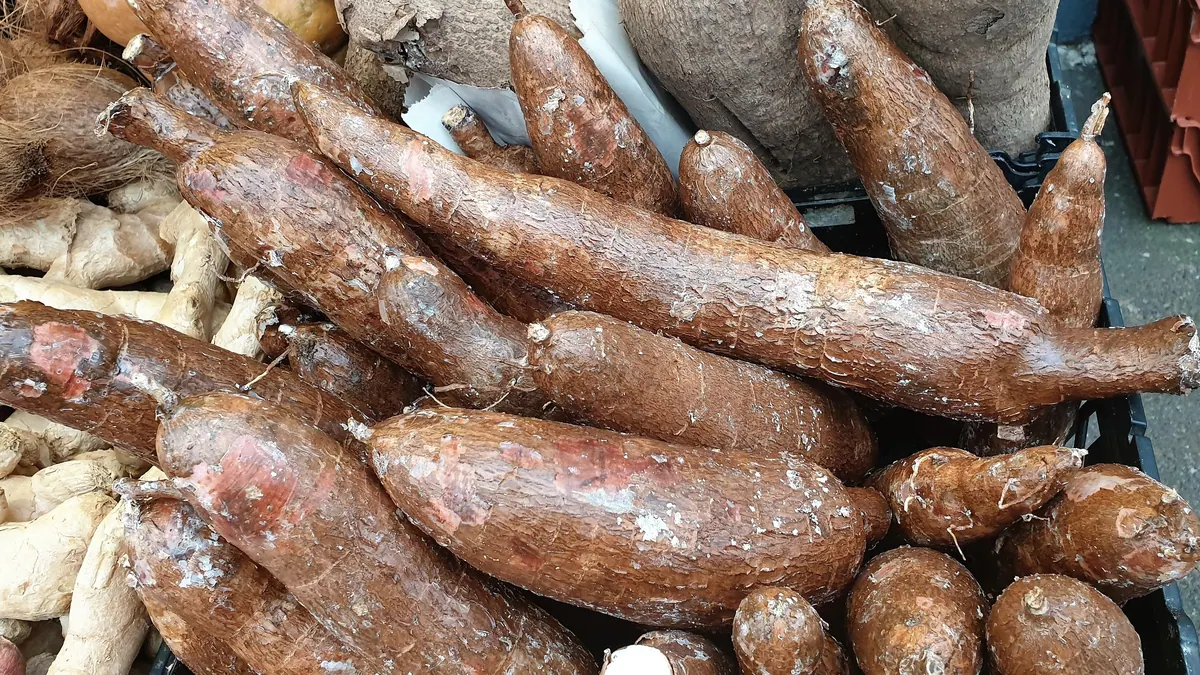
Cassava pulp is the fibrous-starchy residue after starch extraction; results vary strongly, because they depend on extraction efficiency and residual starch.
rating: neutralCH₄ ≈ 52 % (estimate)
Photo Emőke Dénes / Wikimedia Commons, licence CC BY-SA 4.0, source file; changes: cropping

- Weighted mean
- 170m³ CH₄/t VS
- Range
- 34–363m³ CH₄/t VS
- Records
- 4studies
- Publications
- 3sources
- Temperatures
- 37 °C, 55 °Cof the test
Methane in biogas
Medium methane content · ≈ 5.2 kWh/m³ of biogas
estimate from the substrate type The collected studies contain no measurement. The interval follows from the approximate composition (protein from total nitrogen (N 1.3 % DM × 6.25)) and the yields of compound groups according to FNR.
Rating for biogas plants
neutral — editorial rating for biogas plantsNo clear advantages — worth charging a fee for accepting it
Potential per tonne of fresh matter: moderate, but limited by the poor degradability of the organic matter (89 m³ CH₄/t); process risk: acidification. Handling costs: fibres, floating layer.
Why? Rating factors
Potential per tonne +1
- +1potential 89 m³ CH₄/t fresh matter (BMP 170 × DM 57.1 % × VS 91.2 %); low degradability of VS (BMP 170 m³ CH₄/t VS) — points capped
Process stability −0.5
- −0.5acidification: rapid degradation / acidic pH, risk of VFA accumulation, needs buffering
Handling and costs −0.5
- −0.5fibres, floating layer — shredding and intensive mixing
Total points: 0 · thresholds: ≥ 2.5 very good, ≥ 1 good, below — neutral; negative with cumulative process risk.
Add to the co-digestion calculator CSV data
BMP curves from 4 studies
Weighted mean Individual records
Dashed lines are a model curve (first-order kinetics, B(t) = B₀·(1 − e−kt)); the end point comes from the publication. All curves are model curves.
Cumulative methane production over the test [m³ CH₄/t VS]. The thick line is the weighted mean of all records (170); dots mark the end values given in the publications. Point at the chart to read values; click a legend item to hide or show a record.
Records and sources
Download CSV| Source | BMP m³ CH₄/t VS | Temperature | Sample | Curve |
|---|---|---|---|---|
| Cu et al. (2014) DOI | 34 | 37 °C · mesophilic | cassava residue | end point (model curve) |
| Mabecua et al. (2021) · 1 DOI | 326 | — | Cassava fiber CF2 (manometric) | end point (model curve) |
| Mabecua et al. (2021) · 2 DOI | 363 | — | Cassava fiber CF1 (manometric) | end point (model curve) |
| Zhang et al. (2011) DOI | 132 | 55 °C · thermophilic | cassava | end point (model curve) |
| Weighted mean | 170 | arithmetic mean 214, SD 157 | ||
Typical composition
- Dry matter (DM)
- 57.1% (range 18.6–95.6)
- Volatile solids (VS)
- 91.2 % DM (range 84.3–98.1)
- Nitrogen
- 1.3 % DM
Median and range of the determinations reported in the publications behind this substrate's BMP records (read from: MY-D); dry matter: 2 determinations, volatile solids: 2 determinations. The DM range includes fresh samples as well as samples partly dried or dried before the test – for fresh material the lower part of the range applies, ideally your own measurement.
Sources: Cu et al. (2014); Zhang et al. (2011).
The composition of the raw material varies between batches — for plant calculations use an analysis of your own sample. The calculator inserts typical values automatically.
Process properties
Low confidence: the description is based on general characteristics of the substrate group, not on studies of this material. Treat it as a hint to be verified.
Advantages
- Methane potential in the Substraty.pl BMP dataset: weighted mean 170.0 m³ CH₄/t VS (SD 157.1; 4 records, 3 sources).
- Starch and fibre; mixed degradation profile (Hendriks and Zeeman 2009).
Drawbacks and risks
- Quickly turns sour and mouldy (Hagos et al. 2017).
Co-digestion — what to combine it with, what to watch out for
- combines well
substrates: high alkalinity (buffer) — e.g. Cattle manure, Pig slurry, Cattle slurry, Duck slurry, Rumen and digestive tract content
Slurry supplies N and alkalinity, balancing the high C/N of the material.[1][2]
Dosing
No source threshold.
Introduce gradually, starting with a small dose and monitoring the process (e.g. FOS/TAC, pH, gas composition).
Sources of the process data
- Hagos et al. (2017). Anaerobic co-digestion process for biogas production: progress, challenges and perspectives. Renew. Sustain. Energy Rev.
- Weiland, P. (2010) Biogas production: current state and perspectives. Applied Microbiology and Biotechnology
- Hendriks, Zeeman (2009). Pretreatments to enhance the digestibility of lignocellulosic biomass. Bioresour. Technol.
The co-digestion calculator will assess a specific mixture containing this substrate.
What it is and where it comes from
In the industrial production of cassava starch, the tubers are grated and the starch is washed out. The residue, called cassava residue or cassava pulp, contains cell fibre and unextracted starch. It arises in huge quantities in countries such as Thailand, Vietnam, Indonesia, Brazil and Nigeria. In Poland there is no such production, and the technological equivalent is potato pulp from starch plants, which is a separate material.
Properties relevant to digestion
The pulp combines two fractions: readily available starch and more slowly degradable fibre (cellulose, hemicellulose, a small amount of lignin). The proportion depends on the extraction efficiency, so the composition is variable. There is little protein and fat, which gives a high C/N ratio. Starch hydrolyses quickly and may acidify the digester if its share is large. The pulp is wet and, when stored, quickly turns sour and moulds. Residues of cyanogenic glycosides are present, but usually in a small amount after industrial processing.
How to read the spread of results
The spread of results is one of the largest in this group. The set contains several records from several sources, including mesophilic records, records for cassava fibre (designations CF1 and CF2) without a stated temperature, and a record under thermophilic conditions. The differences result primarily from the residual starch content, which depends on the plant and technology, and also from the cassava variety, drying, particle size, temperature and inoculum. Averaging results from different plants is therefore of limited value.
In biogas plant practice
Cassava pulp is introduced into co-digestion with manure or stillage, in gradual portions, controlling pH and volatile acids. In producing countries it is sometimes combined with wash water from starch plants, which has a high organic load. The material must be used quickly or ensiled. Competition from the feed sector and from combustion may limit availability. For installations in Poland it is a comparative material.
For this reason, a safe practice is to determine the starch content of every delivery and to adjust the dose accordingly. A batch with a high starch content behaves like a starchy waste, and a batch with a lot of fibre like a lignocellulosic material, so planning without analysis leads to fluctuations in pH and gas production.
Methodology in brief
BMP is the amount of methane obtained from volatile solids (VS) in a batch test, given in m³ CH₄ per tonne of VS (numerically the same as NmL CH₄/g VS in the publications) and converted to normal conditions (0 °C, 101.325 kPa). The weighted mean gives each publication a total weight of 1, split equally between its results for the substrate — a paper testing twenty varieties does not outweigh a paper with a single sample. In inter-laboratory programmes the unit is the laboratory (total weight 1), and within it the weight of a test grows with the number of bottles (replicates). Results after pretreatment (e.g. thermal, chemical, enzymatic) are shown separately and are not included in the mean.
Solid lines are curves measured in the tests. Where a publication gives only the final result, we draw a first-order kinetic model, B(t) = B₀·(1 − e−kt): only the end point comes from the publication, and the shape of the curve serves purely as visualisation — do not read the production on a particular day from it. For this substrate k = 0.091 d−1 was assumed (no kinetic data for the group – the median of all available rate constants k (93 values) was used).
The statistics describe the spread of published results — a descriptive compilation, not a meta-analysis or a guarantee of plant yield.
Results after pretreatment (1) — excluded from the mean
| Source | BMP m³ CH₄/t VS | Pretreatment | Sample |
|---|---|---|---|
| Zhang et al. (2011) | 260 | unspecified | cassava |
Bibliography
- Cu, T.T.T.; Nguyen, T.X.; Triolo, J.M.; Pedersen, L.; Le, V.D.; Le, P.D.; Sommer, S.G. (2014). Biogas Production from Vietnamese Animal Manure, Plant Residues and Organic Waste: Influence of Biomass Composition on Methane Yield. Asian-Australasian Journal of Animal Sciences 28(2), 280–289. DOI: 10.5713/ajas.14.0312 DOI
- Mabecua, F.; Schwede, S.; Lucas, C.; Klintenberg, P. (2021). Agro-Waste, a Solution for Rural Electrification? Assessing Biomethane Potential of Agro-Waste in Inhambane Province, Southern Mozambique. Water 13(7), 939. DOI: 10.3390/w13070939 DOI
- Zhang, Q.; He, J.; Tian, M.; Mao, Z.; Tang, L.; Zhang, J.; Zhang, H. (2011). Enhancement of methane production from cassava residues by biological pretreatment using a constructed microbial consortium. Bioresource Technology 102(19), 8899–8906. DOI: 10.1016/j.biortech.2011.06.061 DOI
All sources of the site: bibliography.
Other substrates in the group “By-products of the agri-food industry”
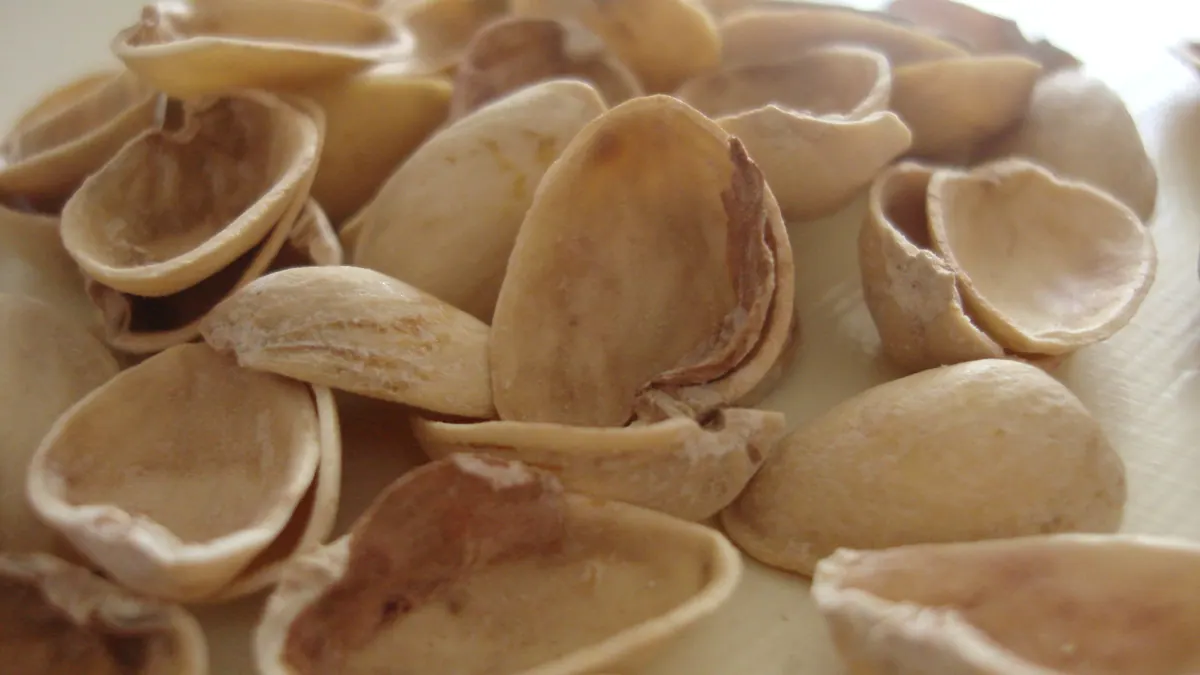
Other nut shells (pistachio, pecan, chestnut, macadamia, pine nut, hickory, ginkgo) — BMP: 7 studies, mean 64 m³ CH₄/t VS
64 m³ CH₄/t VS weighted mean from 7 studies
neutral — editorial rating for biogas plants≈51 %
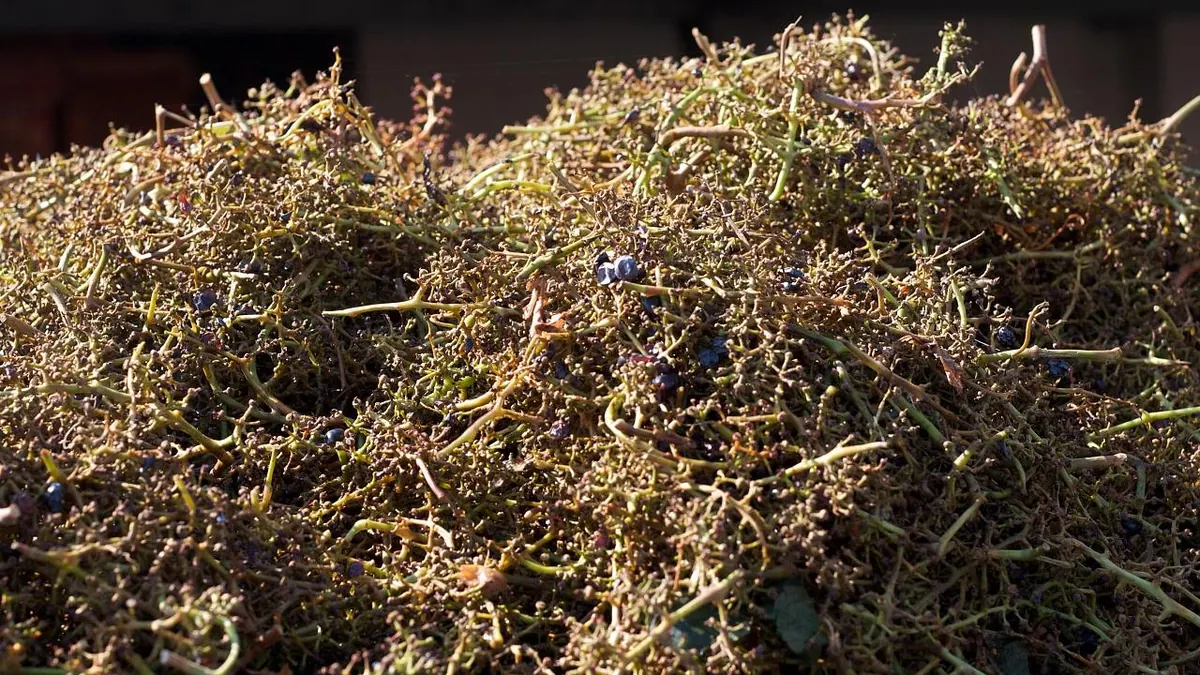
Grape stalks — BMP: 3 studies, weighted mean 137 m³ CH₄/t VS
137 m³ CH₄/t VS weighted mean from 3 studies
≈53 %
Soapstock — BMP: 3 studies, weighted mean 516 m³ CH₄/t VS
516 m³ CH₄/t VS weighted mean from 3 studies
≈63 %
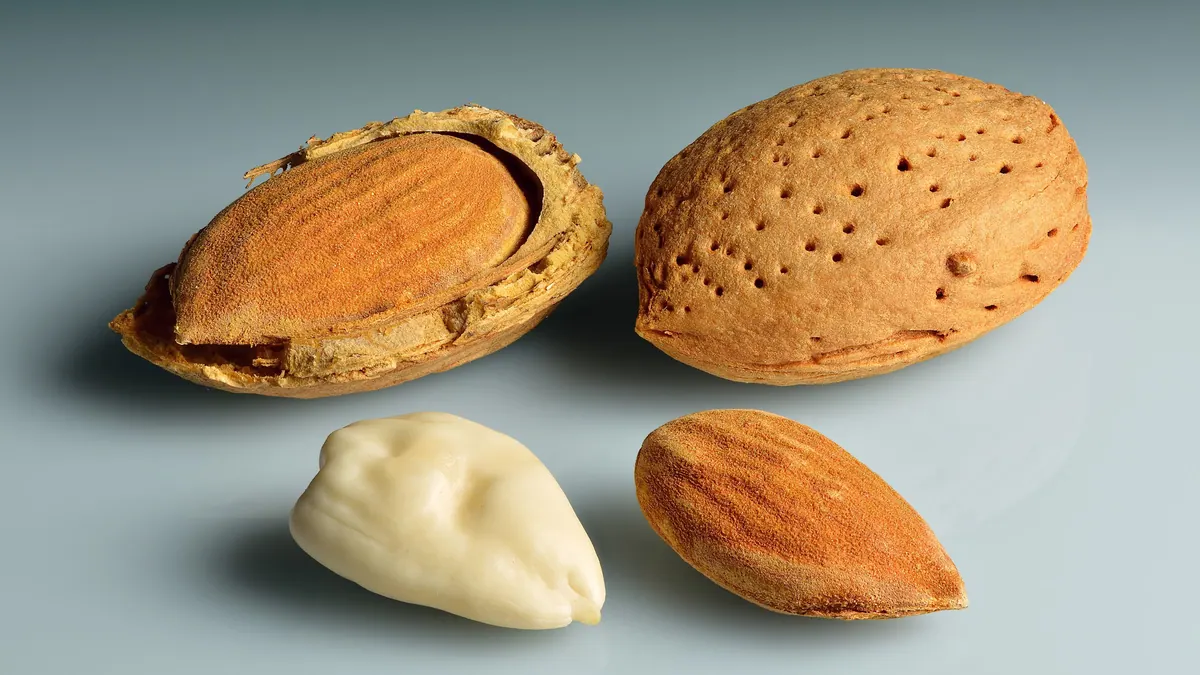
Almond shells — BMP: 3 studies, weighted mean 40 m³ CH₄/t VS
40 m³ CH₄/t VS weighted mean from 3 studies
neutral — editorial rating for biogas plants≈52 %