

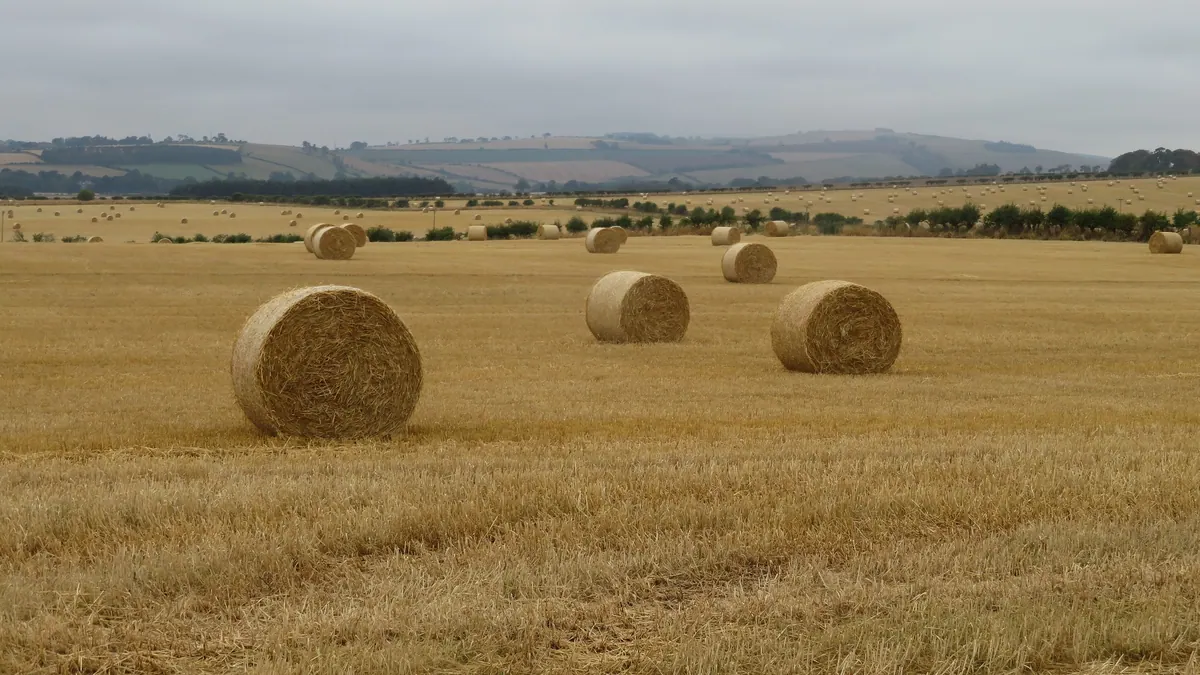
BMP testingStraws and crop residues
Barley straw — BMP: 8 studies, weighted mean 238 m³ CH₄/t VS
Barley straw is a readily available lignocellulosic feedstock from agriculture. Hard to degrade, with a high C/N ratio, it requires chopping and nitrogen supplementation in the mix.
rating: goodCH₄ ≈ 52 % (estimate)
Photo M J Richardson / Wikimedia Commons, licence CC BY-SA 2.0, source file; changes: cropping

- Weighted mean
- 238m³ CH₄/t VS
- Range
- 189–370m³ CH₄/t VS
- Records
- 8studies
- Publications
- 4sources
- Temperatures
- 38 °C, 40 °Cof the test
Methane in biogas
Medium methane content · ≈ 5.2 kWh/m³ of biogas
estimate from the substrate type The collected studies contain no measurement. The interval follows from the approximate composition (protein from total nitrogen (N 1 % DM × 6.25)) and the yields of compound groups according to FNR.
Rating for biogas plants
good — editorial rating for biogas plantsStable, usually accepted without a fee
Potential per tonne of fresh matter: very high (203 m³ CH₄/t); no particular threats to stability. Handling costs: fibres, floating layer, slow degradation.
Why? Rating factors
Potential per tonne +3
- +3potential 203 m³ CH₄/t fresh matter (BMP 238 × DM 90.5 % × VS 94.3 %)
Process stability 0
- 0no factors
Handling and costs −1
- −0.5fibres, floating layer — shredding and intensive mixing
- −0.5slow degradation — long retention time
Total points: 2 · thresholds: ≥ 2.5 very good, ≥ 1 good, below — neutral; negative with cumulative process risk.
Add to the co-digestion calculator CSV data
BMP curves from 8 studies
Weighted mean Individual records
Dashed lines are a model curve (first-order kinetics, B(t) = B₀·(1 − e−kt)); the end point comes from the publication. All curves are model curves.
Cumulative methane production over the test [m³ CH₄/t VS]. The thick line is the weighted mean of all records (238); dots mark the end values given in the publications. Point at the chart to read values; click a legend item to hide or show a record.
Records and sources
Download CSV| Source | BMP m³ CH₄/t VS | Temperature | Sample | Curve |
|---|---|---|---|---|
| Amon et al. (2007) DOI | 189 | 38 °C · mesophilic | Barley Straw | end point (model curve) |
| Dinuccio et al. (2010) DOI | 229 | 40 °C · mesophilic | barley straw · pretreatment: particle size reduction/sample preparation (MY-D: physical treatment) | end point (model curve) |
| Menardo et al. (2012) · 1 DOI | 240 | 40 °C · mesophilic | Barley Straw | end point (model curve) |
| Menardo et al. (2012) · 2 DOI | 286 | 40 °C · mesophilic | Barley Straw · pretreatment: particle size reduction/sample preparation (MY-D: physical treatment) | end point (model curve) |
| Menardo et al. (2012) · 3 DOI | 339 | 40 °C · mesophilic | Barley Straw · pretreatment: particle size reduction/sample preparation (MY-D: physical treatment) | end point (model curve) |
| Menardo et al. (2012) · 4 DOI | 370 | 40 °C · mesophilic | Barley Straw · pretreatment: particle size reduction/sample preparation (MY-D: physical treatment) | end point (model curve) |
| Schumacher et al. (2014) · 1 DOI | 224 | 38 °C · mesophilic | (orig.: “Barley Straw”): value quoted in a literature review | end point (model curve) |
| Schumacher et al. (2014) · 2 DOI | 228 | 38 °C · mesophilic | (orig.: “Barley Straw”): value quoted in a literature review | end point (model curve) |
| Weighted mean | 238 | arithmetic mean 263, SD 63 | ||
Typical composition
- Dry matter (DM)
- 90.5% (range 89.2–90.5)
- Volatile solids (VS)
- 94.3 % DM (range 94.3–97.6)
- Nitrogen
- 1 % DM
Median and range of the determinations reported in the publications behind this substrate's BMP records (read from: MY-D); dry matter: 3 determinations, volatile solids: 3 determinations. Samples were tested dried/air-dry – the DM refers to the material in the test, not to fresh material.
Sources: Dinuccio et al. (2010); Menardo et al. (2012); Schumacher et al. (2014).
The composition of the raw material varies between batches — for plant calculations use an analysis of your own sample. The calculator inserts typical values automatically.
Process properties
Advantages
- Methane potential in the database: weighted mean 238 m³ CH₄/t VS (median 234; range 189–370; 8 records from 4 sources).
Drawbacks and risks
- Lignin limits conversion; long HRT (review by Hendriks 2009).
- Spread of results in the database: standard deviation 63 at a mean of 263 m³ CH₄/t VS (8 records from 4 sources).
Co-digestion — what to combine it with, what to watch out for
- combines well
group: Animal excreta (slurry, manure, poultry litter)
Manure/slurry supplies N and buffer; straw binds water and improves structure.[1][2]
- caution
substrates: tendency to foam — e.g. Spent coffee grounds, Primary sludge, Slaughterhouse waste (cattle, pigs, poultry), Fats, oils and grease (FOG), Milk and buttermilk
Straw in a mix with foaming substrates makes mixing and foam control difficult.[3]
Dosing
No source-based dose limits. In practice straw is an additive to a liquid feed; dosing depends on the size reduction and the mixing capability.
Practical requirements
- Control floating crust and sediment: when solids are fed directly into the digester, the risk of their formation depends on the substrate (FNR 2010, Ch. 3).
- Size reduction (particles <10 mm improve degradation according to Menardo 2012)
Sources of the process data
- Dinuccio, E.; Balsari, P.; Gioelli, F.; Menardo, S. (2010) Evaluation of the biogas productivity potential of some Italian agro-industrial biomasses. Bioresource Technology 101(10), 3780–3783
- Weiland, P. (2010) Biogas production: current state and perspectives. Applied Microbiology and Biotechnology
- Menardo, S.; Airoldi, G.; Balsari, P. (2012) The effect of particle size and thermal pre-treatment on the methane yield of four agricultural by-products. Bioresource Technology 104, 708–714
- Amon, T.; Amon, B.; Kryvoruchko, V.; Machmüller, A.; Hopfner-Sixt, K.; Bodiroza, V.; Hrbek, R.; Friedel, J.; Pötsch, E.; Wagentristl, H.; Schreiner, M.; Zollitsch, W. (2007) Methane production through anaerobic digestion of various energy crops grown in sustainable crop rotations. Bioresource Technology 98(17), 3204–3212
- Dahunsi, S. (2019) Mechanical pretreatment of lignocelluloses for enhanced biogas production: Methane yield prediction from biomass structural components. Bioresource Technology 280, 18–26
- Hendriks, A.T.W.M.; Zeeman, G. (2009) Pretreatments to enhance the digestibility of lignocellulosic biomass. Bioresource Technology
- Schumacher, B.; Wedwitschka, H.; Hofmann, J.; Denysenko, V.; Lorenz, H.; Liebetrau, J. (2014) Disintegration in the biogas sector – Technologies and effects. Bioresource Technology 168, 2–6
- FNR (2010). Guía sobre el Biogás – Desde la producción hasta el uso (hiszp. wydanie „Leitfaden Biogas”, GIZ 2013)
The co-digestion calculator will assess a specific mixture containing this substrate.
What it is and where it comes from
Barley straw is the residue left after the threshing of barley (Hordeum vulgare), grown in Poland for feed and for malt production. After combine harvesting, the straw is spread on the field, baled or ploughed in. It has many uses that compete with a biogas plant: bedding, roughage, organic fertilisation and combustion.
Properties relevant to digestion
Barley straw is a lignocellulosic material with a high dry matter content and low protein content, so it has a very wide C to N ratio. Biological degradation is limited by the lignin-cellulose structure and by the waxy surface of the stalks, which hinders wetting and colonisation by microorganisms. A technological nuisance is floating and scum formation, as well as water absorbency: in a system with a large share of straw, sufficient liquid substrate must be ensured. Chopping increases availability and shortens degradation time, but raises energy consumption.
How to read the spread of results
The dataset contains records from several studies conducted under mesophilic conditions (temperatures ranging from about 38 to 40 °C). The results depend on barley variety, the year and conditions of harvest, straw moisture, degree of chopping (cutting, milling, particle length) and on the substrate-to-inoculum ratio and test length. Because straw kinetics are slow, shorter tests underestimate the result. The dataset covers material without pretreatment; methods such as extrusion, steam or alkaline treatment change the result significantly.
In biogas plant practice
Barley straw is rarely the main substrate. Used in a small share in a mix with slurry or manure, it can increase the dry matter of the feed, but raises the mixing requirements. Chopping and protection against contamination with soil and stones are necessary. Straw should be stored dry, because moisture leads to losses and mould growth. Because of competing uses and the cost of harvesting and transport, profitability must be calculated for the specific location. The energy yield is worth verifying with a BMP test of the batch. It is worth remembering that in a farm's balance straw also has fertiliser and soil-structuring value, so removing all of it is not always advantageous. If a biogas plant uses straw of several species, it is good to record them separately, in order to link changes in yield to the type of feedstock.
Methodology in brief
BMP is the amount of methane obtained from volatile solids (VS) in a batch test, given in m³ CH₄ per tonne of VS (numerically the same as NmL CH₄/g VS in the publications) and converted to normal conditions (0 °C, 101.325 kPa). The weighted mean gives each publication a total weight of 1, split equally between its results for the substrate — a paper testing twenty varieties does not outweigh a paper with a single sample. In inter-laboratory programmes the unit is the laboratory (total weight 1), and within it the weight of a test grows with the number of bottles (replicates). Results after pretreatment (e.g. thermal, chemical, enzymatic) are shown separately and are not included in the mean.
Solid lines are curves measured in the tests. Where a publication gives only the final result, we draw a first-order kinetic model, B(t) = B₀·(1 − e−kt): only the end point comes from the publication, and the shape of the curve serves purely as visualisation — do not read the production on a particular day from it. For this substrate k = 0.136 d−1 was assumed (median of rate constants k reported in the sources and/or fitted to the mean measured curves).
The statistics describe the spread of published results — a descriptive compilation, not a meta-analysis or a guarantee of plant yield.
Results after pretreatment (8) — excluded from the mean
| Source | BMP m³ CH₄/t VS | Pretreatment | Sample |
|---|---|---|---|
| Schumacher et al. (2014) | 247 | unspecified | Barley Straw |
| Schumacher et al. (2014) | 242 | unspecified | Barley Straw |
| Schumacher et al. (2014) | 216 | unspecified | Barley Straw |
| Schumacher et al. (2014) | 237 | unspecified | Barley Straw |
| Schumacher et al. (2014) | 251 | unspecified | Barley Straw |
| Schumacher et al. (2014) | 251 | unspecified | Barley Straw |
| Menardo et al. (2012) | 340 | unspecified | Barley Straw |
| Menardo et al. (2012) | 338 | unspecified | Barley Straw |
Bibliography
- Amon, T.; Amon, B.; Kryvoruchko, V.; Machmüller, A.; Hopfner-Sixt, K.; Bodiroza, V.; Hrbek, R.; Friedel, J.; Pötsch, E.; Wagentristl, H.; Schreiner, M.; Zollitsch, W. (2007). Methane production through anaerobic digestion of various energy crops grown in sustainable crop rotations. Bioresource Technology 98(17), 3204–3212. DOI: 10.1016/j.biortech.2006.07.007 DOI
- Dinuccio, E.; Balsari, P.; Gioelli, F.; Menardo, S. (2010). Evaluation of the biogas productivity potential of some Italian agro-industrial biomasses. Bioresource Technology 101(10), 3780–3783. DOI: 10.1016/j.biortech.2009.12.113 DOI
- Menardo, S.; Airoldi, G.; Balsari, P. (2012). The effect of particle size and thermal pre-treatment on the methane yield of four agricultural by-products. Bioresource Technology 104, 708–714. DOI: 10.1016/j.biortech.2011.10.061 DOI
- Schumacher, B.; Wedwitschka, H.; Hofmann, J.; Denysenko, V.; Lorenz, H.; Liebetrau, J. (2014). Disintegration in the biogas sector – Technologies and effects. Bioresource Technology 168, 2–6. DOI: 10.1016/j.biortech.2014.02.027 DOI
All sources of the site: bibliography.
Other substrates in the group “Straws and crop residues”
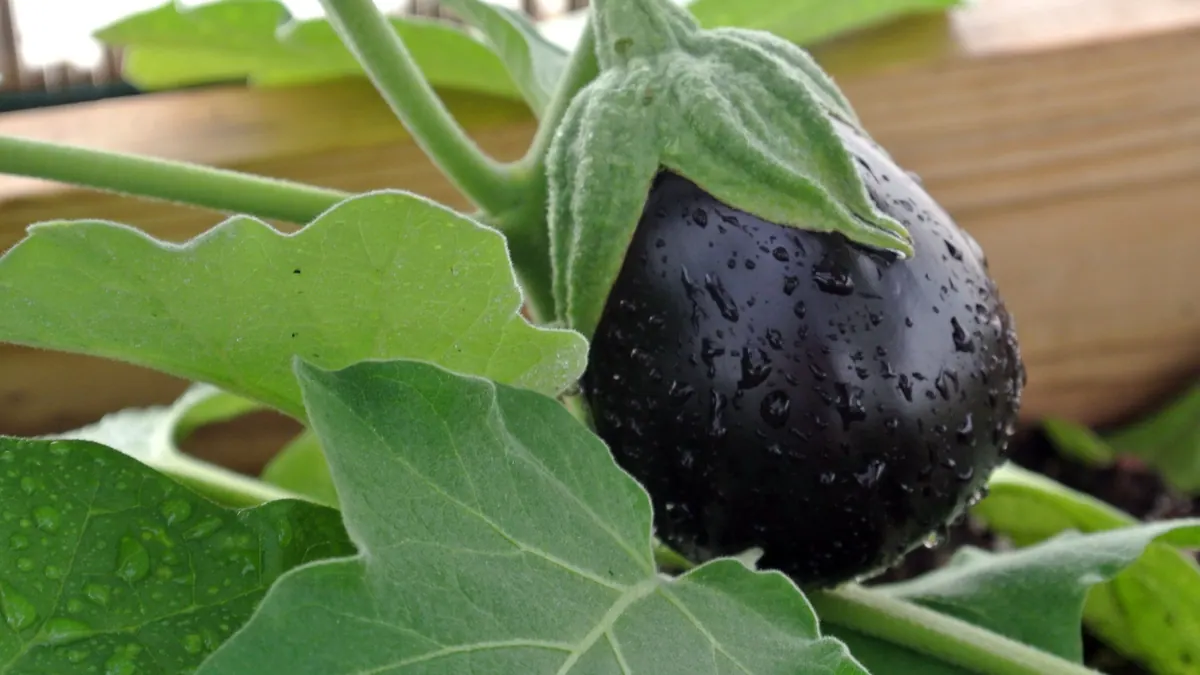
Eggplant stalks and leaves — BMP: 4 studies, weighted mean 218 m³ CH₄/t VS
218 m³ CH₄/t VS weighted mean from 4 studies
56 %
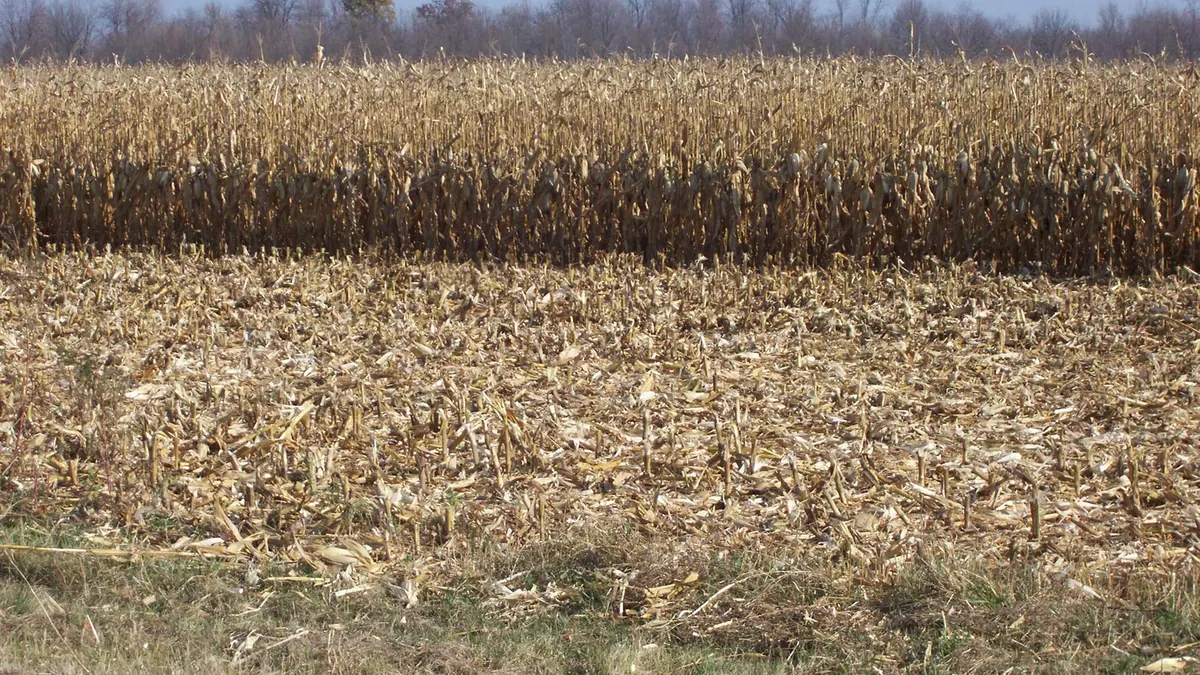
Maize stover — BMP: 10 studies, weighted mean 298 m³ CH₄/t VS
298 m³ CH₄/t VS weighted mean from 10 studies
good — editorial rating for biogas plants≈52 %
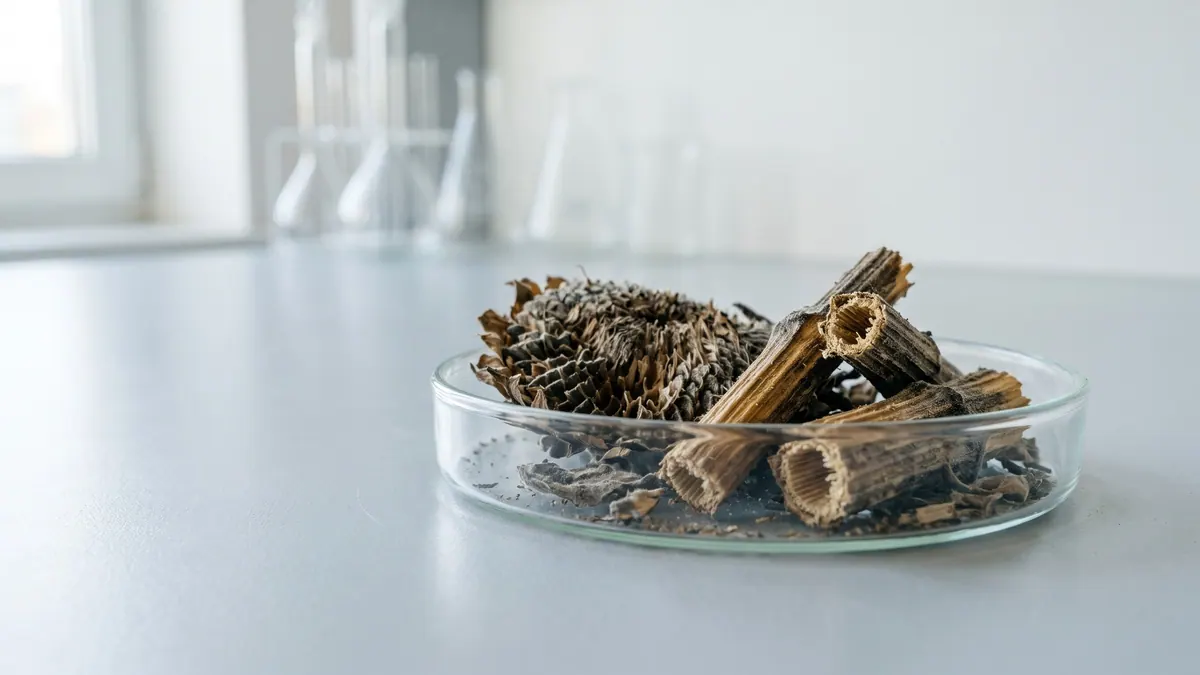
Sunflower residues (heads, stalks) — BMP: 2 studies, weighted mean 169 m³ CH₄/t VS
169 m³ CH₄/t VS weighted mean from 2 studies
≈52 %
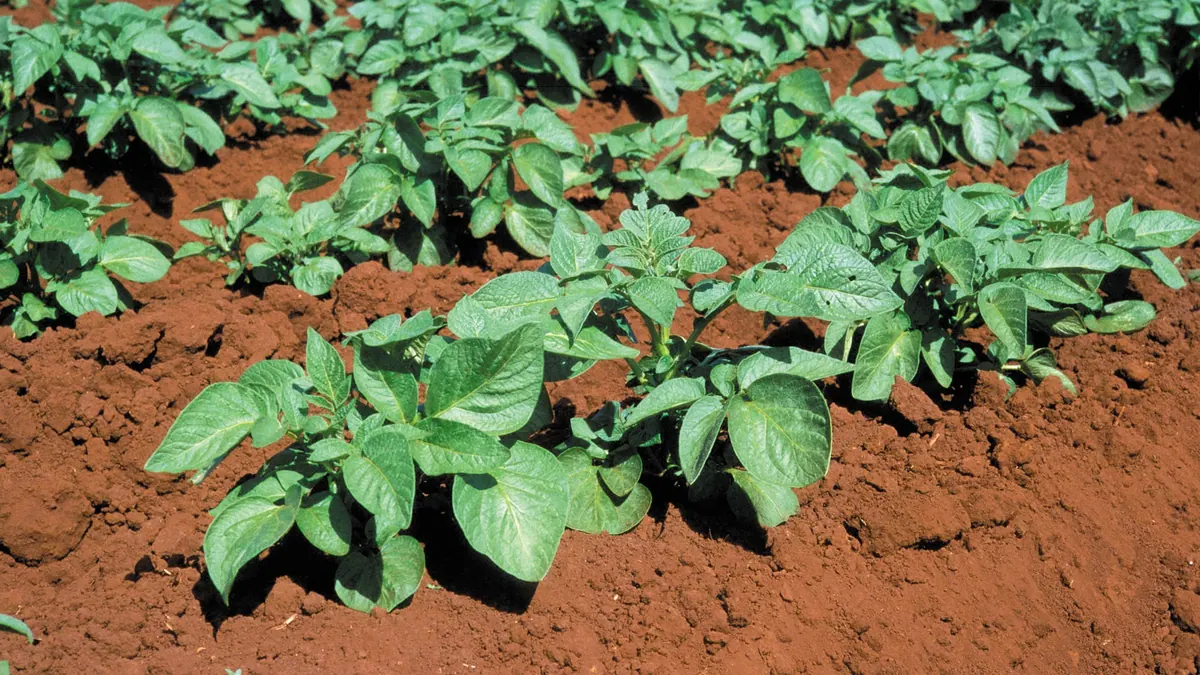
Potato haulm (leaves and stems) — BMP: 2 studies, weighted mean 217 m³ CH₄/t VS
217 m³ CH₄/t VS weighted mean from 2 studies
≈60 %