

BMP testingStraws and crop residuessingle study (2 samples)
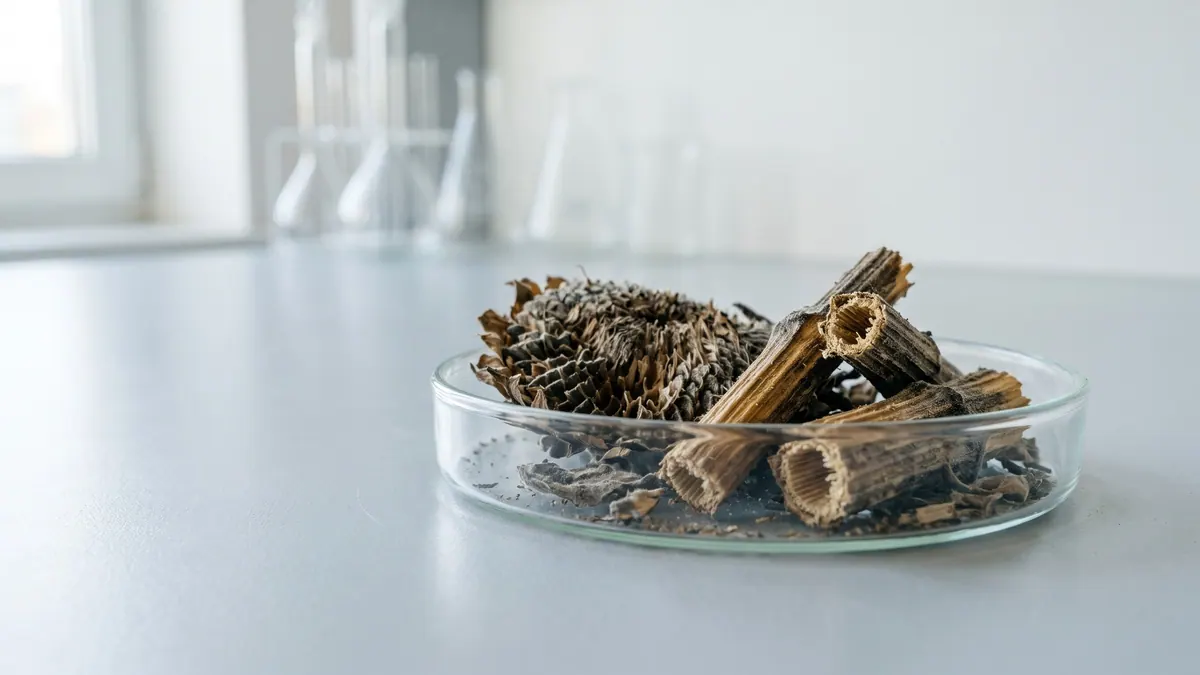
Sunflower residues (heads, stalks) — BMP: 2 studies, weighted mean 169 m³ CH₄/t VS
Sunflower stalks and heads left after seed harvest are dry, lignified biomass with a high C/N ratio. The dataset rests on a single study, so the data are indicative only.
Illustration: FeedstockData (AI, Google Gemini)
- Weighted mean
- 169m³ CH₄/t VS
- Range
- 128–211m³ CH₄/t VS
- Records
- 2single study (2 samples)
- Publications
- 1source
- Temperatures
- —of the test
Methane in biogas
Medium methane content · ≈ 5.2 kWh/m³ of biogas
estimate from the substrate type The collected studies contain no measurement. The interval follows from the approximate composition (carbohydrate-dominated (no protein or fat characteristics)) and the yields of compound groups according to FNR.
Rating for biogas plants
not rated — editorial rating for biogas plants
Not rated: no dry matter or volatile solids in the data. We calculate the rating when the dry matter and volatile solids of the material are known.
Add to the co-digestion calculator CSV data
BMP curves from 2 studies
Weighted mean Individual records
Dashed lines are a model curve (first-order kinetics, B(t) = B₀·(1 − e−kt)); the end point comes from the publication. All curves are model curves.
Cumulative methane production over the test [m³ CH₄/t VS]. The thick line is the weighted mean of all records (169); dots mark the end values given in the publications. Point at the chart to read values; click a legend item to hide or show a record.
Records and sources
Download CSV| Source | BMP m³ CH₄/t VS | Temperature | Sample | Curve |
|---|---|---|---|---|
| Zhurka et al. (2019) · 1 DOI | 128 | — | raw sunflower stalks | end point (model curve) |
| Zhurka et al. (2019) · 2 DOI | 211 | — | raw sunflower heads | end point (model curve) |
| Weighted mean | 169 | arithmetic mean 169, SD 58 | ||
Process properties
Advantages
- Methane potential in the database: weighted mean 169 m³ CH₄/t VS (median 169; range 128–211; 2 records from 1 sources).
- Mild alkaline treatment (55 °C, 24 h, 4 g NaOH/100 g DM) raised the BMP of flower heads in a batch test (Zhurka 2019).
Drawbacks and risks
- Alkaline treatment improved results in batch, but in continuous mode it had a negligible or negative effect (Zhurka 2019) — there is no guarantee of scaling up.
Co-digestion — what to combine it with, what to watch out for
- caution
substrates: fat-rich — e.g. Food waste, Spent coffee grounds, Primary sludge, Sunflower seeds, Olive pomace / olive mill solid waste
Accumulating fat with other sources increases the risk of LCFA.[1][2]
Dosing
No source-based dose limits; the CSTR results suggest cautious dosing with NaOH treatment.
Introduce gradually, starting with a small dose and monitoring the process (e.g. FOS/TAC, pH, gas composition).
Practical requirements
- Shred: shredding increases the surface available for degradation and speeds it up, but does not necessarily raise the final gas yield (FNR 2010, Ch. 3 “Triturado”).
Sources of the process data
- Chen, Y.; Cheng, J.J.; Creamer, K.S. (2008) Inhibition of anaerobic digestion process: A review. Bioresource Technology
- Palatsi, J. et al. (2009) Strategies for recovering inhibition caused by long chain fatty acids on anaerobic thermophilic biogas reactors. Bioresource Technology
- Zhurka, M.; Spyridonidis, A.; Vasiliadou, I.A.; Stamatelatou, K. (2019) Biogas Production from Sunflower Head and Stalk Residues: Effect of Alkaline Pretreatment. Molecules 25(1), 164
- Hendriks, A.T.W.M.; Zeeman, G. (2009) Pretreatments to enhance the digestibility of lignocellulosic biomass. Bioresource Technology
- Weiland, P. (2010) Biogas production: current state and perspectives. Applied Microbiology and Biotechnology
- FNR (2010). Guía sobre el Biogás – Desde la producción hasta el uso (hiszp. wydanie „Leitfaden Biogas”, GIZ 2013)
The co-digestion calculator will assess a specific mixture containing this substrate.
What it is and where it comes from
After the sunflower seed harvest, thick, lignified stalks and heads with remnants of seed coats are left in the field. In Poland, sunflower for seed is grown on a limited area, so the stream of this biomass is smaller than in the countries of southern and eastern Europe. The residues are usually chopped and ploughed in. The dataset covers one study in which raw stalks and heads were examined separately.
Properties relevant to digestion
Sunflower stalks are stiff and rich in lignocellulose, and in the dry state they have a high dry matter content and a low protein share. The heads contain more soft structures and fine seed remnants, which changes their behaviour in the digester. The shared characteristics are slow hydrolysis, a tendency to float and a high C/N ratio, which requires nitrogen supplementation. Chopping is essential, and where stalks form a large share, mixing is important. Seed remnants in the heads may contribute a small amount of fat, which is not a problem at low shares but is worth bearing in mind.
How to read the spread of results
The records from one publication describe different fractions, so they are not replicates of the same material. The spread between them reflects the difference in structure between stalks and heads, and not measurement uncertainty. Actual batches from the field will be a mixture in a proportion that depends on the harvesting technique, cultivar and timing. Moisture content and degree of over-drying, the way the sample was chopped and the test parameters are also relevant. The absence of temperature information in the source further hampers comparison with other substrates.
In biogas plant practice
Sunflower residues are a niche substrate. Collecting them from the field requires additional passes, and chopping and transport cost money, whereas when ploughed in they replenish soil organic matter. If their use is being considered, it makes sense to feed them in a small share together with slurry or another nitrogen-rich substrate, chopped to a form that allows the feed to be pumped or fed in. The yield should be verified with your own BMP test, because data from a single publication are not sufficient for planning. Given the small database and the niche character of this material, the decision to use it should be preceded by a BMP test and a simple calculation of the costs of harvesting, transport and chopping, which on many farms compares unfavourably with ordinary ploughing-in.
Methodology in brief
BMP is the amount of methane obtained from volatile solids (VS) in a batch test, given in m³ CH₄ per tonne of VS (numerically the same as NmL CH₄/g VS in the publications) and converted to normal conditions (0 °C, 101.325 kPa). The weighted mean gives each publication a total weight of 1, split equally between its results for the substrate — a paper testing twenty varieties does not outweigh a paper with a single sample. In inter-laboratory programmes the unit is the laboratory (total weight 1), and within it the weight of a test grows with the number of bottles (replicates). Results after pretreatment (e.g. thermal, chemical, enzymatic) are shown separately and are not included in the mean.
Solid lines are curves measured in the tests. Where a publication gives only the final result, we draw a first-order kinetic model, B(t) = B₀·(1 − e−kt): only the end point comes from the publication, and the shape of the curve serves purely as visualisation — do not read the production on a particular day from it. For this substrate k = 0.136 d−1 was assumed (median of rate constants k reported in the sources and/or fitted to the mean measured curves).
The statistics describe the spread of published results — a descriptive compilation, not a meta-analysis or a guarantee of plant yield.
Bibliography
- Zhurka, M.; Spyridonidis, A.; Vasiliadou, I.A.; Stamatelatou, K. (2019). Biogas Production from Sunflower Head and Stalk Residues: Effect of Alkaline Pretreatment. Molecules 25(1), 164. DOI: 10.3390/molecules25010164 DOI
All sources of the site: bibliography.
Other substrates in the group “Straws and crop residues”
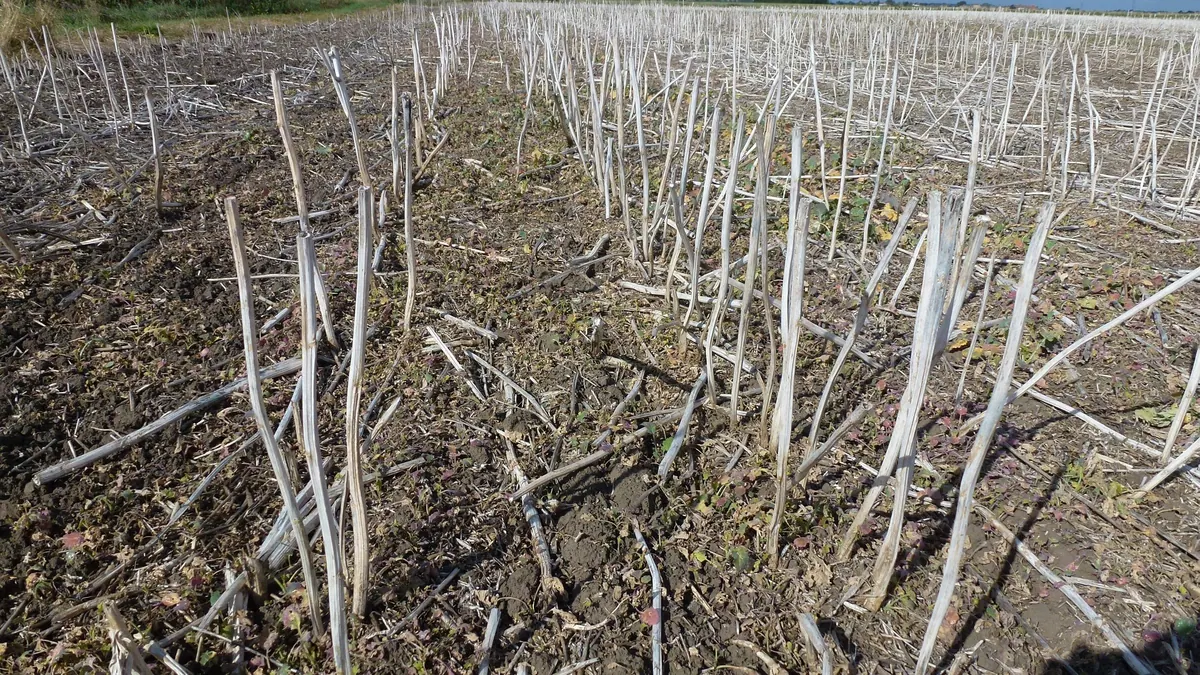
Rapeseed straw — BMP: 2 studies, weighted mean 241 m³ CH₄/t VS
241 m³ CH₄/t VS weighted mean from 2 studies
good — editorial rating for biogas plants≈53 %
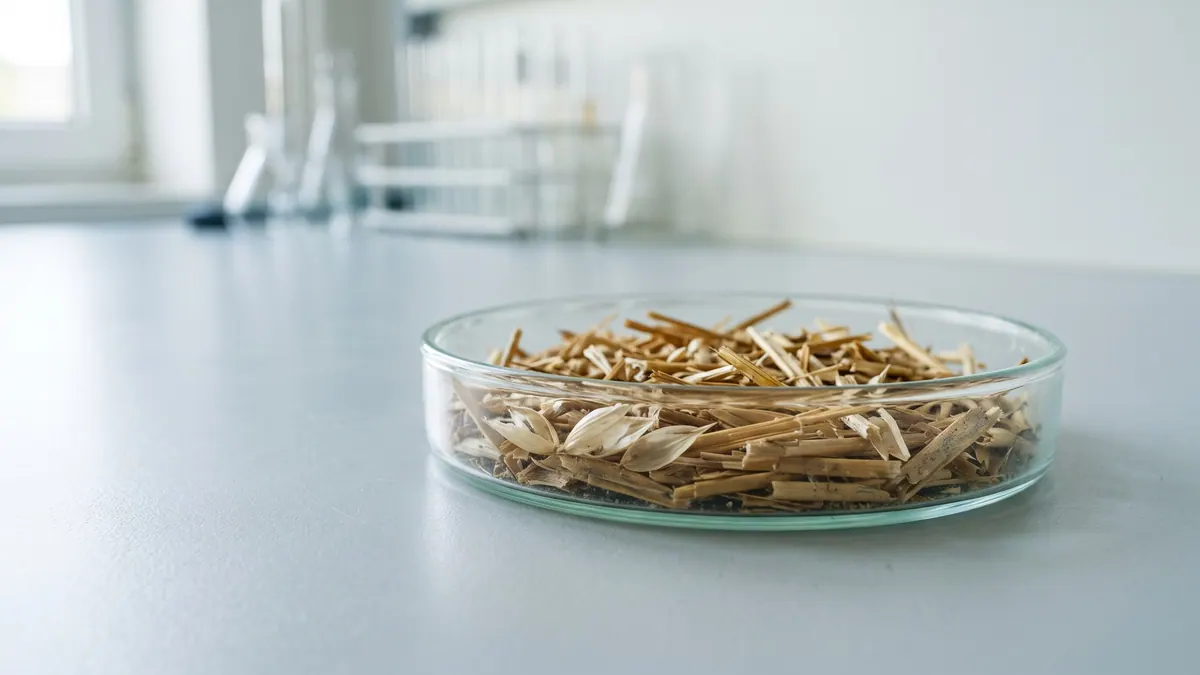
Oat straw — BMP: 2 studies, weighted mean 275 m³ CH₄/t VS
275 m³ CH₄/t VS weighted mean from 2 studies
≈52 %
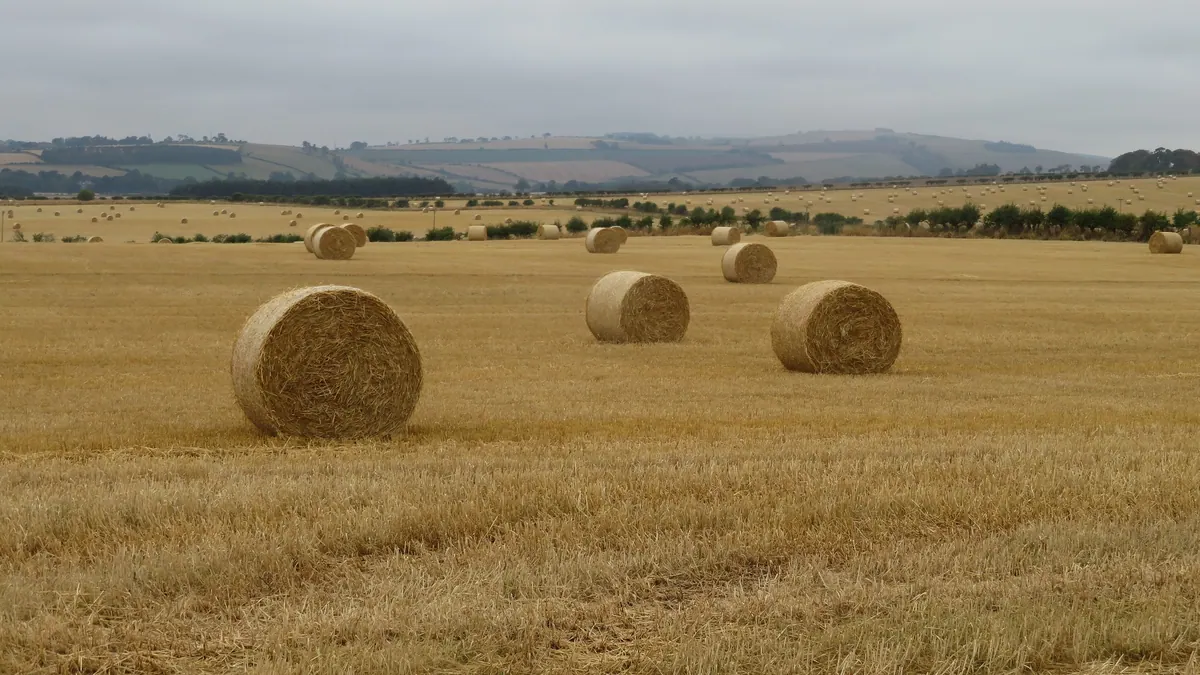
Barley straw — BMP: 8 studies, weighted mean 238 m³ CH₄/t VS
238 m³ CH₄/t VS weighted mean from 8 studies
good — editorial rating for biogas plants≈52 %
Cereal straw (unspecified) — BMP: 25 studies, weighted mean 268 m³ CH₄/t VS
268 m³ CH₄/t VS weighted mean from 25 studies
good — editorial rating for biogas plants≈51 %