

BMP testingFats, oils and animal by-products
Fats, oils and grease (FOG) — BMP: 5 studies, weighted mean 488 m³ CH₄/t VS
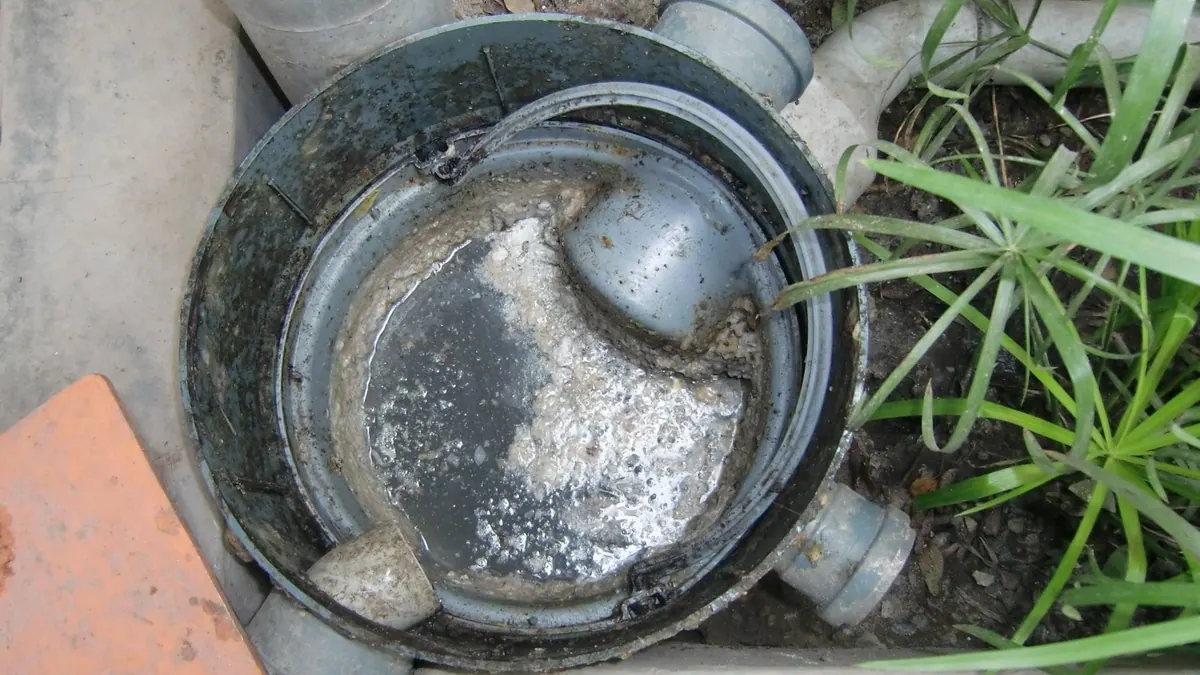
Fats from separators (FOG) are a waste from the treatment of catering and food-industry wastewater. They have a high energy potential, but require careful dosing and infrastructure.
Photo SuSanA Secretariat / Wikimedia Commons, licence CC BY 2.0, source file; changes: cropping

- Weighted mean
- 488m³ CH₄/t VS
- Range
- 350–688m³ CH₄/t VS
- Records
- 5studies
- Publications
- 3sources
- Temperatures
- 35 °Cof the test
Methane in biogas
High methane content · ≈ 6.3 kWh/m³ of biogas
estimate from the substrate type The collected studies contain no measurement. The interval follows from the approximate composition (carbohydrate-dominated (no protein or fat characteristics); fat-rich (process classification)) and the yields of compound groups according to FNR.
Rating for biogas plants
not rated — editorial rating for biogas plants
Not rated: no dry matter or volatile solids in the data. We calculate the rating when the dry matter and volatile solids of the material are known.
Add to the co-digestion calculator CSV data
BMP curves from 5 studies
Weighted mean Individual records
Dashed lines are a model curve (first-order kinetics, B(t) = B₀·(1 − e−kt)); the end point comes from the publication. All curves are model curves.
Cumulative methane production over the test [m³ CH₄/t VS]. The thick line is the weighted mean of all records (488); dots mark the end values given in the publications. Point at the chart to read values; click a legend item to hide or show a record.
Records and sources
Download CSV| Source | BMP m³ CH₄/t VS | Temperature | Sample | Curve |
|---|---|---|---|---|
| Rico et al. (2014) · 1 DOI | 350 | 35 °C · mesophilic | sludge from the fat separator of a dairy factory (SL2) | end point (model curve) |
| Rico et al. (2014) · 2 DOI | 388 | 35 °C · mesophilic | sludge from the fat separator of a dairy factory (SL1) | end point (model curve) |
| Holliger et al. (2017) DOI | 688 | — | Oil-fat remover sludge | end point (model curve) |
| Labatut et al. (2011) · 1 DOI | 402 | 35 °C · mesophilic | FOG | end point (model curve) |
| Labatut et al. (2011) · 2 DOI | 413 | 35 °C · mesophilic | FOG | end point (model curve) |
| Weighted mean | 488 | arithmetic mean 448, SD 136 | ||
Typical composition
- Volatile solids (VS)
- 87 % DM (range 86–88)
Median and range of the determinations reported in the publications behind this substrate's BMP records (read from: MY-D); dry matter: 0 determinations, volatile solids: 2 determinations. No DM in the sources – the calculator has to ask for a value.
Sources: Labatut et al. (2011).
The composition of the raw material varies between batches — for plant calculations use an analysis of your own sample. The calculator inserts typical values automatically.
Process properties
Advantages
- Methane potential in the Substraty.pl BMP dataset: weighted mean 488.3 m³ CH₄/t VS (SD 136.1; 5 records, 3 sources).
- Sludge from grease separators fed into a wastewater treatment plant digester increased methane yield by 9-27% at a share of 10-30% VS (Davidsson et al. 2008).
- A waste that is available regularly and often collected for a fee - an economic benefit given suitable infrastructure (Long et al. 2012).
Drawbacks and risks
- As the sole substrate it did not give stable methane production in continuous pilot digestion (Davidsson et al. 2008).
- LCFA from hydrolysis and detergents/cleaning agents in the waste inhibit methanogenesis and promote foaming (Long et al. 2012; Chen et al. 2008).
- Composition highly variable between deliveries (Long et al. 2012) - the dose must be adjusted after batch analysis.
Co-digestion — what to combine it with, what to watch out for
- combines well
substrates: high alkalinity (buffer) — e.g. Cattle manure, Pig slurry, Cattle slurry, Duck slurry, Rumen and digestive tract content
Slurry/sewage sludge as a base dilutes LCFA; DAF/FOG was digested stably in a mix with pig slurry.[1][2]
- combines well
- avoid
substrates: fat-rich — e.g. Food waste, Spent coffee grounds, Primary sludge, Sunflower seeds, Olive pomace / olive mill solid waste
Adding a further fat stream (oil, animal fat, flotation sludge) to the same dose accumulates LCFA.[4]
Dosing
Indicative limit from the literatureup to 30% VS of the feed[2]
Basis: share of separator sludge in the VS of the wastewater treatment plant digester feed. Davidsson et al. (2008): adding 10–30% VS of separator sludge to sewage sludge increased methane yield by 9–27% at pilot scale. 30% is the highest of the shares tested, not an inhibition threshold; it is not stated what happens above that. The data relate to sewage sludge as the base; in an agricultural biogas plant start many times lower and increase gradually.
Introduce gradually, starting with a small dose and monitoring the process (e.g. FOS/TAC, pH, gas composition).
Practical requirements
- ABP cat. 3 (Art. 10 of Reg. 1069/2009; admitted to biogas plants by Art. 14): hygienisation before the digester in a mandatory unit: shredding to a maximum of 12 mm, temperature throughout the mass of at least 70 °C for at least 60 min without interruption (Reg. 142/2011, Annex V Ch. I Section 1 and Ch. III Section 1); the installation requires approval by the competent authority (Art. 24(1)(g) of Reg. 1069/2009).
- Do not feed hygienised substrate into the digester hot (FNR 2010, Ch. 3: hygienisation).
- Provide for removal of sand and heavy contaminants: sand is often strongly bound to organic matter and is released only in the digester, and sediments reduce its usable capacity, so a scraper or bottom drain is needed (FNR 2010, Ch. 3).
Sources of the process data
- Creamer et al. (2010). Stable thermophilic anaerobic digestion of dissolved air flotation (DAF) sludge by co-digestion with swine manure. Bioresour. Technol.
- Davidsson et al. (2008). Co-digestion of grease trap sludge and sewage sludge. Waste Manag.
- Silvestre et al. (2014). Thermophilic anaerobic co-digestion of sewage sludge with grease waste: effect of long chain fatty acids in the methane yield and its dewatering properties. Appl. Energy
- Long et al. (2012). Anaerobic co-digestion of fat, oil, and grease (FOG): A review of gas production and process limitations. Process Saf. Environ. Prot.
- Chen, Cheng, Creamer (2008). Inhibition of anaerobic digestion process: A review. Bioresour. Technol.
- Rozporządzenie (WE) nr 1069/2009 określające przepisy sanitarne dotyczące produktów ubocznych pochodzenia zwierzęcego (art. 9, 10, 12–14, 24)
- Rozporządzenie Komisji (UE) nr 142/2011 wykonujące rozporządzenie (WE) nr 1069/2009 (zał. IV rozdz. III, zał. V rozdz. I i III)
- FNR (2010). Guía sobre el Biogás – Desde la producción hasta el uso (hiszp. wydanie „Leitfaden Biogas”, GIZ 2013)
The co-digestion calculator will assess a specific mixture containing this substrate.
What it is and where it comes from
FOG (fats, oils and grease) is fats, oils and grease retained in grease separators in restaurants, catering establishments, dairies, slaughterhouses and other food plants. They arrive there with wastewater and separate as a layer on the surface, which is periodically removed. The dataset contains sludge from the grease separator of a dairy, sludge from grease traps and a material labelled generally as FOG.
Properties relevant to digestion
The material is a mixture of fats, water, food residues and contaminants. The high lipid content gives a large gas potential, but the long-chain fatty acids released in hydrolysis can inhibit methanogenesis and lead to flotation of biomass and foaming. Moreover, depending on the source, the sludge contains salts, detergents and cleaning agents, and sometimes also odorous decomposition products. At low temperature the fat solidifies, so heating and good mixing are needed. It is usually dosed slowly and in a mixture with other substrates.
How to read the spread of results
The records compiled come from different suppliers: a dairy, a plant with a grease trap and other sources, and in some studies the temperature was not given. The composition, water content, fat share and degree of contamination differ between batches, and even within a single separator over the course of a year. The test result also depends on the emulsification of the sample, the substrate-to-inoculum ratio, adaptation of the microflora to fats and the length of the test. Conversion to volatile solids does not remove these differences.
In biogas plant practice
FOG is an attractive substrate for co-digestion, because it gives a lot of biogas, and its suppliers usually pay for collection. It requires a heated reception tank, removal of solid contaminants and very gradual dosing, with control of volatile fatty acids and foaming. As a waste from catering or food processing it is subject to the regulations on wastes or animal by-products, depending on origin; this concerns classification, documentation, hygienisation and the permits held. The rules must be checked for the specific plant and type of supplier. Regardless of the attractive reception fee, the handling costs must be calculated: heating, cleaning of tanks, removal of contaminants and possible downtime after overloading, because it is these that often decide the profitability of this substrate.
Methodology in brief
BMP is the amount of methane obtained from volatile solids (VS) in a batch test, given in m³ CH₄ per tonne of VS (numerically the same as NmL CH₄/g VS in the publications) and converted to normal conditions (0 °C, 101.325 kPa). The weighted mean gives each publication a total weight of 1, split equally between its results for the substrate — a paper testing twenty varieties does not outweigh a paper with a single sample. In inter-laboratory programmes the unit is the laboratory (total weight 1), and within it the weight of a test grows with the number of bottles (replicates). Results after pretreatment (e.g. thermal, chemical, enzymatic) are shown separately and are not included in the mean.
Solid lines are curves measured in the tests. Where a publication gives only the final result, we draw a first-order kinetic model, B(t) = B₀·(1 − e−kt): only the end point comes from the publication, and the shape of the curve serves purely as visualisation — do not read the production on a particular day from it. For this substrate k = 0.091 d−1 was assumed (no kinetic data for the group – the median of all available rate constants k (93 values) was used).
The statistics describe the spread of published results — a descriptive compilation, not a meta-analysis or a guarantee of plant yield.
Bibliography
- Rico, C.; Diego, R.; Valcarce, A.; Rico, J.L. (2014). Biogas Production from Various Typical Organic Wastes Generated in the Region of Cantabria (Spain): Methane Yields and Co-Digestion Tests. Smart Grid and Renewable Energy 05(06), 128–136. DOI: 10.4236/sgre.2014.56012 DOI
- Holliger, C.; Fruteau de Laclos, H.; Hack, G. (2017). Methane Production of Full-Scale Anaerobic Digestion Plants Calculated from Substrate’s Biomethane Potentials Compares Well with the One Measured On-Site. Frontiers in Energy Research 5, 12. DOI: 10.3389/fenrg.2017.00012 DOI
- Labatut, R.A.; Angenent, L.T.; Scott, N.R. (2011). Biochemical methane potential and biodegradability of complex organic substrates. Bioresource Technology 102(3), 2255–2264. DOI: 10.1016/j.biortech.2010.10.035 DOI
All sources of the site: bibliography.
Other substrates in the group “Fats, oils and animal by-products”
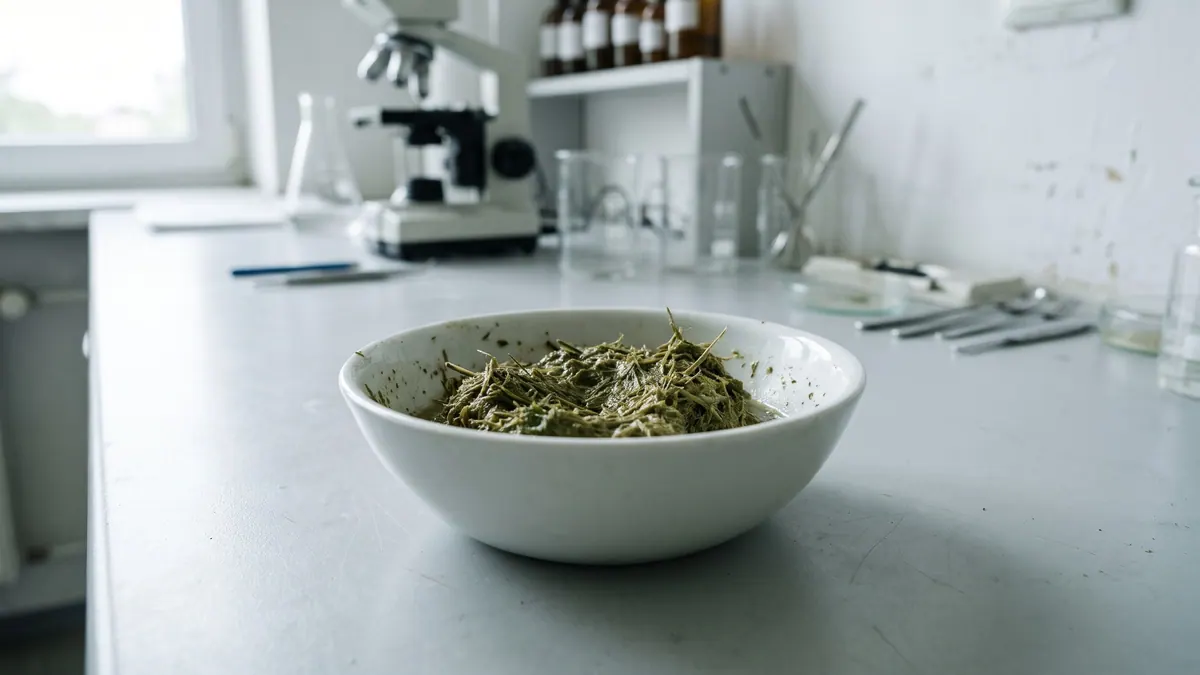
Rumen and digestive tract content — BMP: 5 studies, weighted mean 280 m³ CH₄/t VS
280 m³ CH₄/t VS weighted mean from 5 studies
good — editorial rating for biogas plants≈54 %

Poultry feathers — BMP: 3 studies, weighted mean 181 m³ CH₄/t VS
181 m³ CH₄/t VS weighted mean from 3 studies
≈58 %
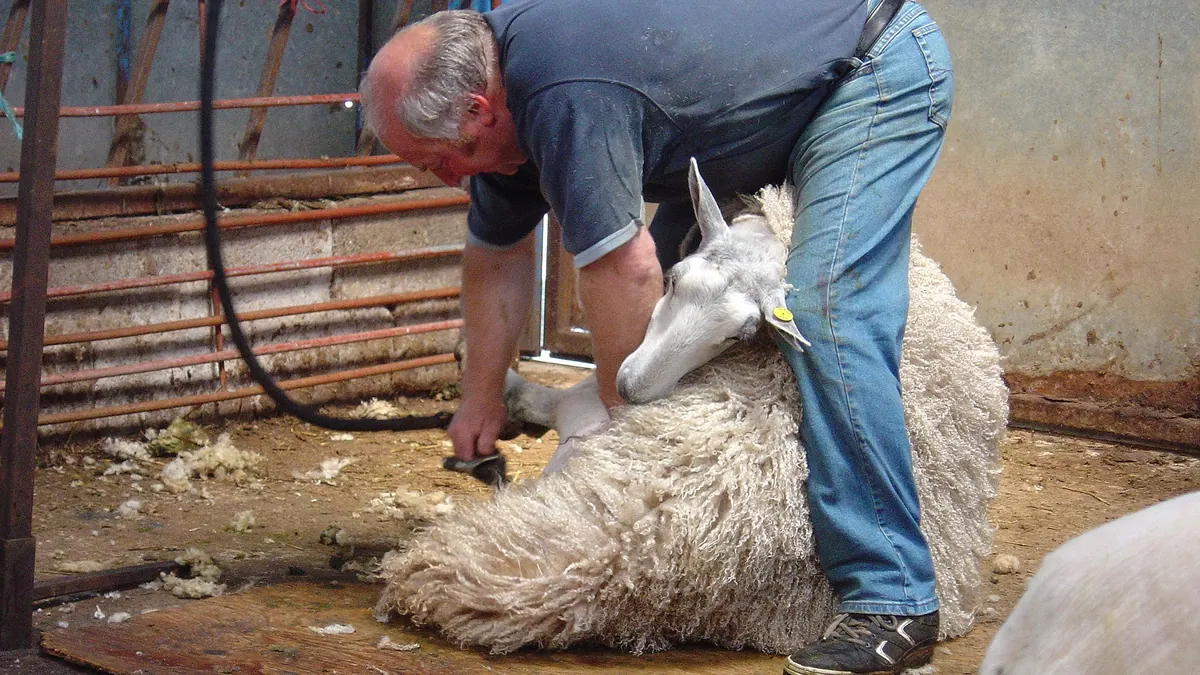
Raw sheep wool — BMP: 3 studies, weighted mean 37 m³ CH₄/t VS
37 m³ CH₄/t VS weighted mean from 3 studies
≈58 %
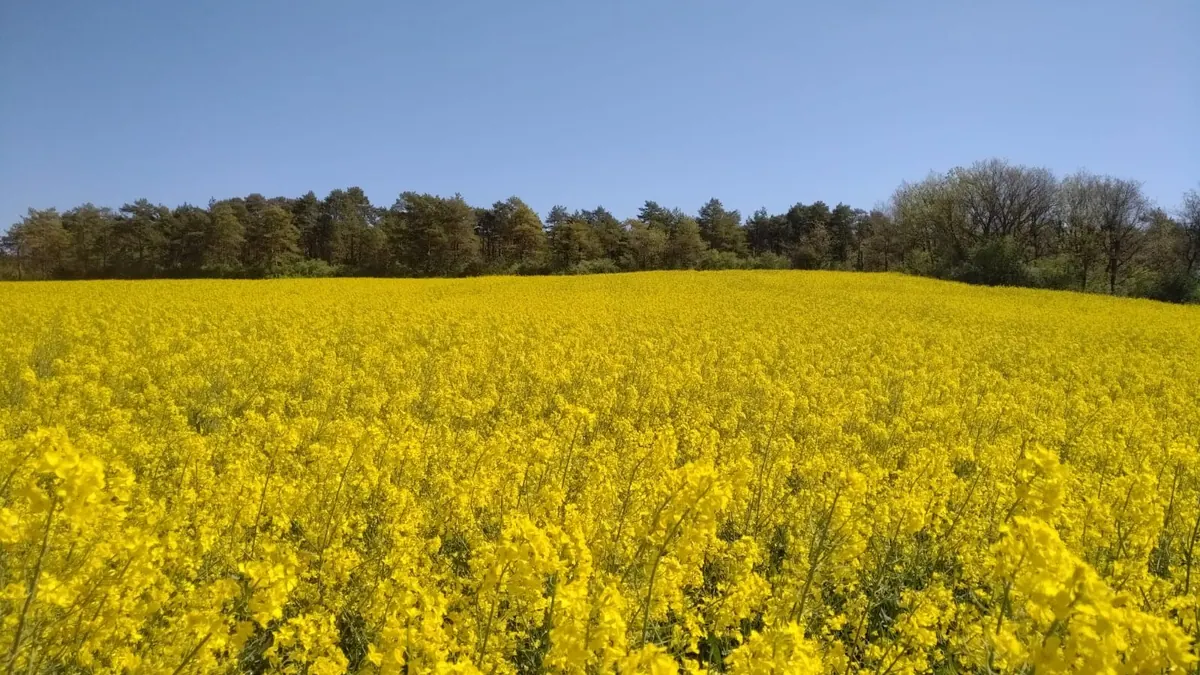
Vegetable oil (rapeseed, sunflower) — BMP: 4 studies, weighted mean 777 m³ CH₄/t VS
777 m³ CH₄/t VS weighted mean from 4 studies
≈63 %