

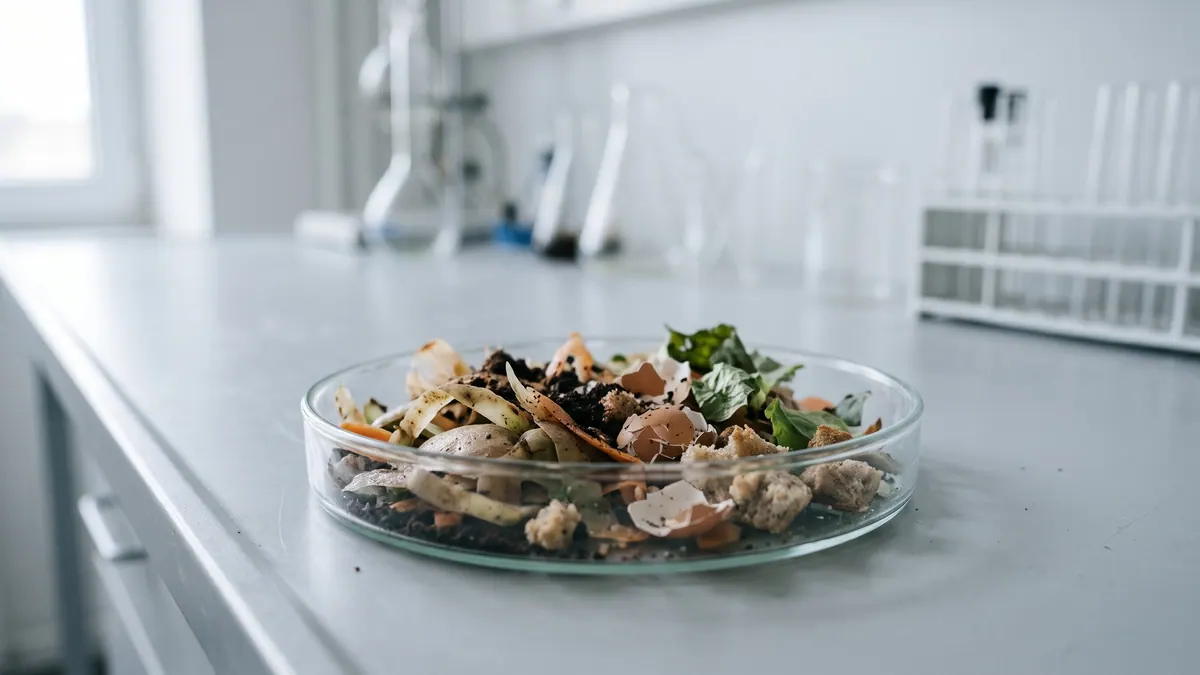
BMP testingMunicipal and green waste, paper and textiles
Organic fraction of municipal solid waste — BMP: 13 studies, weighted mean 187 m³ CH₄/t VS
Municipal biowaste (OFMSW) is a variable mixture of kitchen waste, garden waste and paper; the result depends on the method of separation and the share of contaminants.
rating: neutralCH₄ ≈ 58 % (estimate)
Illustration: FeedstockData (AI, Google Gemini)
- Weighted mean
- 187m³ CH₄/t VS
- Range
- 51–493m³ CH₄/t VS
- Records
- 13studies
- Publications
- 6sources
- Temperatures
- 35 °C, 37 °C, 38 °Cof the test
Methane in biogas
Medium methane content · ≈ 5.8 kWh/m³ of biogas
estimate from the substrate type The collected studies contain no measurement. The interval follows from the approximate composition (protein-rich (process classification)) and the yields of compound groups according to FNR.
Rating for biogas plants
neutral — editorial rating for biogas plantsNo clear advantages — worth charging a fee for accepting it
Potential per tonne of fresh matter: moderate (46 m³ CH₄/t); process risk: protein / nitrogen, acidification. Handling costs: physical contaminants (packaging, plastics), sand, stones, shells.
Why? Rating factors
Potential per tonne +1
- +1potential 46 m³ CH₄/t fresh matter (BMP 187 × DM 30.9 % × VS 79.3 %)
Process stability −1.25
- −1protein / nitrogen: risk of ammonia inhibition at higher shares
- −0.25acidification: rapid degradation / acidic pH, risk of VFA accumulation, needs buffering
Handling and costs −1.5
- −1physical contaminants (packaging, plastics) — depackaging and separation
- −0.5sand, stones, shells — sediment in the digester
Total points: −1.75 · thresholds: ≥ 2.5 very good, ≥ 1 good, below — neutral; negative with cumulative process risk.
Add to the co-digestion calculator CSV data
BMP curves from 13 studies
Weighted mean Individual records
Dashed lines are a model curve (first-order kinetics, B(t) = B₀·(1 − e−kt)); the end point comes from the publication. All curves are model curves.
Cumulative methane production over the test [m³ CH₄/t VS]. The thick line is the weighted mean of all records (187); dots mark the end values given in the publications. Point at the chart to read values; click a legend item to hide or show a record.
Show the remaining records in the legend (1)
Records and sources
Download CSV| Source | BMP m³ CH₄/t VS | Temperature | Sample | Curve |
|---|---|---|---|---|
| Prajapati et al. (2018) DOI | 203 | — | organic fraction of municipal solid waste (OFMSW) | end point (model curve) |
| Cu et al. (2014) DOI | 51 | 37 °C · mesophilic | household waste | end point (model curve) |
| Nallathambi Gunaseelan (1997) · 1 DOI | 205 | 35 °C · mesophilic | hand-sorted organic fraction (orig.: “hand sorted OFMSW”): value quoted in a literature review | end point (model curve) |
| Nallathambi Gunaseelan (1997) · 2 DOI | 215 | 35 °C · mesophilic | mechanically sorted organic fraction (orig.: “mechanicaly sorted OFMSW”): value quoted in a literature review | end point (model curve) |
| Nallathambi Gunaseelan (1997) · 3 DOI | 222 | 35 °C · mesophilic | mechanically sorted organic fraction (orig.: “mechanicaly sorted OFMSW”): value quoted in a literature review | end point (model curve) |
| Kolbl (2014) · 1 | 201 | 38 °C · mesophilic | organic waste · pretreatment: particle size reduction/sample preparation (MY-D: physical treatment) | end point (model curve) |
| Kolbl (2014) · 2 | 310 | 38 °C · mesophilic | organic waste · pretreatment: particle size reduction/sample preparation (MY-D: physical treatment) | end point (model curve) |
| Kolbl (2014) · 3 | 319 | 38 °C · mesophilic | organic waste · pretreatment: particle size reduction/sample preparation (MY-D: physical treatment) | end point (model curve) |
| Kolbl (2014) · 4 | 340 | 38 °C · mesophilic | organic waste · pretreatment: particle size reduction/sample preparation (MY-D: physical treatment) | end point (model curve) |
| Kolbl (2014) · 5 | 473 | 38 °C · mesophilic | organic waste · pretreatment: particle size reduction/sample preparation (MY-D: physical treatment) | end point (model curve) |
| Kolbl (2014) · 6 | 493 | 38 °C · mesophilic | organic waste · pretreatment: particle size reduction/sample preparation (MY-D: physical treatment) | end point (model curve) |
| Myszograj (2019) DOI | 97 | — | Raw bio-waste | end point (model curve) |
| Nielfa et al. (2015) DOI | 202 | — | OFMSW | end point (model curve) |
| Weighted mean | 187 | arithmetic mean 256, SD 129 | ||
Typical composition
- Dry matter (DM)
- 30.9% (range 21.8–57.5)
- Volatile solids (VS)
- 79.3 % DM (range 67.7–98.6)
Median and range of the determinations reported in the publications behind this substrate's BMP records (read from: MY-D); dry matter: 7 determinations, volatile solids: 10 determinations.
Sources: Cu et al. (2014); Nallathambi Gunaseelan (1997); Kolbl (2014).
The composition of the raw material varies between batches — for plant calculations use an analysis of your own sample. The calculator inserts typical values automatically.
Process properties
Advantages
- Methane potential in the Substraty.pl BMP set: weighted mean 187.2 m³ CH₄/t VS (SD 128.6; 13 records, 6 sources).
Drawbacks and risks
- Contaminants: plastics, glass, metals (Mata-Alvarez et al. 2000).
- Rapid acidification and ammonia from protein (Zhang et al. 2007).
- Seasonality of the share of green waste.
Co-digestion — what to combine it with, what to watch out for
- combines well
substrates: high alkalinity (buffer) — e.g. Cattle manure, Pig slurry, Cattle slurry, Duck slurry, Rumen and digestive tract content
Dosing
No source percentage. Start from a low share after separating contaminants.
Introduce gradually, starting with a small dose and monitoring the process (e.g. FOS/TAC, pH, gas composition).
Practical requirements
- Remove foreign contaminants before dosing: material from biowaste may contain interfering substances, and the co-substrate should be free of them (FNR 2010, Ch. 3).
Sources of the process data
- Hagos et al. (2017). Anaerobic co-digestion process for biogas production: progress, challenges and perspectives. Renew. Sustain. Energy Rev.
- Weiland, P. (2010) Biogas production: current state and perspectives. Applied Microbiology and Biotechnology
- Mata-Alvarez, Mace, Llabres (2000). Anaerobic digestion of organic solid wastes. An overview of research achievements and perspectives. Bioresour. Technol.
- Zhang et al. (2007). Characterization of food waste as feedstock for anaerobic digestion. Bioresour. Technol.
- FNR (2010). Guía sobre el Biogás – Desde la producción hasta el uso (hiszp. wydanie „Leitfaden Biogas”, GIZ 2013)
The co-digestion calculator will assess a specific mixture containing this substrate.
What it is and where it comes from
Municipal biowaste, referred to in the literature as OFMSW (organic fraction of municipal solid waste), comprises kitchen waste, garden waste, plant residues and other biodegradable materials originating from households, trade and catering. It may be collected separately at source or separated from mixed waste in mechanical-biological treatment plants. In the European Union, the obligation to collect biowaste separately or to recycle it at source has applied to Member States since the end of 2023, so in Poland this stream is growing. The dataset contains samples of household waste, hand-sorted and mechanically sorted fractions, and material from India.
Properties relevant to digestion
The composition includes readily degradable residues of fruit, vegetables and food, as well as components that are harder to degrade: twigs, paper, textiles and bedding. The dry matter content is moderate, and the VS share depends on mineral contamination. Foreign contaminants (plastics, glass, metals, stones, sand) must be removed, because they damage equipment and end up in the digestate. Biowaste acidifies quickly, and a high protein or fat content (meat scraps) increases the risk of ammonia and VFA. The share of green waste changes seasonally.
How to read the spread of results
Results are spread very widely, because "biowaste" is not a homogeneous material but a variable mixture. The country and food culture, the time of year, the collection system (brown bins or sorting of mixed waste), the share of green waste and paper, the degree of contamination, and also sample preparation (grinding, screening, drying) all matter. A mechanically sorted fraction usually differs from one collected separately. In addition there are the test parameters: temperature, inoculum, substrate-to-inoculum ratio, duration, and the fact that some values are quoted from reviews.
In biogas plant practice
Biowaste is the basic raw material of waste-treatment biogas plants and municipal installations (in Poland they operate, among other settings, within regional municipal waste treatment installations). It requires depackaging or sorting, size reduction, sand removal and often hygienisation. Kitchen and catering waste containing components of animal origin is subject to the regulations on animal by-products: hygienisation is required, among other things, and the installation must have the appropriate approval. Biowaste is waste within the meaning of the Waste Act and is subject to waste codes from group 20, and the digestate must meet the requirements applicable to wastes or fertilisers.
Methodology in brief
BMP is the amount of methane obtained from volatile solids (VS) in a batch test, given in m³ CH₄ per tonne of VS (numerically the same as NmL CH₄/g VS in the publications) and converted to normal conditions (0 °C, 101.325 kPa). The weighted mean gives each publication a total weight of 1, split equally between its results for the substrate — a paper testing twenty varieties does not outweigh a paper with a single sample. In inter-laboratory programmes the unit is the laboratory (total weight 1), and within it the weight of a test grows with the number of bottles (replicates). Results after pretreatment (e.g. thermal, chemical, enzymatic) are shown separately and are not included in the mean.
Solid lines are curves measured in the tests. Where a publication gives only the final result, we draw a first-order kinetic model, B(t) = B₀·(1 − e−kt): only the end point comes from the publication, and the shape of the curve serves purely as visualisation — do not read the production on a particular day from it. For this substrate k = 0.110 d−1 was assumed (median of rate constants k reported in the sources and/or fitted to the mean measured curves).
The statistics describe the spread of published results — a descriptive compilation, not a meta-analysis or a guarantee of plant yield.
Bibliography
- Prajapati, K.K.; Pareek, N.; Vivekanand, V. (2018). Pretreatment and Multi-Feed Anaerobic Co-digestion of Agro-Industrial Residual Biomass for Improved Biomethanation and Kinetic Analysis. Frontiers in Energy Research 6, 111. DOI: 10.3389/fenrg.2018.00111 DOI
- Cu, T.T.T.; Nguyen, T.X.; Triolo, J.M.; Pedersen, L.; Le, V.D.; Le, P.D.; Sommer, S.G. (2014). Biogas Production from Vietnamese Animal Manure, Plant Residues and Organic Waste: Influence of Biomass Composition on Methane Yield. Asian-Australasian Journal of Animal Sciences 28(2), 280–289. DOI: 10.5713/ajas.14.0312 DOI
- Nallathambi Gunaseelan, V. (1997). Anaerobic digestion of biomass for methane production: A review. Biomass and Bioenergy 13(1-2), 83–114. DOI: 10.1016/s0961-9534(97)00020-2 DOI
- Kolbl, S. (2014). Izboljšava anaerobne presnove blata iz komunalnih čistilnih naprav in lignoceluloznih substratov pri pridobivanju bioplina. Rozprawa doktorska, Univerza v Ljubljani, Fakulteta za gradbeništvo in geodezijo.
- Myszograj, S. (2019). Biogas and Methane Potential of Pre-Thermally Disintegrated Bio-Waste. Energies 12(20), 3880. DOI: 10.3390/en12203880 DOI
- Nielfa, A.; Cano, R.; Fdz-Polanco, M. (2015). Theoretical methane production generated by the co-digestion of organic fraction municipal solid waste and biological sludge. Biotechnology Reports 5, 14–21. DOI: 10.1016/j.btre.2014.10.005 DOI
All sources of the site: bibliography.
Other substrates in the group “Municipal and green waste, paper and textiles”
Grass clippings — BMP: 13 studies, weighted mean 272 m³ CH₄/t VS
272 m³ CH₄/t VS weighted mean from 13 studies
neutral — editorial rating for biogas plants≈52 %
Newspaper — BMP: 7 studies, weighted mean 81 m³ CH₄/t VS
81 m³ CH₄/t VS weighted mean from 7 studies
neutral — editorial rating for biogas plants≈52 %

Magazine paper — BMP: 6 studies, weighted mean 243 m³ CH₄/t VS
243 m³ CH₄/t VS weighted mean from 6 studies
good — editorial rating for biogas plants≈51 %
Tissue and toilet paper — BMP: 2 studies, weighted mean 372 m³ CH₄/t VS
372 m³ CH₄/t VS weighted mean from 2 studies
≈51 %