

BMP testingAlgae and aquatic plantssingle study (2 samples)
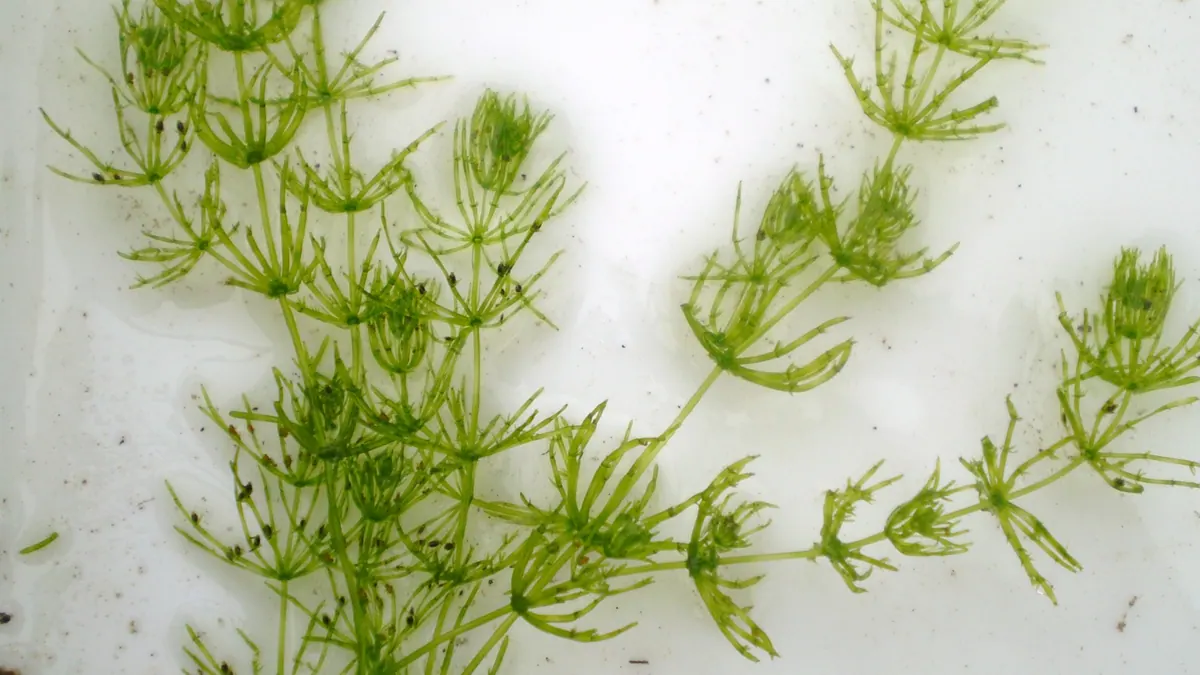
Submerged lake macrophytes (Chara, water celery) — BMP: 2 studies, weighted mean 385 m³ CH₄/t VS
Submerged aquatic plants from lakes (Chara stoneworts and water celery) are biomass from the removal of vegetation from water bodies; the records come from a single study.
Photo Show_ryu / Wikimedia Commons, licence CC BY-SA 3.0, source file; changes: cropping

- Weighted mean
- 385m³ CH₄/t VS
- Range
- 385–386m³ CH₄/t VS
- Records
- 2single study (2 samples)
- Publications
- 1source
- Temperatures
- 35 °Cof the test
Methane in biogas
Medium methane content · ≈ 5.2 kWh/m³ of biogas
estimate from the substrate type The collected studies contain no measurement. The interval follows from the approximate composition (carbohydrate-dominated (no protein or fat characteristics)) and the yields of compound groups according to FNR.
Rating for biogas plants
not rated — editorial rating for biogas plants
Not rated: no dry matter or volatile solids in the data. We calculate the rating when the dry matter and volatile solids of the material are known.
Add to the co-digestion calculator CSV data
BMP curves from 2 studies
Weighted mean Individual records
Dashed lines are a model curve (first-order kinetics, B(t) = B₀·(1 − e−kt)); the end point comes from the publication. All curves are model curves.
Cumulative methane production over the test [m³ CH₄/t VS]. The thick line is the weighted mean of all records (385); dots mark the end values given in the publications. Point at the chart to read values; click a legend item to hide or show a record.
Records and sources
Download CSV| Source | BMP m³ CH₄/t VS | Temperature | Sample | Curve |
|---|---|---|---|---|
| Labatut et al. (2011) · 1 DOI | 385 | 35 °C · mesophilic | water celery | end point (model curve) |
| Labatut et al. (2011) · 2 DOI | 386 | 35 °C · mesophilic | chara | end point (model curve) |
| Weighted mean | 385 | arithmetic mean 385, SD 1 | ||
Typical composition
- Volatile solids (VS)
- 38 % DM (range 25–51)
Median and range of the determinations reported in the publications behind this substrate's BMP records (read from: MY-D); dry matter: 0 determinations, volatile solids: 2 determinations. No DM in the sources – the calculator has to ask for a value.
Sources: Labatut et al. (2011).
The composition of the raw material varies between batches — for plant calculations use an analysis of your own sample. The calculator inserts typical values automatically.
Process properties
Low confidence: the description is based on general characteristics of the substrate group, not on studies of this material. Treat it as a hint to be verified.
No published process studies
The literature we use does not describe the advantages or drawbacks of digesting this substrate beyond the BMP test results. Below are process characteristics assigned on the basis of the type of material — an editorial classification, not a study result.
- dilutes the feed (low DM)
- low dry matter, dilutes the feed
- seasonal
- seasonal availability — requires storage
- variable composition
- high variability of composition between batches
Dosing
The sources do not give a safe share of this substrate in the feed.
Sources of the process data
- Biochemical methane potential and biodegradability of complex organic substrates
- Crop Characteristics of Aquatic Macrophytes for Use as a Substrate in Anaerobic Digestion Plants—A Study from Germany
- Effects of size and thermophilic pre-hydrolysis of banana peel during anaerobic digestion, and biomethanation potential of key tropical fruit wastes
- Effect of particle size on biogas generation from biomass residues
The co-digestion calculator will assess a specific mixture containing this substrate.
What it is and where it comes from
Submerged macrophytes are aquatic plants growing entirely below the surface of the water. The dataset includes stoneworts (Chara), that is, advanced algae, and a plant named in the study "water celery". Biomass from mass developments is sometimes removed from lakes in order to preserve their recreational and economic functions. It is therefore a waste from reservoir management, not a feedstock from cultivation.
Properties relevant to digestion
Submerged plants have soft tissues with a small share of lignin, but a very large amount of water. Stoneworts often precipitate calcium carbonate on the surface of the thallus, which increases the ash share and lowers the ratio of organic matter to dry matter. The material is sometimes contaminated with sand and silt from the bottom and with metals accumulated from sediments. The presence of carbonates can affect the pH buffer in the digester and the composition of the biogas.
How to read the spread of results
The dataset is based on a single study at a single temperature, so variability between laboratories is unknown. The records are different plants, and their difference is expected. The result is affected by the lake of origin, the season of harvest, the degree of contamination with sediment, the conversion to volatile solids (whether ash was taken into account), comminution and the inoculum.
In biogas plant practice
The seasonal supply of plants from mowing water bodies is small and dispersed. The material requires dewatering, sand removal and heavy metal monitoring. The plants can be a supplement in biogas plants located close to a reservoir, if the water manager pays for their management. Given the waste status and possible invasive species, it is worth checking the rules on transport and use of the digestate.
An additional factor is that results for aquatic plants depend strongly on how the sample is prepared: a plant from a lake must be cleaned of sediment, and the result then converted to organic mass. With such a small database, the literature value is indicative and should not be the basis of an installation's energy balance without a dedicated test.
Methodology in brief
BMP is the amount of methane obtained from volatile solids (VS) in a batch test, given in m³ CH₄ per tonne of VS (numerically the same as NmL CH₄/g VS in the publications) and converted to normal conditions (0 °C, 101.325 kPa). The weighted mean gives each publication a total weight of 1, split equally between its results for the substrate — a paper testing twenty varieties does not outweigh a paper with a single sample. In inter-laboratory programmes the unit is the laboratory (total weight 1), and within it the weight of a test grows with the number of bottles (replicates). Results after pretreatment (e.g. thermal, chemical, enzymatic) are shown separately and are not included in the mean.
Solid lines are curves measured in the tests. Where a publication gives only the final result, we draw a first-order kinetic model, B(t) = B₀·(1 − e−kt): only the end point comes from the publication, and the shape of the curve serves purely as visualisation — do not read the production on a particular day from it. For this substrate k = 0.102 d−1 was assumed (median of rate constants k reported in the sources and/or fitted to the mean measured curves).
The statistics describe the spread of published results — a descriptive compilation, not a meta-analysis or a guarantee of plant yield.
Bibliography
- Labatut, R.A.; Angenent, L.T.; Scott, N.R. (2011). Biochemical methane potential and biodegradability of complex organic substrates. Bioresource Technology 102(3), 2255–2264. DOI: 10.1016/j.biortech.2010.10.035 DOI
All sources of the site: bibliography.
Other substrates in the group “Algae and aquatic plants”
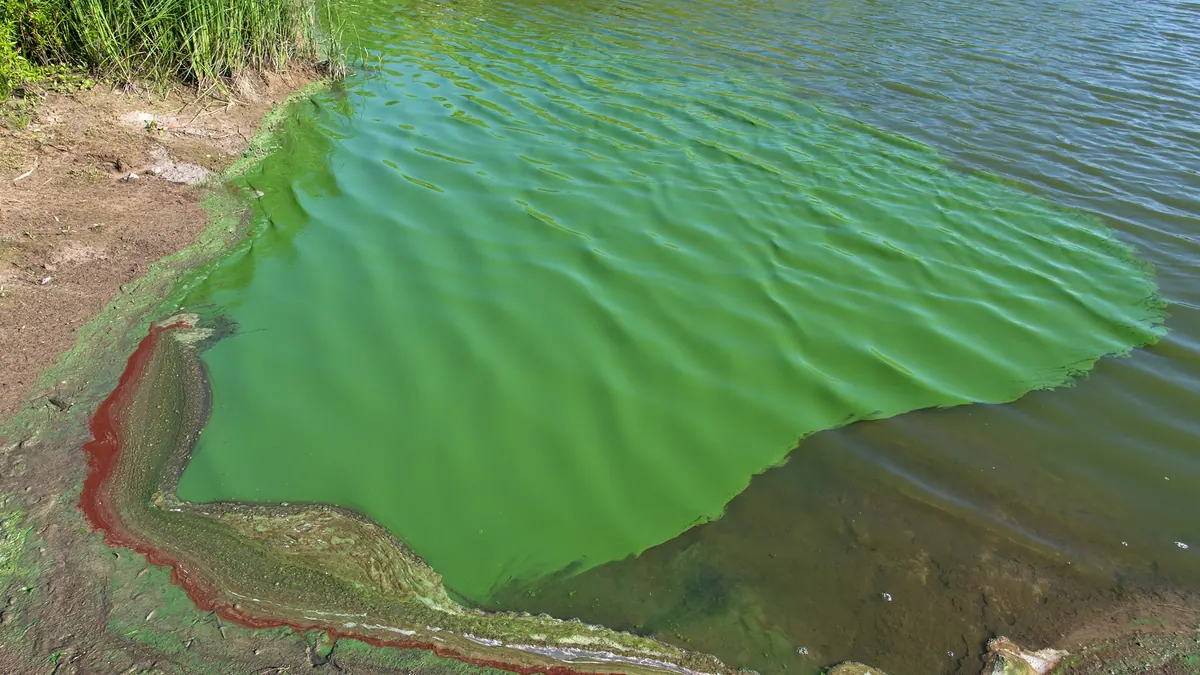
Cyanobacteria (Phormidium, Desertifilum, Anabaena, Nostoc) — BMP: 4 studies, weighted mean 152 m³ CH₄/t VS
152 m³ CH₄/t VS weighted mean from 4 studies
≈58 %
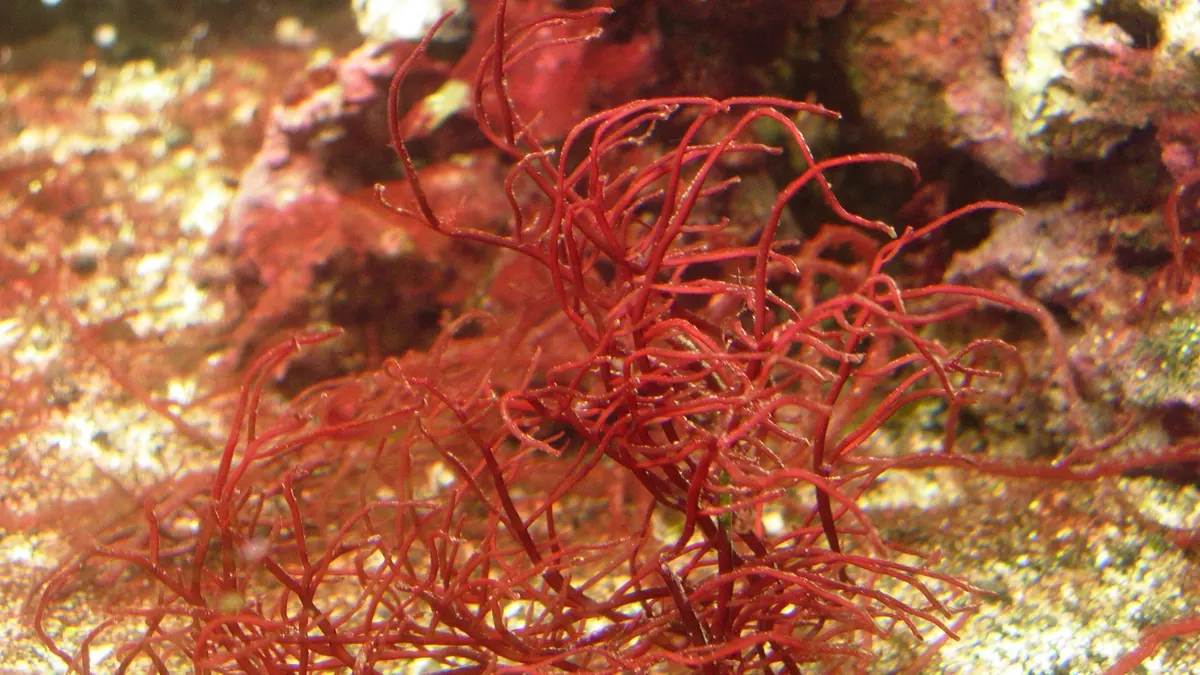
Red seaweeds (Gracilaria, Palmaria) — BMP: 2 studies, weighted mean 206 m³ CH₄/t VS
206 m³ CH₄/t VS weighted mean from 2 studies
≈52 %
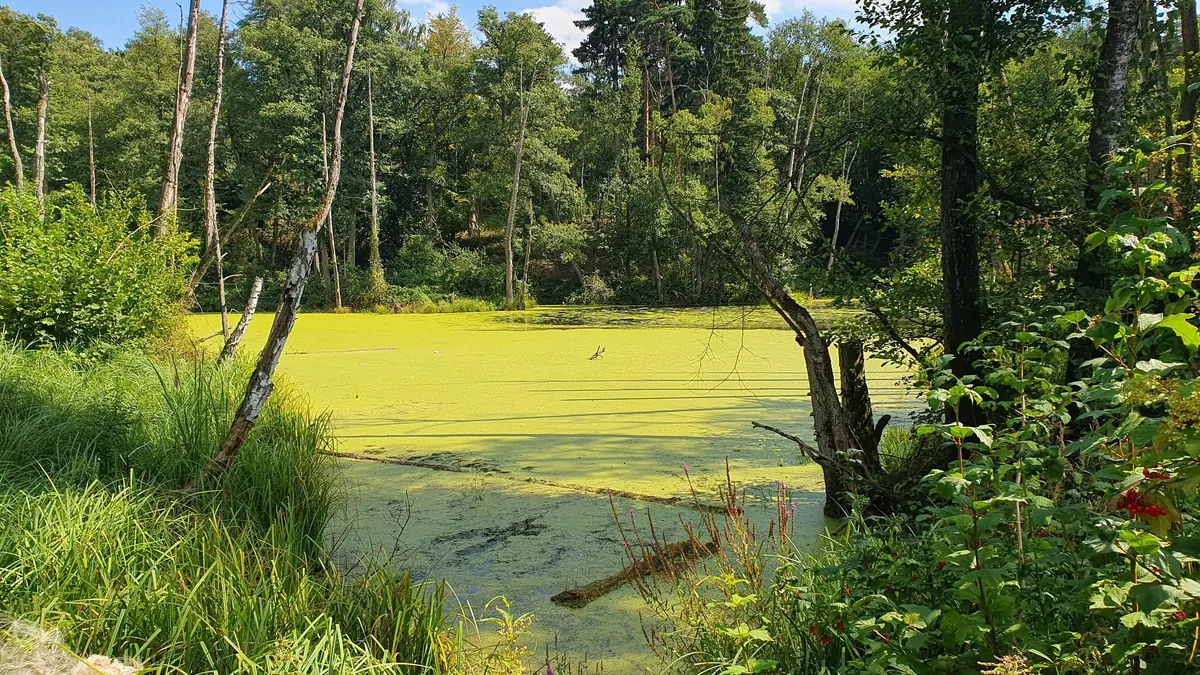
Floating aquatic plants (duckweed, frogbit, water lettuce, salvinia, water chestnut) — BMP: 5 studies, mean 310 m³ CH₄/t VS
310 m³ CH₄/t VS weighted mean from 5 studies
neutral — editorial rating for biogas plants≈52 %
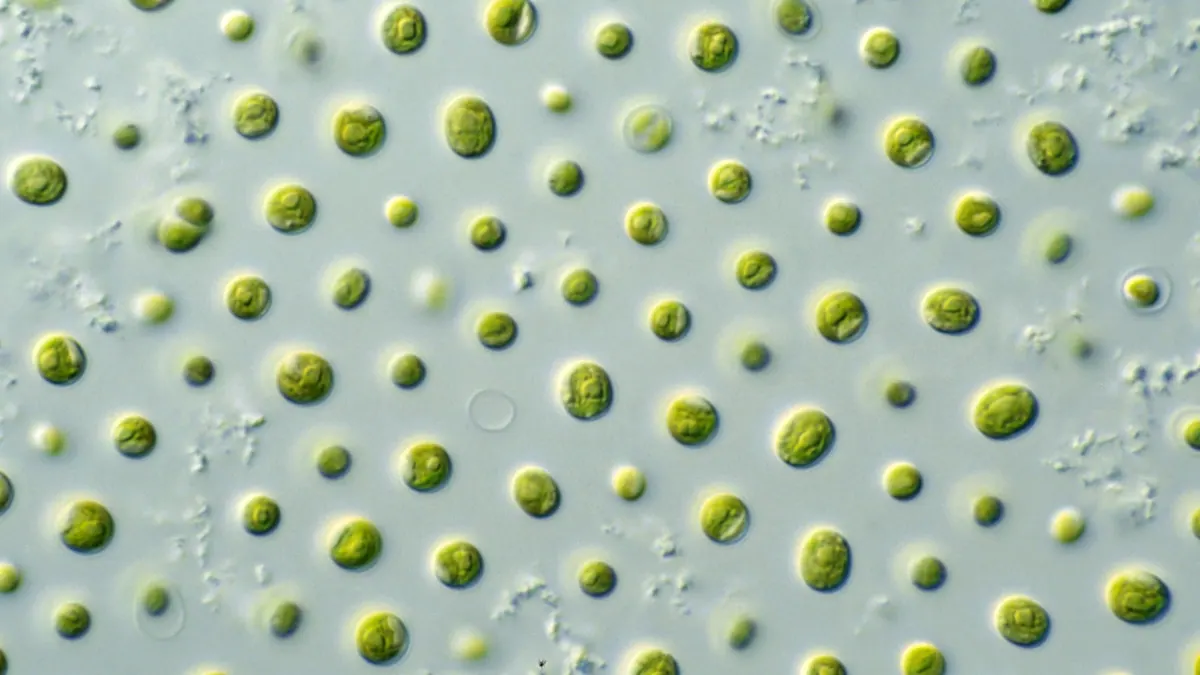
Nannochloropsis oculata — BMP: 3 studies, weighted mean 240 m³ CH₄/t VS
240 m³ CH₄/t VS weighted mean from 3 studies
≈58 %