

BMP testingAlgae and aquatic plants
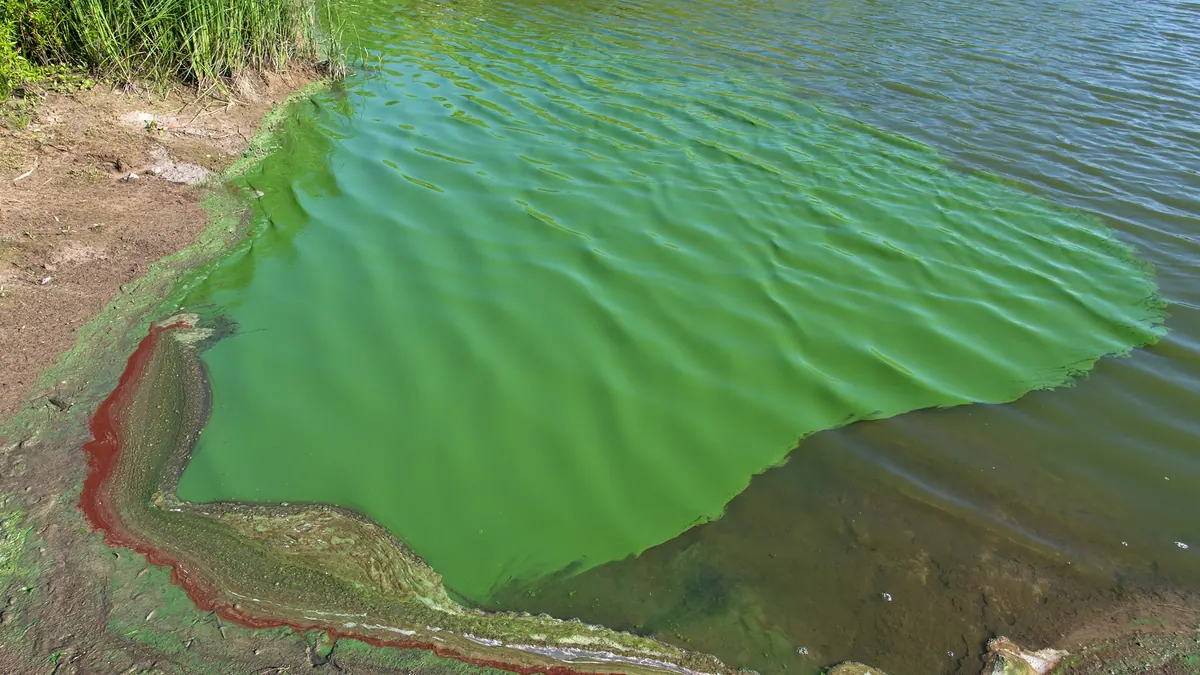
Cyanobacteria (Phormidium, Desertifilum, Anabaena, Nostoc) — BMP: 4 studies, weighted mean 152 m³ CH₄/t VS
Cyanobacteria are photosynthetic microorganisms; the entry groups Phormidium, Desertifilum, Anabaena and Nostoc from several studies under different conditions.
Photo Christian Fischer / Wikimedia Commons, licence CC BY-SA 3.0, source file; changes: cropping

- Weighted mean
- 152m³ CH₄/t VS
- Range
- 28–308m³ CH₄/t VS
- Records
- 4studies
- Publications
- 2sources
- Temperatures
- —of the test
Methane in biogas
Medium methane content · ≈ 5.8 kWh/m³ of biogas
estimate from the substrate type The collected studies contain no measurement. The interval follows from the approximate composition (protein-rich (process classification)) and the yields of compound groups according to FNR.
Rating for biogas plants
not rated — editorial rating for biogas plants
Not rated: no dry matter or volatile solids in the data. We calculate the rating when the dry matter and volatile solids of the material are known.
Add to the co-digestion calculator CSV data
BMP curves from 4 studies
Weighted mean Individual records
Dashed lines are a model curve (first-order kinetics, B(t) = B₀·(1 − e−kt)); the end point comes from the publication. All curves are model curves.
Cumulative methane production over the test [m³ CH₄/t VS]. The thick line is the weighted mean of all records (152); dots mark the end values given in the publications. Point at the chart to read values; click a legend item to hide or show a record.
Records and sources
Download CSV| Source | BMP m³ CH₄/t VS | Temperature | Sample | Curve |
|---|---|---|---|---|
| Fermoso et al. (2016) DOI | 28 | — | Nostoc sp. | end point (model curve) |
| Perendeci et al. (2019) · 1 DOI | 229 | — | Anabaena variabilis | end point (model curve) |
| Perendeci et al. (2019) · 2 DOI | 293 | — | Phormidium animale | end point (model curve) |
| Perendeci et al. (2019) · 3 DOI | 308 | — | Desertifilum tharense | end point (model curve) |
| Weighted mean | 152 | arithmetic mean 214, SD 129 | ||
Process properties
Low confidence: the description is based on general characteristics of the substrate group, not on studies of this material. Treat it as a hint to be verified.
Advantages
- Methane yield in the compendium: median 261 (range 28–308) m³ CH₄/t VS, 4 records from 2 papers (weighted mean 152).
Drawbacks and risks
- The high protein content of the cells causes release of ammonia, which can be toxic to the process (Sialve et al. (2009); Rajagopal et al. (2013))
Co-digestion — what to combine it with, what to watch out for
- combines well
substrates: carbon-rich — e.g. Wheat straw, Maize silage (whole crop), Cereal straw (unspecified), Willow (short rotation), Cardboard and paperboard
The low C/N of algal sludge was balanced by the addition of paper: 50-60% VS of paper increased the rate of methane production, optimum C/N 20-25.[1][2]
- caution
substrates: nitrogen-rich — e.g. Pig slurry, Poultry manure, Waste activated sludge (secondary sludge), Chlorella vulgaris, Nannochloropsis salina
Algal protein releases ammonia; additional nitrogen sources increase the risk of ammonia inhibition.[2][3]
Dosing
No source limits on the dose for this substrate.
Introduce gradually, starting with a small dose and monitoring the process (e.g. FOS/TAC, pH, gas composition).
Practical requirements
- Do not dry the biomass before feeding: drying lowered biogas production to about 80% (Mussgnug et al. (2010))
- Monitor ammonia (high protein) and, for marine species, sodium (Sialve et al. (2009))
Sources of the process data
- Anaerobic co-digestion of algal sludge and waste paper to produce methane
- Anaerobic digestion of microalgae as a necessary step to make microalgal biodiesel sustainable
- A critical review on inhibition of anaerobic digestion process by excess ammonia
- Screening of biomethane production potential from dominant microalgae
- Correlations between biochemical composition and biogas production during anaerobic digestion of microalgae and cyanobacteria isolated from different sources of Turkey
- Microalgae as substrates for fermentative biogas production in a combined biorefinery concept
The co-digestion calculator will assess a specific mixture containing this substrate.
What it is and where it comes from
Cyanobacteria are prokaryotic organisms capable of photosynthesis. The dataset collects the genera Phormidium, Desertifilum, Anabaena and Nostoc, studied in several papers, one of which concerns isolates from Turkey. The biomass is obtained from cultivation in photobioreactors and ponds or from blooms in water bodies. Blooms are an environmental problem, and collecting them carries the risk of the presence of toxins produced by some strains.
Properties relevant to digestion
Cyanobacterial cells contain no lignin, but they have cell walls of peptidoglycan and mucilaginous sheaths, which can slow hydrolysis. The biomass contains a lot of protein, which in digestion leads to the formation of ammonia, and at a high load to its inhibitory effect. The C/N ratio is often low, so co-digestion with carbon-rich material works well. Some strains produce toxins, the presence of which requires separate assessment.
How to read the spread of results
The data comprise several records from different strains and several studies, without a stated temperature, because they were read from abstracts. The result depends on the species, cultivation conditions (light, medium, growth phase), the method of harvesting and dewatering, cell disruption and inoculum. Natural blooms differ in composition from monoculture cultivations, so transferring values from one source to another is risky.
In biogas plant practice
In Poland, cyanobacterial biomass is a research material or a waste from the cleaning of water bodies, not a regular stream. Should it be used, care must be taken over thickening (most of the mass is water), ammonia control, provision of a carbon co-substrate and testing for the presence of toxins. The seasonality and unpredictability of blooms make it difficult to plan supplies.
If practical use is planned, it makes sense to establish beforehand whether the biomass comes from controlled cultivation or from a natural bloom, because the risk of toxins and contaminants depends on it. Using cyanobacteria in co-digestion with slurry or carbon-rich material is usually safer than digesting the biomass alone, because it dilutes nitrogen and makes it easier to maintain a stable pH.
Methodology in brief
BMP is the amount of methane obtained from volatile solids (VS) in a batch test, given in m³ CH₄ per tonne of VS (numerically the same as NmL CH₄/g VS in the publications) and converted to normal conditions (0 °C, 101.325 kPa). The weighted mean gives each publication a total weight of 1, split equally between its results for the substrate — a paper testing twenty varieties does not outweigh a paper with a single sample. In inter-laboratory programmes the unit is the laboratory (total weight 1), and within it the weight of a test grows with the number of bottles (replicates). Results after pretreatment (e.g. thermal, chemical, enzymatic) are shown separately and are not included in the mean.
Solid lines are curves measured in the tests. Where a publication gives only the final result, we draw a first-order kinetic model, B(t) = B₀·(1 − e−kt): only the end point comes from the publication, and the shape of the curve serves purely as visualisation — do not read the production on a particular day from it. For this substrate k = 0.102 d−1 was assumed (median of rate constants k reported in the sources and/or fitted to the mean measured curves).
The statistics describe the spread of published results — a descriptive compilation, not a meta-analysis or a guarantee of plant yield.
Bibliography
- Fermoso, F.G.; Beltran, C.; Jimenez, A.; Fernández, M.J.; Rincón, B.; Borja, R.; Jeison, D. (2016). Screening of biomethane production potential from dominant microalgae. Journal of Environmental Science and Health, Part A 51(12), 1062–1067. DOI: 10.1080/10934529.2016.1198627 DOI
- Perendeci, N.; Yılmaz, V.; Ertit Taştan, B.; Gökgöl, S.; Fardinpoor, M.; Namlı, A.; Steyer, J. (2019). Correlations between biochemical composition and biogas production during anaerobic digestion of microalgae and cyanobacteria isolated from different sources of Turkey. Bioresource Technology 281, 209–216. DOI: 10.1016/j.biortech.2019.02.086 DOI
All sources of the site: bibliography.
Other substrates in the group “Algae and aquatic plants”
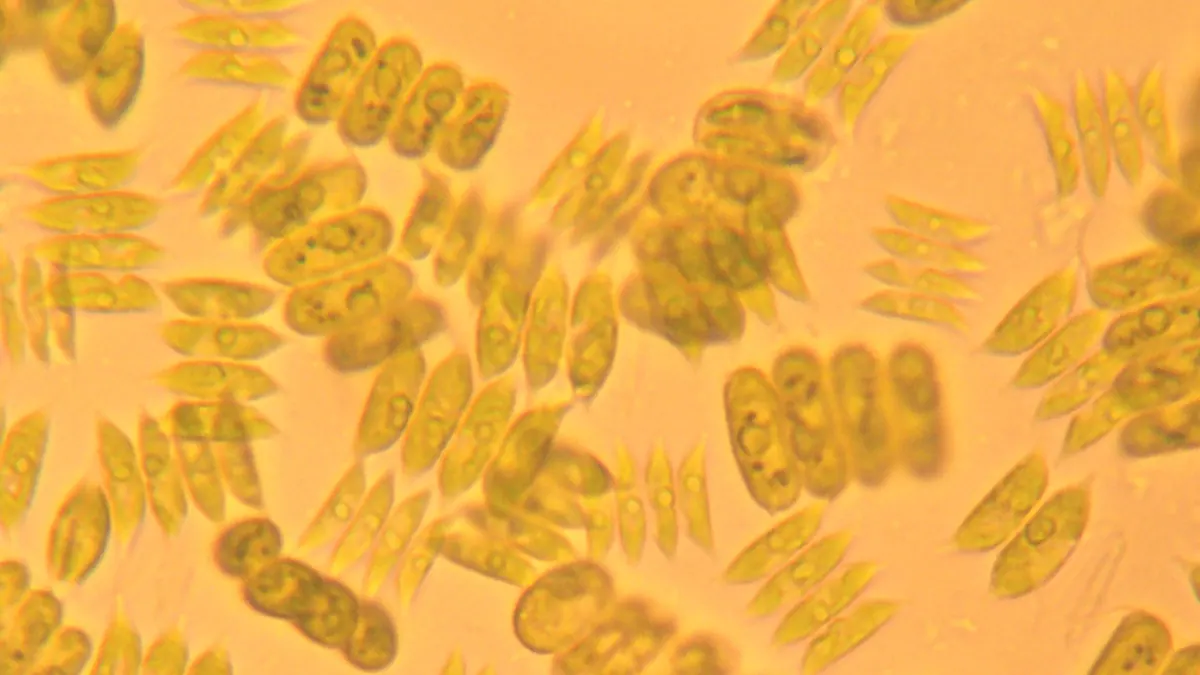
Scenedesmus sp. — BMP: 4 studies, weighted mean 204 m³ CH₄/t VS
204 m³ CH₄/t VS weighted mean from 4 studies
neutral — editorial rating for biogas plants≈58 %
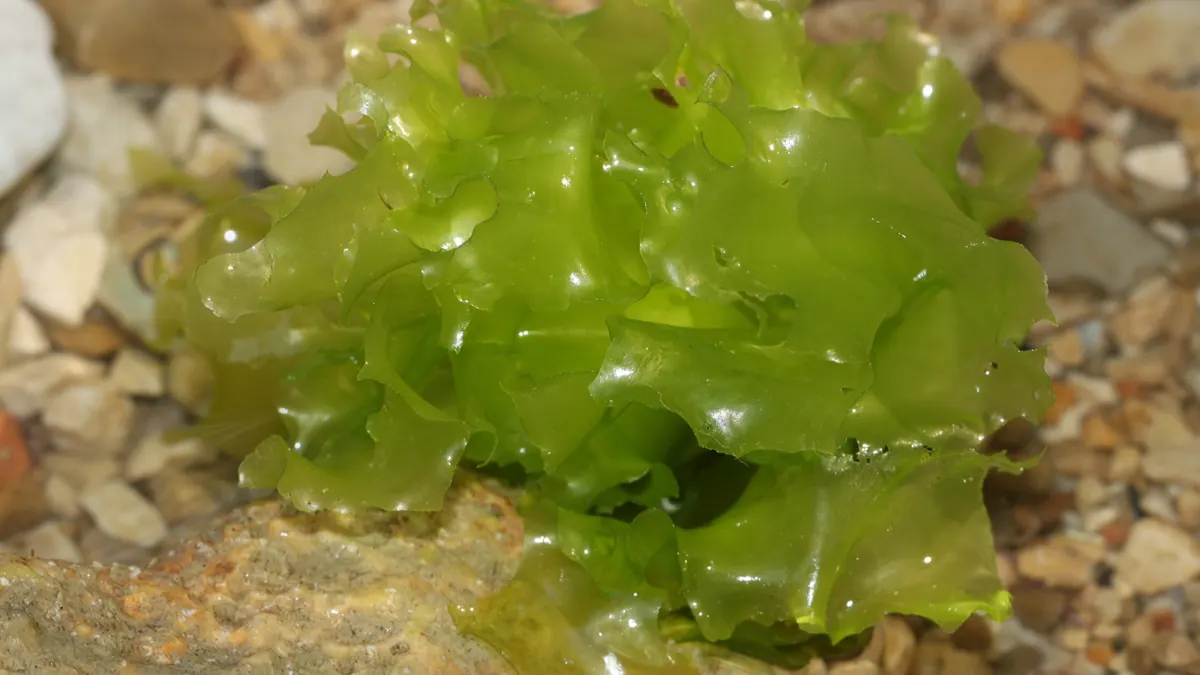
Sea lettuce (Ulva lactuca) — BMP: 2 studies, weighted mean 247 m³ CH₄/t VS
247 m³ CH₄/t VS weighted mean from 2 studies
≈52 %
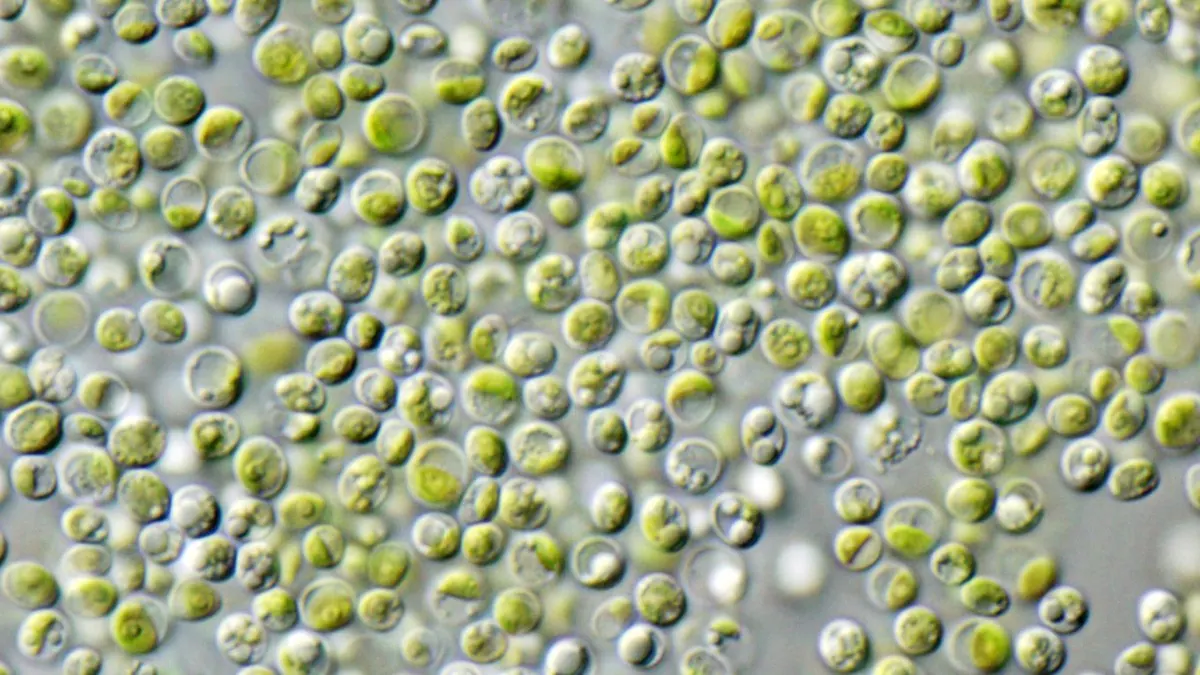
Chlorella vulgaris — BMP: 9 studies, weighted mean 278 m³ CH₄/t VS
278 m³ CH₄/t VS weighted mean from 9 studies
≈58 %
Chlamydomonas reinhardtii — BMP: 2 studies, weighted mean 346 m³ CH₄/t VS
346 m³ CH₄/t VS weighted mean from 2 studies
≈58 %