

BMP testingAlgae and aquatic plants
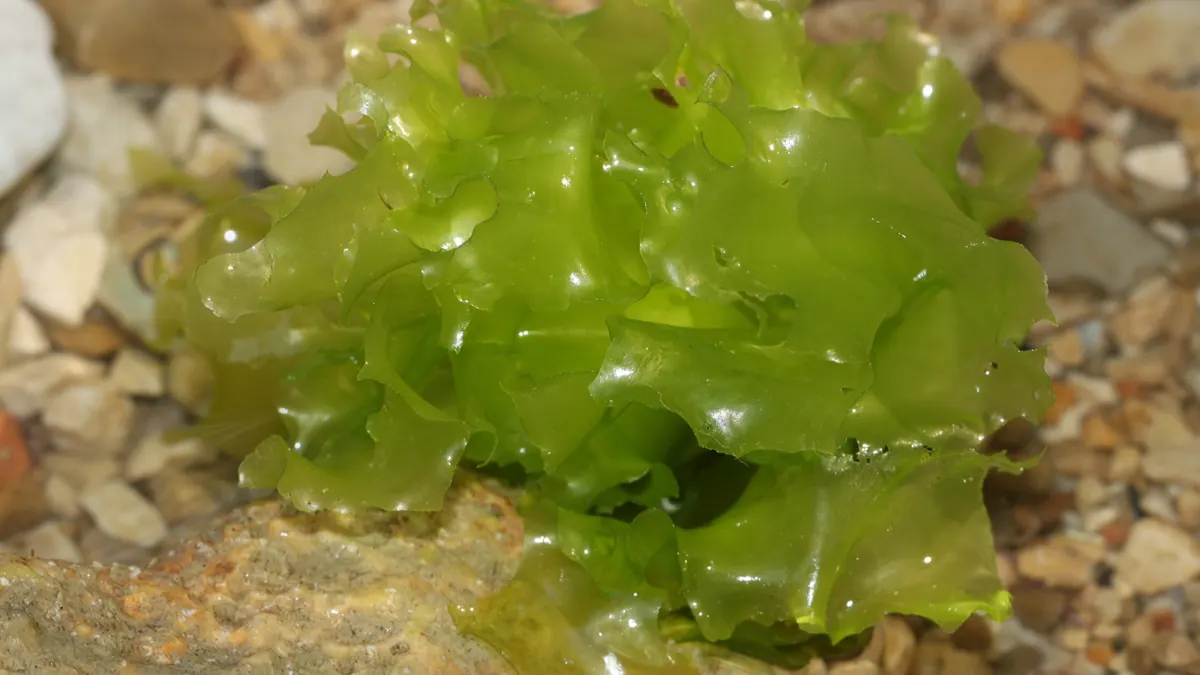
Sea lettuce (Ulva lactuca) — BMP: 2 studies, weighted mean 247 m³ CH₄/t VS
Sea lettuce (Ulva) is a green macroalga found in coastal strandings; two thermophilic tests from different studies are described, and salt and sulphur are the main constraints.
Photo Holger Krisp / Wikimedia Commons, licence CC BY 3.0, source file; changes: cropping

- Weighted mean
- 247m³ CH₄/t VS
- Range
- 152–343m³ CH₄/t VS
- Records
- 2studies
- Publications
- 2sources
- Temperatures
- 53 °C, 55 °Cof the test
Methane in biogas
Medium methane content · ≈ 5.2 kWh/m³ of biogas
estimate from the substrate type The collected studies contain no measurement. The interval follows from the approximate composition (carbohydrate-dominated (no protein or fat characteristics)) and the yields of compound groups according to FNR.
Rating for biogas plants
not rated — editorial rating for biogas plants
Not rated: no dry matter or volatile solids in the data. We calculate the rating when the dry matter and volatile solids of the material are known.
Add to the co-digestion calculator CSV data
BMP curves from 2 studies
Weighted mean Individual records
Dashed lines are a model curve (first-order kinetics, B(t) = B₀·(1 − e−kt)); the end point comes from the publication. All curves are model curves.
Cumulative methane production over the test [m³ CH₄/t VS]. The thick line is the weighted mean of all records (247); dots mark the end values given in the publications. Point at the chart to read values; click a legend item to hide or show a record.
Records and sources
Download CSV| Source | BMP m³ CH₄/t VS | Temperature | Sample | Curve |
|---|---|---|---|---|
| Koçer i Özçimen (2018) DOI | 343 | 55 °C · thermophilic | Ulva lactuca (coastal macroalgal waste) | end point (model curve) |
| Nielsen i Heiske (2011) DOI | 152 | 53 °C · thermophilic | Ulva lactuca (Denmark) | end point (model curve) |
| Weighted mean | 247 | arithmetic mean 247, SD 135 | ||
Process properties
Advantages
- Methane yield in the compendium: median 247 (range 152–343) m³ CH₄/t VS, 2 records from 2 papers (weighted mean 247).
- Maceration increased the methane yield of Ulva lactuca by 68% (Nielsen et al. (2011))
- Co-digestion of Ulva with cattle slurry in a CSTR increased the rate of methane production by 48% at 40% VS of Ulva in the feed (Nielsen et al. (2011))
Drawbacks and risks
- Increasing the share of Ulva from 40 to 50% VS gave no further increase in methane production, which limits use in large biogas plants (Nielsen et al. (2011))
- The yield of Ulva rises with temperature and falls with increasing particle size (Koçer et al. (2018))
- After stabilisation the biogas from co-digestion of Ulva sp. with pig slurry (48/52 w/w) contained 3.5% H2S and required cleaning; potassium molybdate lowered H2S only temporarily (Peu et al. (2011))
- A larger share of Ulva lactuca in a mix with dairy slurry led to inhibition, rapid VFA accumulation and forced a reduction in loading (FitzGerald et al. (2015))
Co-digestion — what to combine it with, what to watch out for
- combines well
group: Animal excreta (slurry, manure, poultry litter)
Co-digestion of Ulva with cattle slurry increased the rate of methane production by 48% at 40% VS of Ulva.[1]
- caution
substrates: sulphur-rich — e.g. Pulp and paper mill biosludge, Pig slurry, Municipal sewage sludge (mixed), Beach-cast macroalgae (mix), Pig manure (solid)
Ulva supplies sulphur: the biogas from co-digestion with pig slurry contained 3.5% H2S; with additional sulphur sources the risk rises.[2][3]
Dosing
Indicative limit from the literatureup to 40% VS of the feed[1]
Basis: share of Ulva in the VS of the feed. Nielsen et al. (2011): in a CSTR with cattle slurry, 40% VS of Ulva lactuca increased the rate of methane production by 48%, and increasing to 50% gave no further effect. The value of 40% is therefore a point above which there is no benefit (data from one paper), not a documented toxicity threshold. Peu et al. (2011) in a three-month pilot co-digested Ulva sp. with pig slurry 48/52 w/w without clear disruption of the process, but the biogas contained 3.5% H2S; FitzGerald et al. (2015) described inhibition and rapid VFA accumulation at a larger share of Ulva in a mix with dairy slurry, which forced a reduction in loading. Treat 40% as an upper guide and introduce gradually.
Introduce gradually, starting with a small dose and monitoring the process (e.g. FOS/TAC, pH, gas composition).
Practical requirements
- Assess the C:S ratio of the feedstock — the Peu et al. model indicates a C:S ratio of at least 40 for H2S below 2% in the biogas; provide for biogas desulphurisation (Peu et al. (2012); Peu et al. (2011))
- Shred finely (optimally approx. 200 µm in a thermophilic test) (Koçer et al. (2018))
Sources of the process data
- Anaerobic digestion of macroalgae: methane potentials, pre-treatment, inhibition and co-digestion
- Sulphur fate and anaerobic biodegradation potential during co-digestion of seaweed biomass (Ulva sp.) with pig slurry
- Prediction of hydrogen sulphide production during anaerobic digestion of organic substrates
- Investigation of the biogas production potential from algal wastes
- Methanosarcina Play an Important Role in Anaerobic Co-Digestion of the Seaweed Ulva lactuca: Taxonomy and Predicted Metabolism of Functional Microbial Communities
The co-digestion calculator will assess a specific mixture containing this substrate.
What it is and where it comes from
Ulva lactuca, known as sea lettuce, is a green macroalga with a thin, blade-like thallus. In coastal waters rich in nitrogen and phosphorus it can develop en masse, forming so-called green tides, which require removal once washed ashore. The set contains several records: algae from coastal strandings and material from a Danish study. It is not a typical substrate for Poland.
Properties relevant to digestion
Ulva biomass is poor in lignin and contains cell wall polysaccharides (ulvan), proteins and mineral salts. Good availability to bacteria favours rapid initial degradation, but salt and sulphur pose a risk: high salinity inhibits methanogens, and sulphates are reduced to hydrogen sulphide. Waste from the beach may contain sand, shells and other impurities, which load the tank with sediment and yield no methane.
How to read the spread of results
The records come from several independent studies and both relate to thermophilic conditions, but with different biomass: one study examined algae from strandings, the other material from Denmark. The result is affected by seasonal composition and the place of harvest, salinity, the degree of rinsing, particle size, the method of preservation and the adaptation of the inoculum to salt. The differences between the records should therefore not be interpreted as measurement spread for the same material.
In biogas plant practice
Ulva is sometimes treated as a supplement to the mix in coastal installations. It usually requires rinsing, sand reduction and monitoring of hydrogen sulphide and salt in the system. Supply is seasonal and unpredictable, so it rarely forms the basis of a business plan. Before a batch is used, its content of heavy metals and impurities and its compliance with local waste regulations must be checked.
When assessing profitability, the costs of harvesting and transporting wet biomass, which consists mostly of water, must be taken into account. Literature results are a good reference point for comparisons, but they do not replace testing one's own batch, especially as the composition of algae washed ashore changes from season to season and depends on how long they lay on the beach.
Methodology in brief
BMP is the amount of methane obtained from volatile solids (VS) in a batch test, given in m³ CH₄ per tonne of VS (numerically the same as NmL CH₄/g VS in the publications) and converted to normal conditions (0 °C, 101.325 kPa). The weighted mean gives each publication a total weight of 1, split equally between its results for the substrate — a paper testing twenty varieties does not outweigh a paper with a single sample. In inter-laboratory programmes the unit is the laboratory (total weight 1), and within it the weight of a test grows with the number of bottles (replicates). Results after pretreatment (e.g. thermal, chemical, enzymatic) are shown separately and are not included in the mean.
Solid lines are curves measured in the tests. Where a publication gives only the final result, we draw a first-order kinetic model, B(t) = B₀·(1 − e−kt): only the end point comes from the publication, and the shape of the curve serves purely as visualisation — do not read the production on a particular day from it. For this substrate k = 0.102 d−1 was assumed (median of rate constants k reported in the sources and/or fitted to the mean measured curves).
The statistics describe the spread of published results — a descriptive compilation, not a meta-analysis or a guarantee of plant yield.
Bibliography
- Koçer, A.T.; Özçimen, D. (2018). Investigation of the biogas production potential from algal wastes. Waste Management & Research: The Journal for a Sustainable Circular Economy 36(11), 1100–1105. DOI: 10.1177/0734242x18798447 DOI
- Nielsen, H.B.; Heiske, S. (2011). Anaerobic digestion of macroalgae: methane potentials, pre-treatment, inhibition and co-digestion. Water Science and Technology 64(8), 1723–1729. DOI: 10.2166/wst.2011.654 DOI
All sources of the site: bibliography.
Other substrates in the group “Algae and aquatic plants”
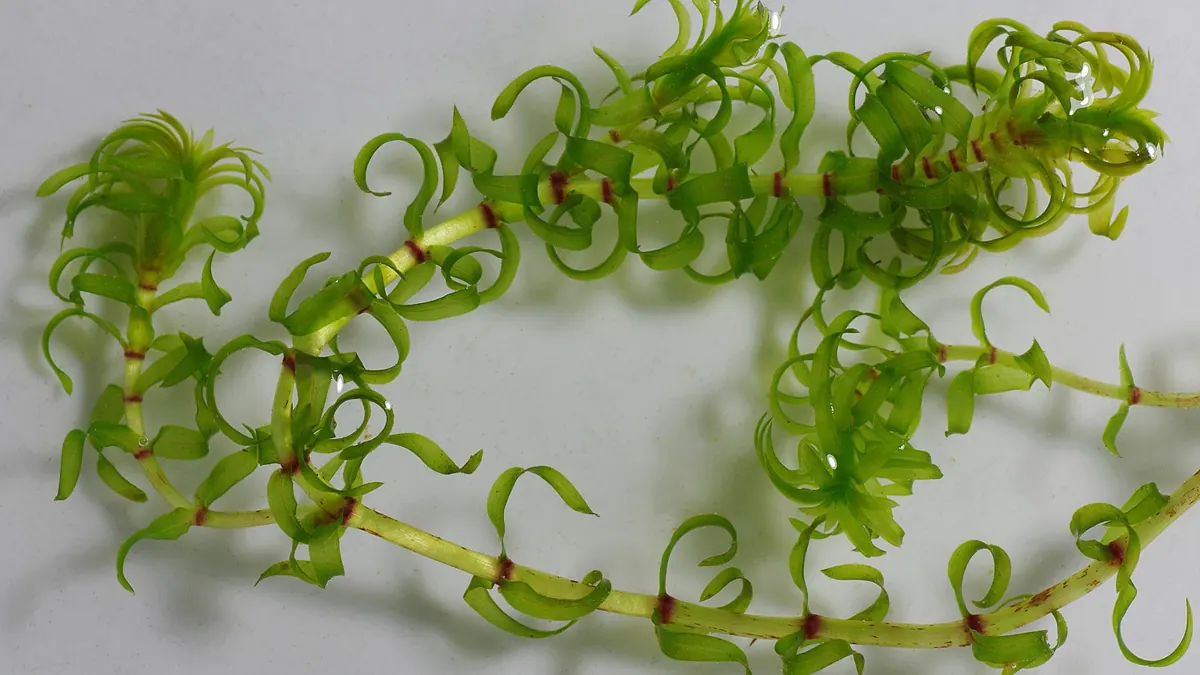
Western waterweed — BMP: 2 studies, weighted mean 218 m³ CH₄/t VS
218 m³ CH₄/t VS weighted mean from 2 studies
≈52 %
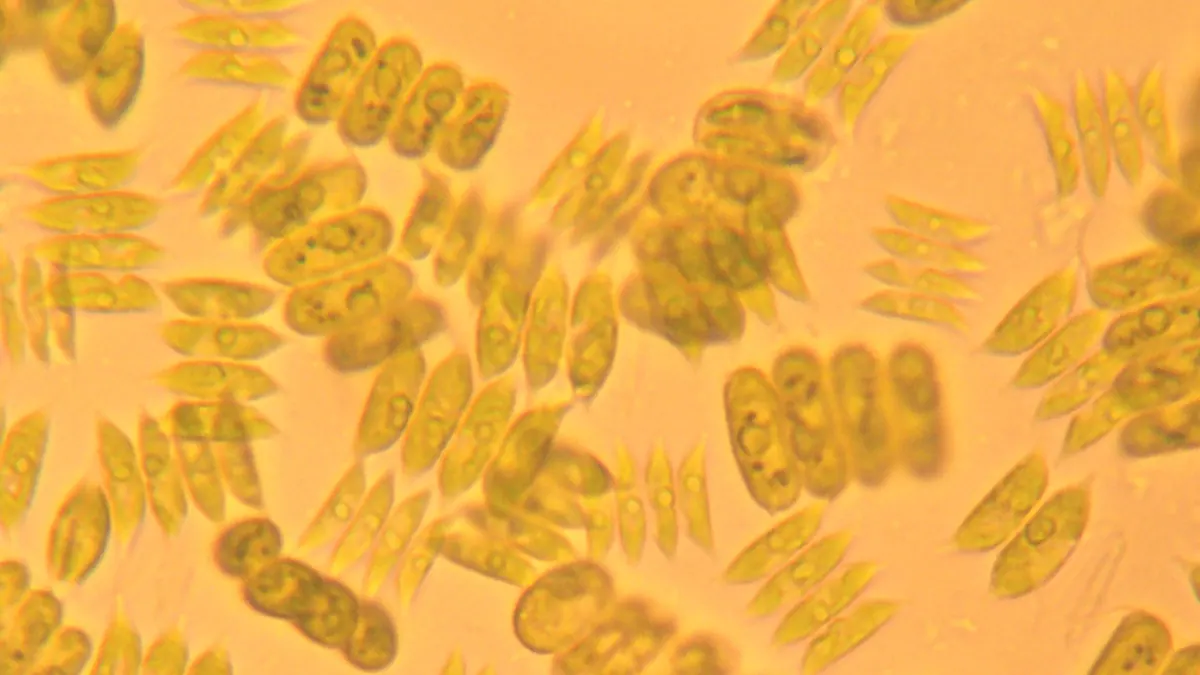
Scenedesmus sp. — BMP: 4 studies, weighted mean 204 m³ CH₄/t VS
204 m³ CH₄/t VS weighted mean from 4 studies
neutral — editorial rating for biogas plants≈58 %
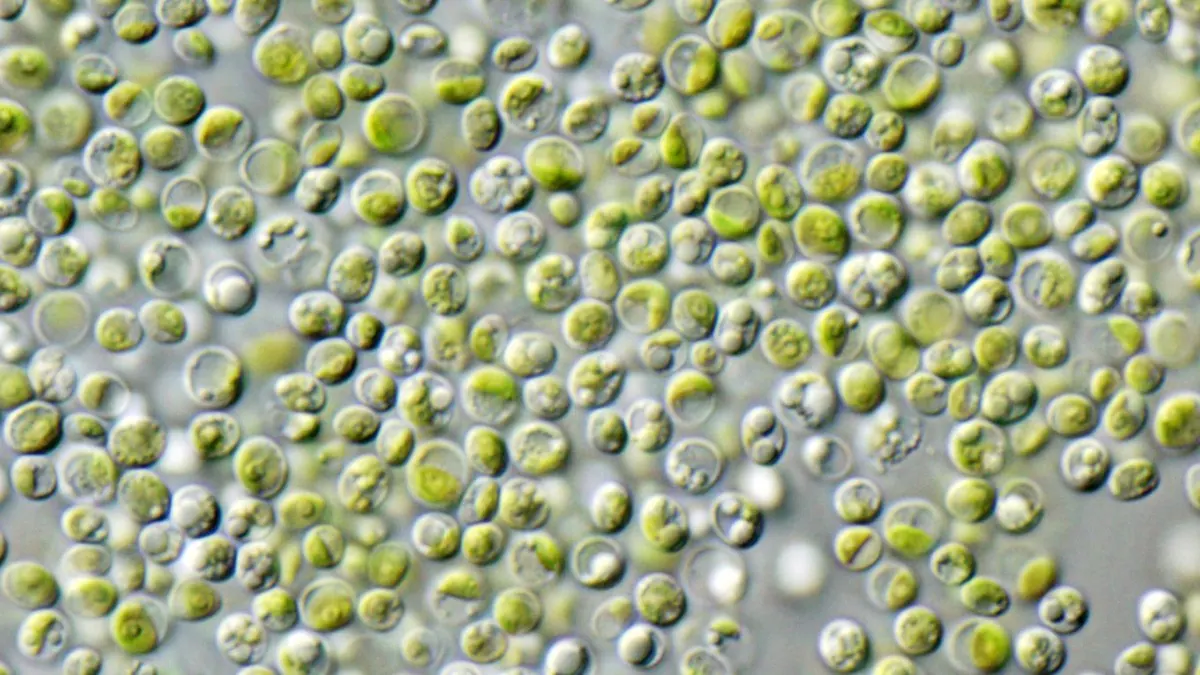
Chlorella vulgaris — BMP: 9 studies, weighted mean 278 m³ CH₄/t VS
278 m³ CH₄/t VS weighted mean from 9 studies
≈58 %
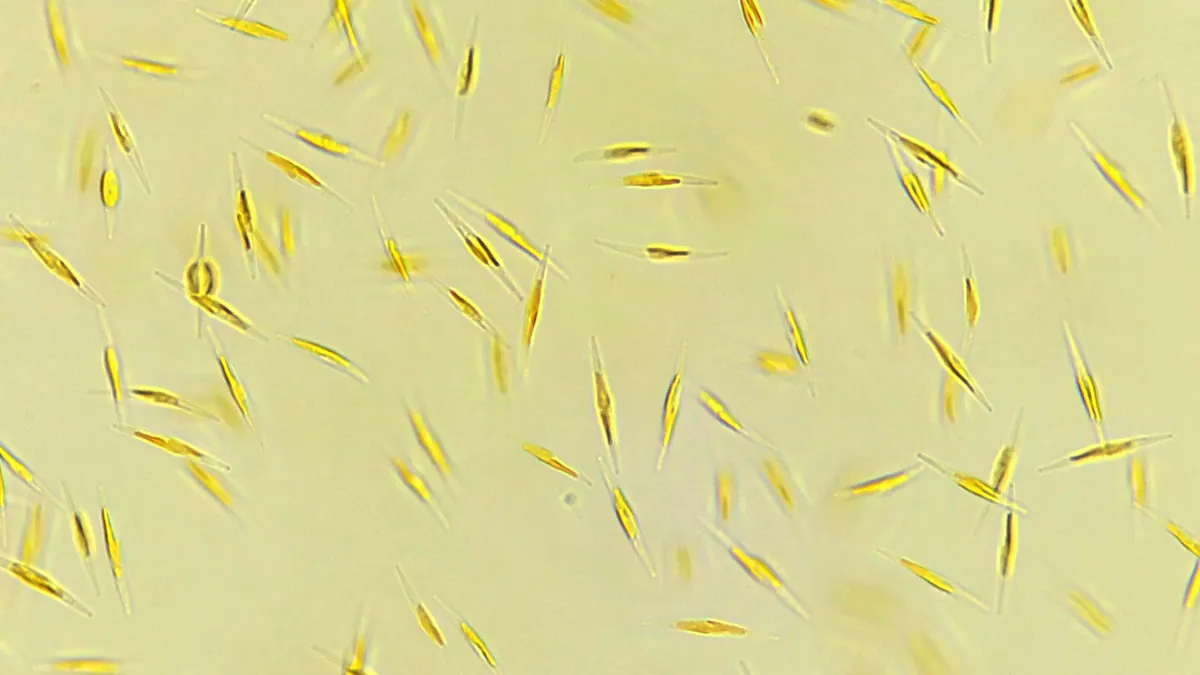
Phaeodactylum tricornutum — BMP: 3 studies, weighted mean 299 m³ CH₄/t VS
299 m³ CH₄/t VS weighted mean from 3 studies
≈58 %