

BMP testingWood and woody biomass
Willow (short rotation) — BMP: 14 studies, weighted mean 259 m³ CH₄/t VS
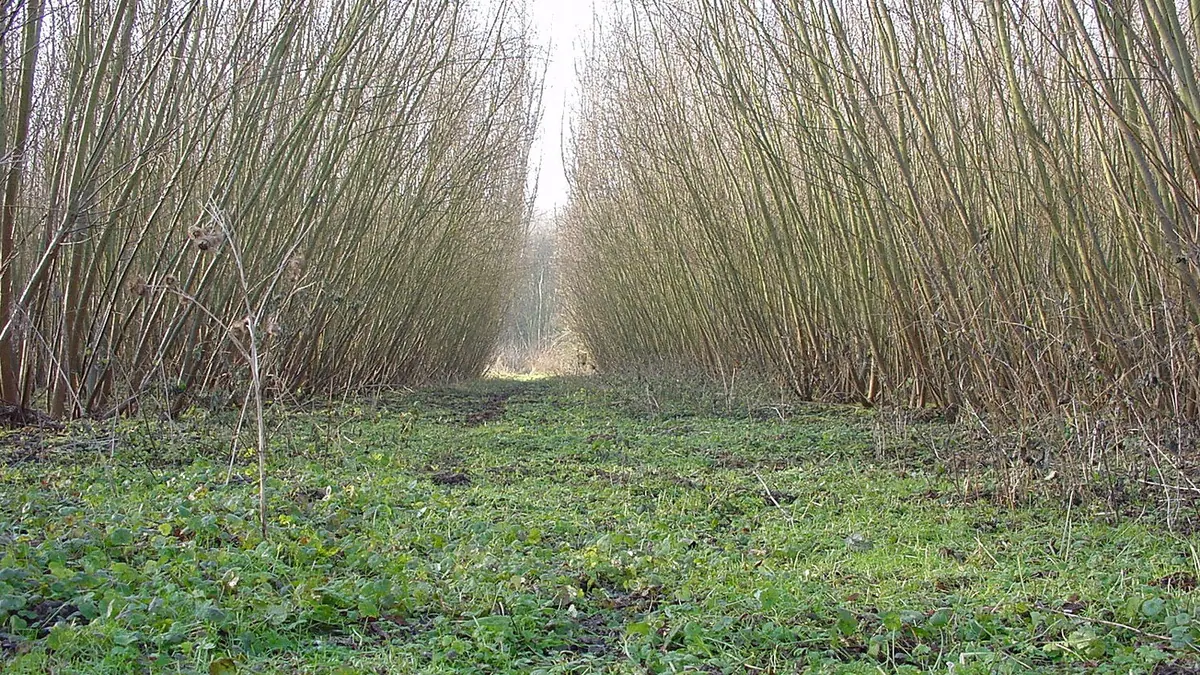
Energy willow (Salix) from short-rotation plantations is woody biomass with a moderate methane potential, strongly dependent on shoot age and particle size.
Photo Lamiot / Wikimedia Commons, licence CC BY 3.0, source file; changes: cropping

- Weighted mean
- 259m³ CH₄/t VS
- Range
- 140–310m³ CH₄/t VS
- Records
- 14studies
- Publications
- 2sources
- Temperatures
- 35 °C, 37 °Cof the test
Methane in biogas
Medium methane content · ≈ 5.2 kWh/m³ of biogas
estimate from the substrate type The collected studies contain no measurement. The interval follows from the approximate composition (carbohydrate-dominated (no protein or fat characteristics)) and the yields of compound groups according to FNR.
Rating for biogas plants
not rated — editorial rating for biogas plants
Not rated: no dry matter or volatile solids in the data. We calculate the rating when the dry matter and volatile solids of the material are known.
Add to the co-digestion calculator CSV data
BMP curves from 14 studies
Weighted mean Individual records
Dashed lines are a model curve (first-order kinetics, B(t) = B₀·(1 − e−kt)); the end point comes from the publication. All curves are model curves.
Cumulative methane production over the test [m³ CH₄/t VS]. The thick line is the weighted mean of all records (259); dots mark the end values given in the publications. Point at the chart to read values; click a legend item to hide or show a record.
Show the remaining records in the legend (2)
Records and sources
Download CSV| Source | BMP m³ CH₄/t VS | Temperature | Sample | Curve |
|---|---|---|---|---|
| Lehtomaki (2004) | 290 | 37 °C · mesophilic | Energy willow | end point (model curve) |
| Chynoweth et al. (1993) · 1 DOI | 140 | 35 °C · mesophilic | Willow | end point (model curve) |
| Chynoweth et al. (1993) · 2 DOI | 160 | 35 °C · mesophilic | Willow | end point (model curve) |
| Chynoweth et al. (1993) · 3 DOI | 180 | 35 °C · mesophilic | Willow | end point (model curve) |
| Chynoweth et al. (1993) · 4 DOI | 190 | 35 °C · mesophilic | Willow | end point (model curve) |
| Chynoweth et al. (1993) · 5 DOI | 210 | 35 °C · mesophilic | Willow | end point (model curve) |
| Chynoweth et al. (1993) · 6 DOI | 220 | 35 °C · mesophilic | Willow | end point (model curve) |
| Chynoweth et al. (1993) · 7 DOI | 230 | 35 °C · mesophilic | Willow | end point (model curve) |
| Chynoweth et al. (1993) · 8 DOI | 240 | 35 °C · mesophilic | Willow | end point (model curve) |
| Chynoweth et al. (1993) · 9 DOI | 250 | 35 °C · mesophilic | Willow | end point (model curve) |
| Chynoweth et al. (1993) · 10 DOI | 270 | 35 °C · mesophilic | Willow | end point (model curve) |
| Chynoweth et al. (1993) · 11 DOI | 280 | 35 °C · mesophilic | Willow | end point (model curve) |
| Chynoweth et al. (1993) · 12 DOI | 290 | 35 °C · mesophilic | Willow | end point (model curve) |
| Chynoweth et al. (1993) · 13 DOI | 310 | 35 °C · mesophilic | Willow | end point (model curve) |
| Weighted mean | 259 | arithmetic mean 233, SD 52 | ||
Typical composition
- Dry matter (DM)
- 50% (range 50–50)
Median and range of the determinations reported in the publications behind this substrate's BMP records (read from: CROPGEN D4); dry matter: 1 determination, volatile solids: 0 determinations. DM from a single determination – indicative value.
Sources: Lehtomaki (2004).
The composition of the raw material varies between batches — for plant calculations use an analysis of your own sample. The calculator inserts typical values automatically.
Process properties
Advantages
- Methane potential in the database: weighted mean 259 m³ CH₄/t VS (median 235; range 140–310; 14 records from 2 sources).
Drawbacks and risks
- Lignin limits degradation; size reduction and a long HRT are essential (review by Hendriks 2009).
- Spread of results in the database: standard deviation 52 at a mean of 233 m³ CH₄/t VS (14 records from 2 sources).
Co-digestion — what to combine it with, what to watch out for
- caution
substrates: easily degradable — e.g. Maize silage (whole crop), Food waste, Sorghum, whole crop, Whey, Beet leaves and tops
Rapid acidification from readily degradable co-substrates will not be offset by the slowly degrading willow.[1]
Dosing
No source-based dose limits; use as an additive in mixes with excrement after size reduction.
Practical requirements
- Shred: shredding increases the surface available for degradation and speeds it up, but does not necessarily raise the final gas yield (FNR 2010, Ch. 3 “Triturado”).
Sources of the process data
- Chen, Y.; Cheng, J.J.; Creamer, K.S. (2008) Inhibition of anaerobic digestion process: A review. Bioresource Technology
- Lehtomaki, A. Chistensson, K. and Bjornsson, L (2004) Pilot Scale two-stage anaerobic digestion of energy crops. Proceedings Anaerobic Digestion Conference 1763-1766
- Chynoweth, D.; Turick, C.; Owens, J.; Jerger, D.; Peck, M. (1993) Biochemical methane potential of biomass and waste feedstocks. Biomass and Bioenergy 5(1), 95–111
- Dahunsi, S. (2019) Mechanical pretreatment of lignocelluloses for enhanced biogas production: Methane yield prediction from biomass structural components. Bioresource Technology 280, 18–26
- Hendriks, A.T.W.M.; Zeeman, G. (2009) Pretreatments to enhance the digestibility of lignocellulosic biomass. Bioresource Technology
- Weiland, P. (2010) Biogas production: current state and perspectives. Applied Microbiology and Biotechnology
- FNR (2010). Guía sobre el Biogás – Desde la producción hasta el uso (hiszp. wydanie „Leitfaden Biogas”, GIZ 2013)
The co-digestion calculator will assess a specific mixture containing this substrate.
What it is and where it comes from
Energy willow, most often basket willow (Salix viminalis) and its hybrids, is a shrubby plant grown on short-rotation plantations harvested every 1-4 years. In Poland willow plantations have been present for years on marginal land, but they occupy a small area, and the biomass goes mainly to combustion as wood chips. The set contains one-year shoots and samples described generally as willow, tested at mesophilic temperature.
Properties relevant to digestion
Willow shoots are lignocellulosic: they contain cellulose, hemicelluloses and lignin, the share of which increases with shoot age. Young, one-year shoots have more soft tissue, bark and readily available components than multi-year wood, so they degrade better. There is little nitrogen, so the C/N ratio is high, and in mono-digestion nitrogen and trace elements may be lacking. The bark contains salicylates and tannins, which in high concentrations can inhibit microorganisms, although this is usually not the main limitation. The material is dry and stiff, so it requires shredding to prevent it from forming a floating crust.
How to read the spread of results
The results differ because the set combines different willow clones and hybrids, shoots of different ages, harvest dates (during the growing season or in winter dormancy) and degrees of shredding. In addition there are the bark share, moisture and the storage method: chips stored in piles lose part of their readily available organic matter. The records come from a small number of studies, and some of them contain many variants of the same trial, so the spread says more about the experimental conditions than about measurement uncertainty. Temperature, test duration and inoculum activity also matter.
In biogas plant practice
Willow is not a typical biogas plant substrate: compared with maize silage or grasses it yields less methane per hectare and requires energy-intensive shredding. It can be considered as a supplement to nitrogen-rich substrates, in a small share. Pretreatment (steam, alkaline, mechanical) is studied, but is not standard. For energy crops grown for installations that wish to meet sustainability criteria, the relevant rules on land and documentation of biomass origin apply. Using willow as a solid fuel is usually simpler and more advantageous in terms of energy.
Methodology in brief
BMP is the amount of methane obtained from volatile solids (VS) in a batch test, given in m³ CH₄ per tonne of VS (numerically the same as NmL CH₄/g VS in the publications) and converted to normal conditions (0 °C, 101.325 kPa). The weighted mean gives each publication a total weight of 1, split equally between its results for the substrate — a paper testing twenty varieties does not outweigh a paper with a single sample. In inter-laboratory programmes the unit is the laboratory (total weight 1), and within it the weight of a test grows with the number of bottles (replicates). Results after pretreatment (e.g. thermal, chemical, enzymatic) are shown separately and are not included in the mean.
Solid lines are curves measured in the tests. Where a publication gives only the final result, we draw a first-order kinetic model, B(t) = B₀·(1 − e−kt): only the end point comes from the publication, and the shape of the curve serves purely as visualisation — do not read the production on a particular day from it. For this substrate k = 0.039 d−1 was assumed (median of rate constants k reported in the sources and/or fitted to the mean measured curves).
The statistics describe the spread of published results — a descriptive compilation, not a meta-analysis or a guarantee of plant yield.
Bibliography
- Lehtomaki, A. Chistensson, K. and Bjornsson, L (2004). Pilot Scale two-stage anaerobic digestion of energy crops. Proceedings Anaerobic Digestion Conference 1763-1766.
- Chynoweth, D.; Turick, C.; Owens, J.; Jerger, D.; Peck, M. (1993). Biochemical methane potential of biomass and waste feedstocks. Biomass and Bioenergy 5(1), 95–111. DOI: 10.1016/0961-9534(93)90010-2 DOI
All sources of the site: bibliography.
Other substrates in the group “Wood and woody biomass”
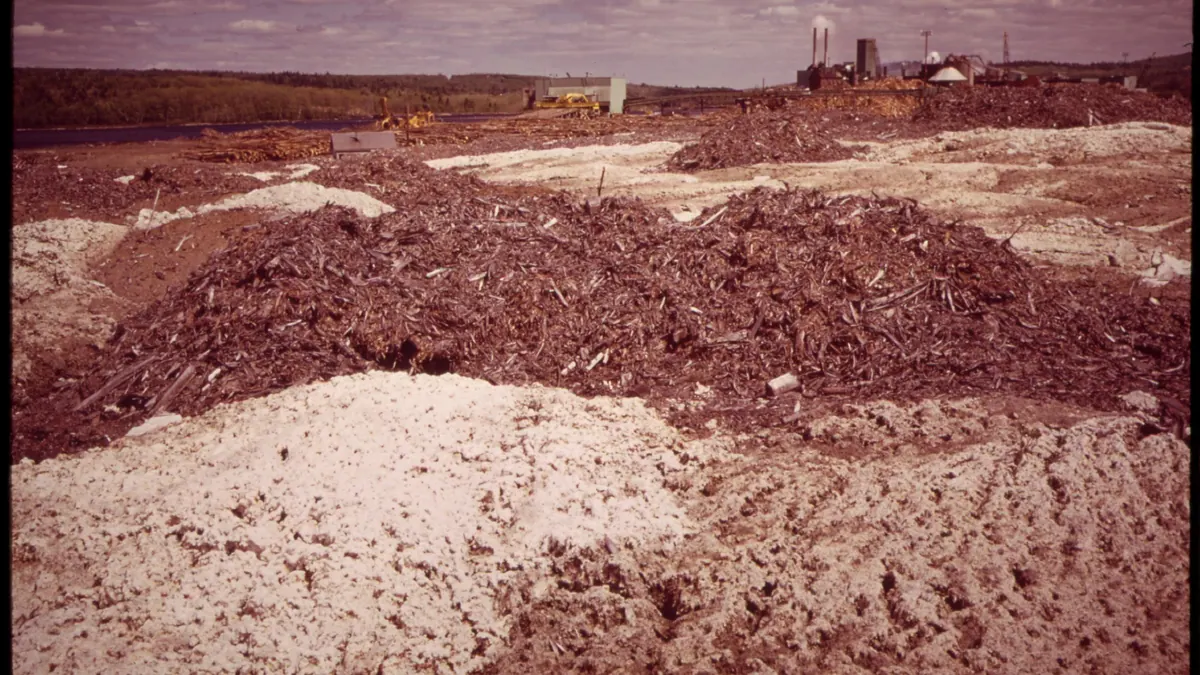
Wood residues from paper industry — BMP: 2 studies, weighted mean 144 m³ CH₄/t VS
144 m³ CH₄/t VS weighted mean from 2 studies
≈52 %
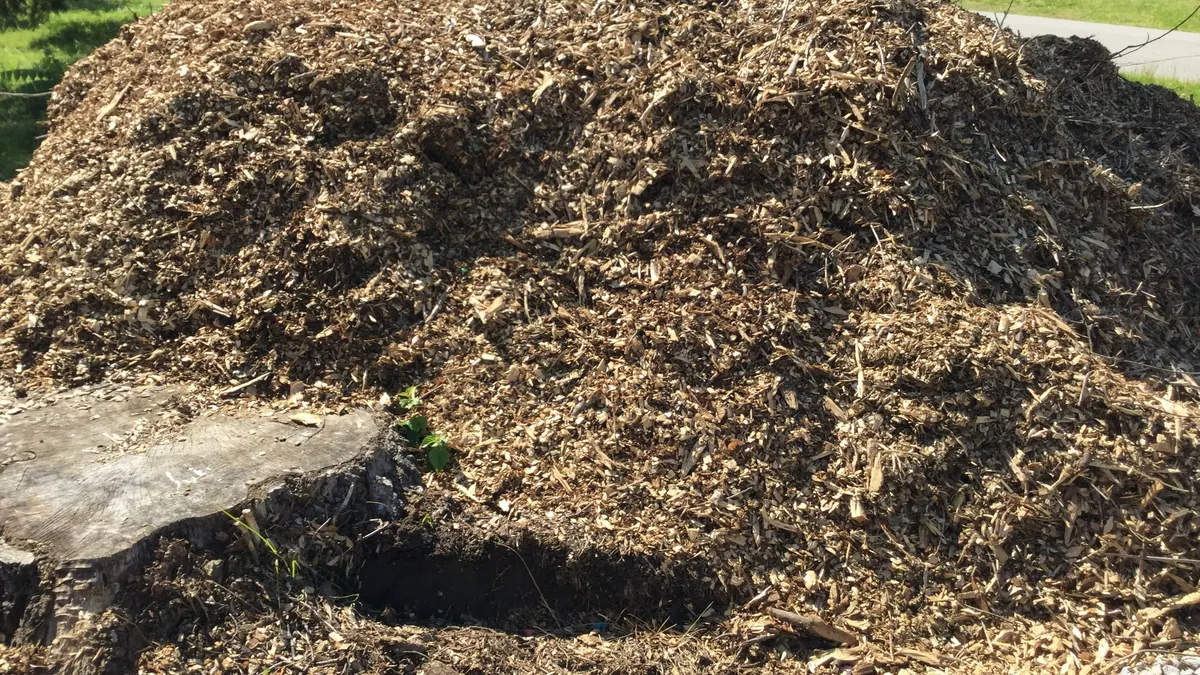
Sawdust and wood chips — BMP: 6 studies, weighted mean 130 m³ CH₄/t VS
130 m³ CH₄/t VS weighted mean from 6 studies
≈52 %
Lignin-rich hydrolysis residue — BMP: 2 studies, weighted mean 105 m³ CH₄/t VS
105 m³ CH₄/t VS weighted mean from 2 studies
≈52 %
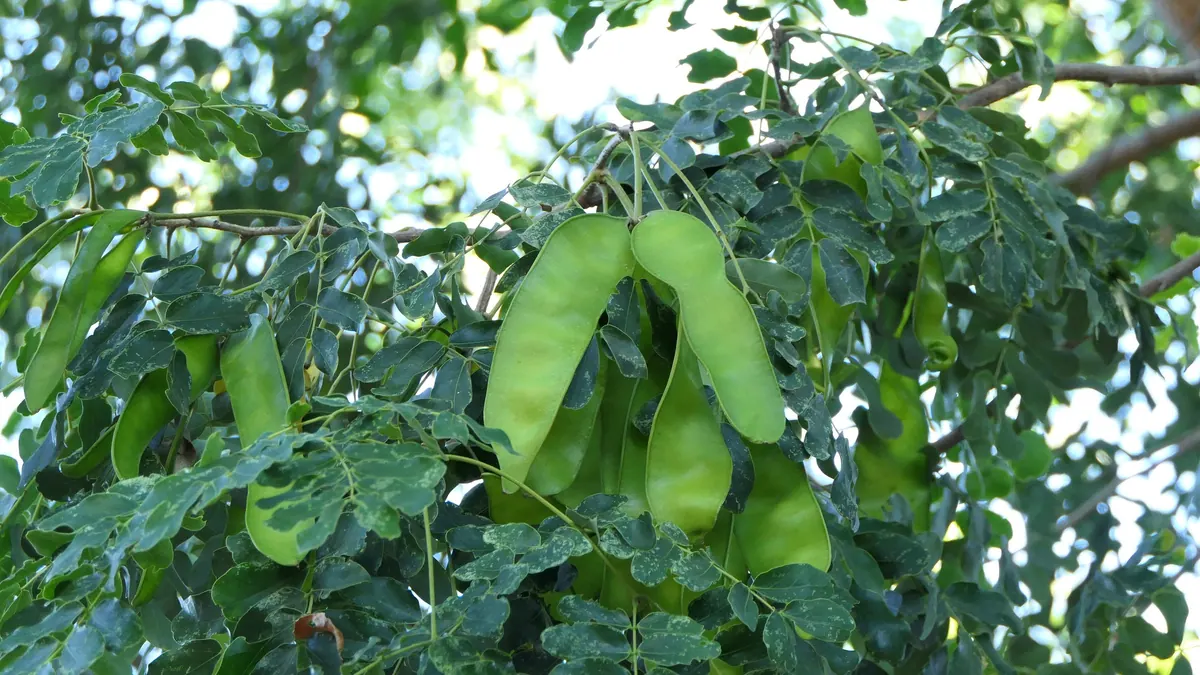
Albizia wood chips and leaves — BMP: 2 studies, weighted mean 137 m³ CH₄/t VS
137 m³ CH₄/t VS weighted mean from 2 studies
neutral — editorial rating for biogas plants≈54 %