

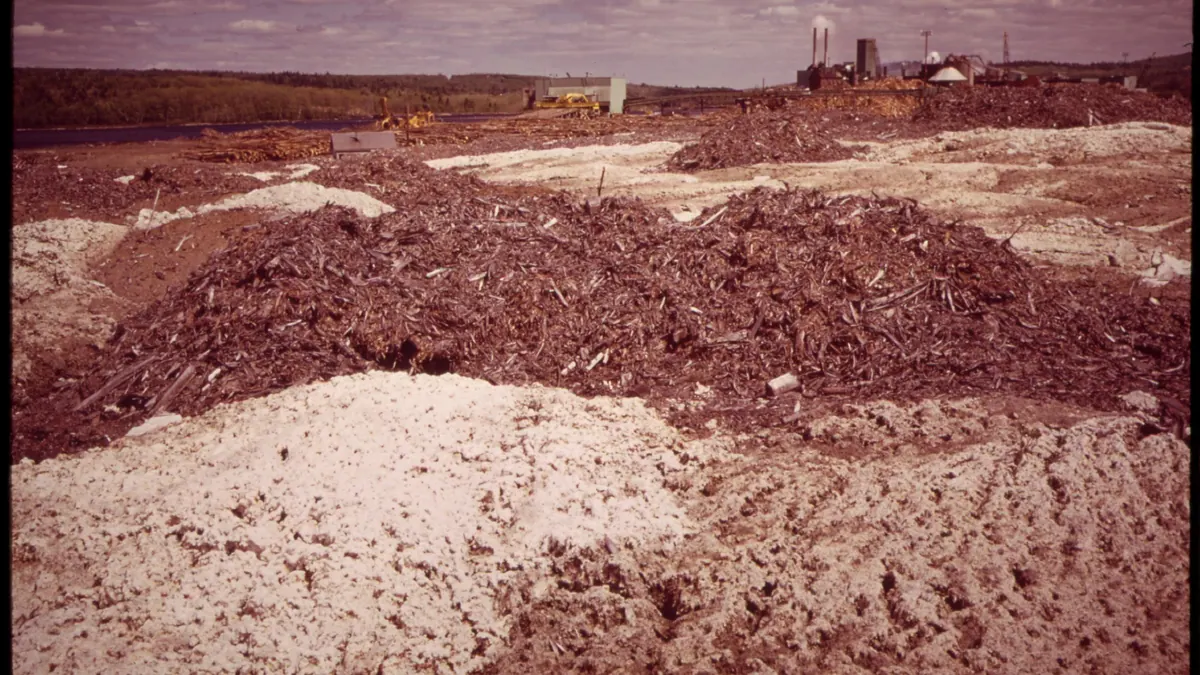
BMP testingWood and woody biomasssingle study (2 samples)
Wood residues from paper industry — BMP: 2 studies, weighted mean 144 m³ CH₄/t VS
Wood waste from the paper industry (bark, fine wood fractions) digests poorly because of the lignin; it was examined at 37 and 55 °C in a single study.
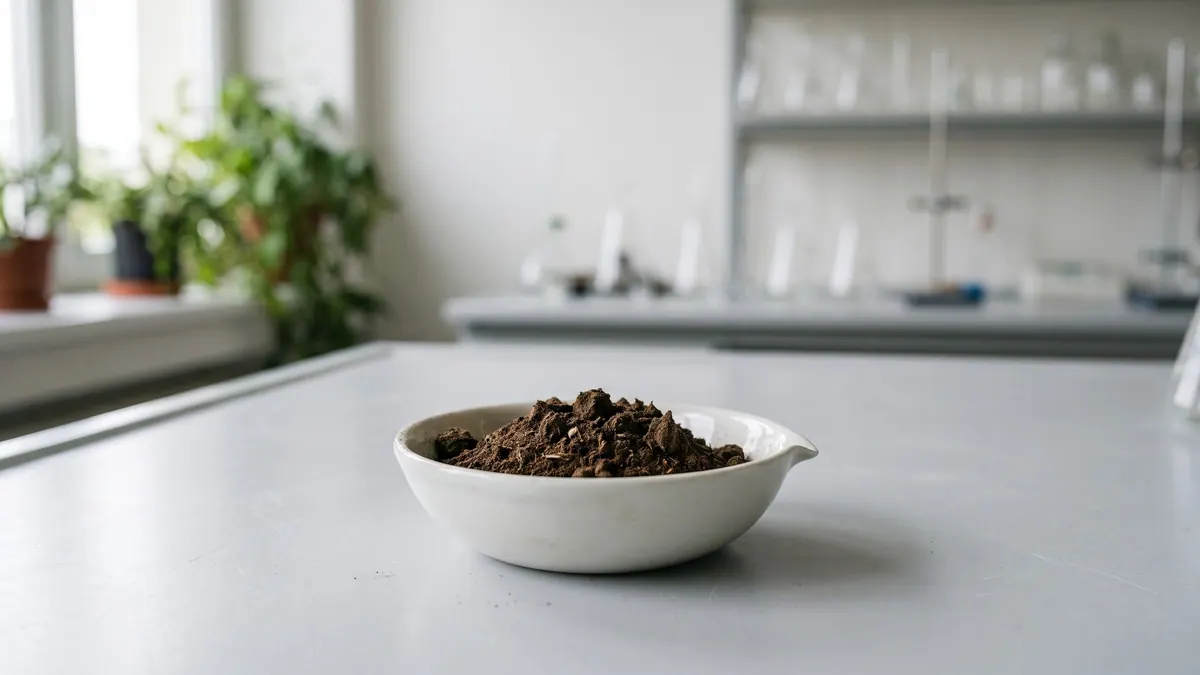
Photo Lee Lockwood / Wikimedia Commons, public domain, source file; changes: cropping

- Weighted mean
- 144m³ CH₄/t VS
- Range
- 116–171m³ CH₄/t VS
- Records
- 2single study (2 samples)
- Publications
- 1source
- Temperatures
- 37 °C, 55 °Cof the test
Methane in biogas
Medium methane content · ≈ 5.2 kWh/m³ of biogas
estimate from the substrate type The collected studies contain no measurement. The interval follows from the approximate composition (carbohydrate-dominated (no protein or fat characteristics)) and the yields of compound groups according to FNR.
Rating for biogas plants
not rated — editorial rating for biogas plants
Not rated: no dry matter or volatile solids in the data. We calculate the rating when the dry matter and volatile solids of the material are known.
Add to the co-digestion calculator CSV data
BMP curves from 2 studies
Weighted mean Individual records
Dashed lines are a model curve (first-order kinetics, B(t) = B₀·(1 − e−kt)); the end point comes from the publication. All curves are model curves.
Cumulative methane production over the test [m³ CH₄/t VS]. The thick line is the weighted mean of all records (144); dots mark the end values given in the publications. Point at the chart to read values; click a legend item to hide or show a record.
Records and sources
Download CSV| Source | BMP m³ CH₄/t VS | Temperature | Sample | Curve |
|---|---|---|---|---|
| Walter et al. (2016) · 1 DOI | 116 | 37 °C · mesophilic | Wood residues (WR), non-pretreated, 37 C | end point (model curve) |
| Walter et al. (2016) · 2 DOI | 171 | 55 °C · thermophilic | Wood residues (WR), non-pretreated, 55 C | end point (model curve) |
| Weighted mean | 144 | arithmetic mean 144, SD 39 | ||
Process properties
Advantages
- Methane potential in the database: weighted mean 144 m³ CH₄/t VS (median 144; range 116–171; 2 records from 1 sources).
Drawbacks and risks
- Spread of results in the database: standard deviation 39 at a mean of 144 m³ CH₄/t VS (2 records from 1 sources).
Co-digestion — what to combine it with, what to watch out for
- combines well
group: Animal excreta (slurry, manure, poultry litter)
Manure/slurry supplies N and P as well as buffer.[1]
- caution
substrates: sulphur-rich — e.g. Pulp and paper mill biosludge, Pig slurry, Municipal sewage sludge (mixed), Beach-cast macroalgae (mix), Pig manure (solid)
Waste from the sulphate process may contain sulphates (H2S in the biogas) — do not combine with other sulphur sources without monitoring.[2][3]
Dosing
No source-based dose limits in co-digestion; add gradually and after a BMP test. The results relate to the specific streams described in Walter 2016.
Introduce gradually, starting with a small dose and monitoring the process (e.g. FOS/TAC, pH, gas composition).
Practical requirements
- Shred: shredding increases the surface available for degradation and speeds it up, but does not necessarily raise the final gas yield (FNR 2010, Ch. 3 “Triturado”).
- Remove foreign contaminants before dosing: material from biowaste may contain interfering substances, and the co-substrate should be free of them (FNR 2010, Ch. 3).
Sources of the process data
- Weiland, P. (2010) Biogas production: current state and perspectives. Applied Microbiology and Biotechnology
- Walter, A.; Silberberger, S.; Juárez, M.F.D.; Insam, H.; Franke-Whittle, I.H. (2016) Biomethane potential of industrial paper wastes and investigation of the methanogenic communities involved. Biotechnology for Biofuels 9(1), 21
- Chen, Y.; Cheng, J.J.; Creamer, K.S. (2008) Inhibition of anaerobic digestion process: A review. Bioresource Technology
- Dahunsi, S. (2019) Mechanical pretreatment of lignocelluloses for enhanced biogas production: Methane yield prediction from biomass structural components. Bioresource Technology 280, 18–26
- Hendriks, A.T.W.M.; Zeeman, G. (2009) Pretreatments to enhance the digestibility of lignocellulosic biomass. Bioresource Technology
- FNR (2010). Guía sobre el Biogás – Desde la producción hasta el uso (hiszp. wydanie „Leitfaden Biogas”, GIZ 2013)
The co-digestion calculator will assess a specific mixture containing this substrate.
What it is and where it comes from
Wood waste from paper mills arises during the preparation of wood for pulp production: debarking, chipping and screening. It includes bark, fine chips, screening rejects and fine wood fractions. The dataset includes one study describing these wastes, without pretreatment, in tests at 37 °C and 55 °C. In paper mills such waste is usually sent for combustion in the mills' own boilers.
Properties relevant to digestion
The material consists of wood fibres and bark. Bark contains considerable amounts of lignin, tannins and other phenolic compounds, which can inhibit methanogenic bacteria. Cellulose is protected by lignin, so hydrolysis is slow. The low protein and nitrogen content gives a high C/N ratio, which requires supplementation with nitrogen in the mix. However, fine particles have a larger contact surface than coarse chips, which partly improves availability.
How to read the spread of results
The dataset consists of a small number of records from a single publication, differing in temperature, so the difference results mainly from the test conditions, not from different materials. More generally, the result is determined by the composition of the waste: the wood species, the share of bark, moisture and comminution, as well as the storage time, because during storage some of the readily available compounds are degraded or leached. The inoculum and the length of the experiment also have an effect.
In biogas plant practice
Wood waste from paper mills does not usually go to agricultural biogas plants. Combustion at the place of origin remains the better way of managing it. If digestion is considered, thorough comminution and a check for the presence of inhibitory compounds are necessary. The material is an industrial waste, and its acceptance requires an appropriate waste code and the installation's permit. The data are informational and do not justify planning an investment.
For comparison: biological sludges and fibre wastes from the same industry digest better than wood fractions and are therefore studied more often as substrates. Bark and fine wood are rather an energy waste of the plant, and only after pretreatment could they compete as a feedstock for digestion.
Before deciding on digestion, it is also worth measuring the moisture and the share of bark in the specific batch.
Methodology in brief
BMP is the amount of methane obtained from volatile solids (VS) in a batch test, given in m³ CH₄ per tonne of VS (numerically the same as NmL CH₄/g VS in the publications) and converted to normal conditions (0 °C, 101.325 kPa). The weighted mean gives each publication a total weight of 1, split equally between its results for the substrate — a paper testing twenty varieties does not outweigh a paper with a single sample. In inter-laboratory programmes the unit is the laboratory (total weight 1), and within it the weight of a test grows with the number of bottles (replicates). Results after pretreatment (e.g. thermal, chemical, enzymatic) are shown separately and are not included in the mean.
Solid lines are curves measured in the tests. Where a publication gives only the final result, we draw a first-order kinetic model, B(t) = B₀·(1 − e−kt): only the end point comes from the publication, and the shape of the curve serves purely as visualisation — do not read the production on a particular day from it. For this substrate k = 0.039 d−1 was assumed (median of rate constants k reported in the sources and/or fitted to the mean measured curves).
The statistics describe the spread of published results — a descriptive compilation, not a meta-analysis or a guarantee of plant yield.
Bibliography
- Walter, A.; Silberberger, S.; Juárez, M.F.D.; Insam, H.; Franke-Whittle, I.H. (2016). Biomethane potential of industrial paper wastes and investigation of the methanogenic communities involved. Biotechnology for Biofuels 9(1), 21. DOI: 10.1186/s13068-016-0435-z DOI
All sources of the site: bibliography.
Other substrates in the group “Wood and woody biomass”
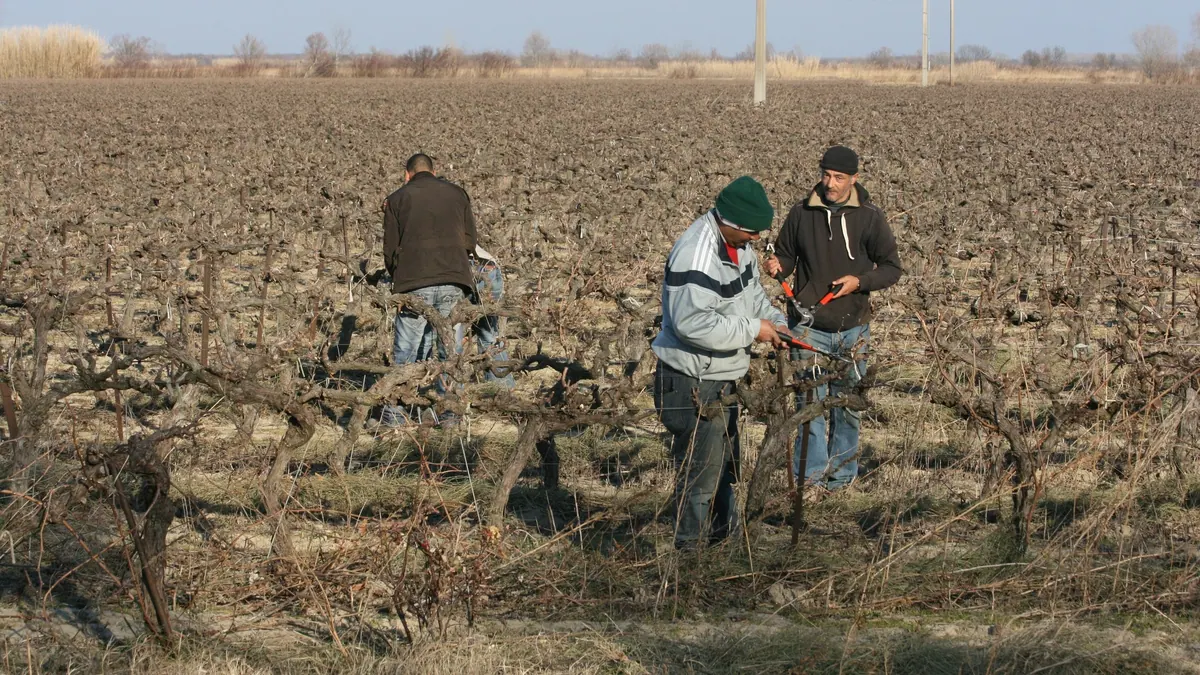
Olive and vine prunings — BMP: 2 studies, weighted mean 55 m³ CH₄/t VS
55 m³ CH₄/t VS weighted mean from 2 studies
≈52 %
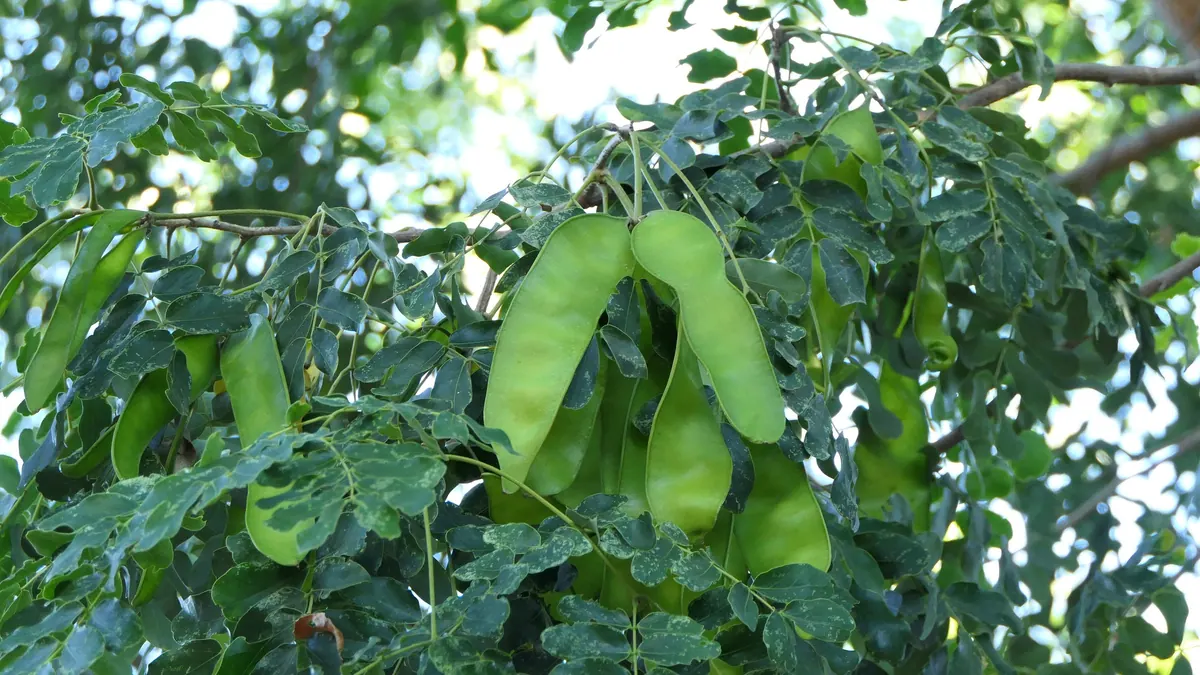
Albizia wood chips and leaves — BMP: 2 studies, weighted mean 137 m³ CH₄/t VS
137 m³ CH₄/t VS weighted mean from 2 studies
neutral — editorial rating for biogas plants≈54 %
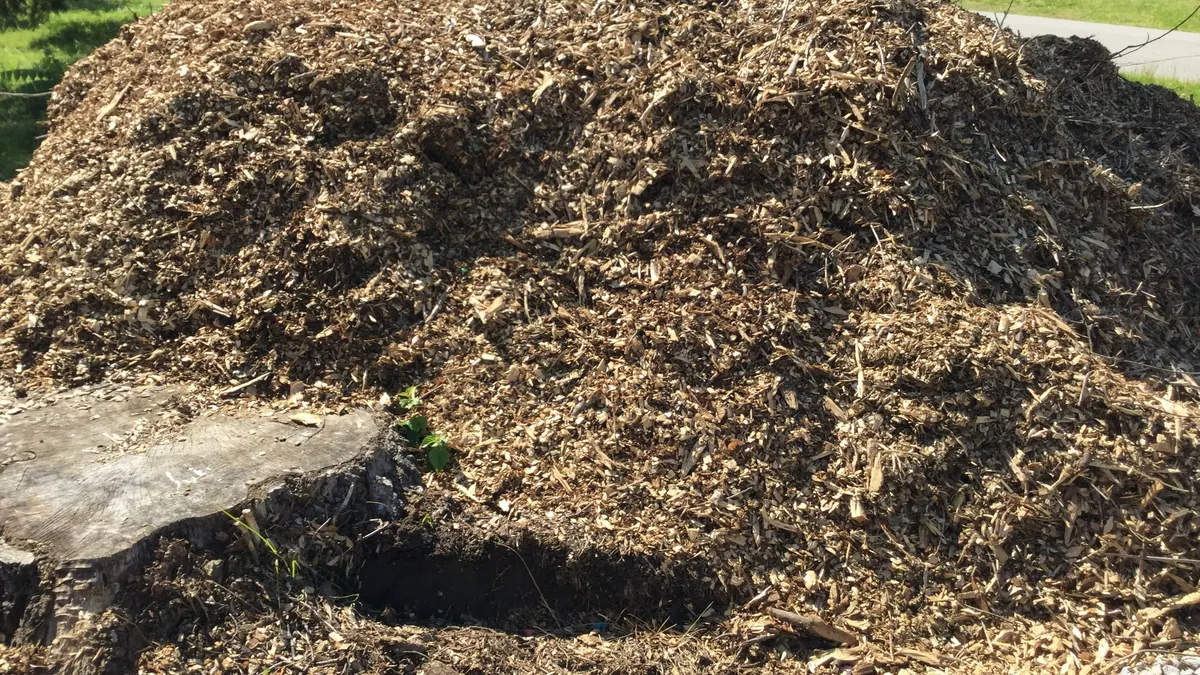
Sawdust and wood chips — BMP: 6 studies, weighted mean 130 m³ CH₄/t VS
130 m³ CH₄/t VS weighted mean from 6 studies
≈52 %
Lignin-rich hydrolysis residue — BMP: 2 studies, weighted mean 105 m³ CH₄/t VS
105 m³ CH₄/t VS weighted mean from 2 studies
≈52 %