

BMP testingWood and woody biomasssingle study (2 samples)
Olive and vine prunings — BMP: 2 studies, weighted mean 55 m³ CH₄/t VS
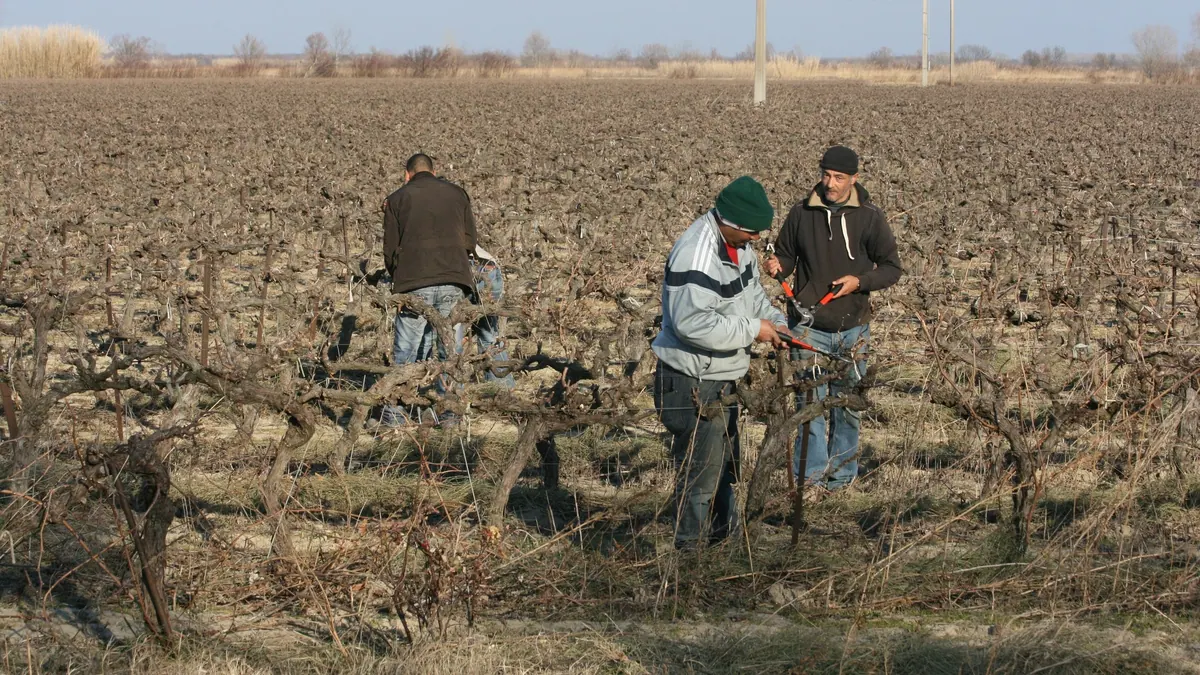
Vine and olive tree prunings are woody orchard wastes; the compilation brings together the results of a thermophilic test from one study for both materials.
Photo Deuxtroy / Wikimedia Commons, licence CC BY-SA 3.0, source file; changes: cropping

- Weighted mean
- 55m³ CH₄/t VS
- Range
- 54–57m³ CH₄/t VS
- Records
- 2single study (2 samples)
- Publications
- 1source
- Temperatures
- 55 °Cof the test
Methane in biogas
Medium methane content · ≈ 5.2 kWh/m³ of biogas
estimate from the substrate type The collected studies contain no measurement. The interval follows from the approximate composition (carbohydrate-dominated (no protein or fat characteristics)) and the yields of compound groups according to FNR.
Rating for biogas plants
not rated — editorial rating for biogas plants
Not rated: no dry matter or volatile solids in the data. We calculate the rating when the dry matter and volatile solids of the material are known.
Add to the co-digestion calculator CSV data
BMP curves from 2 studies
Weighted mean Individual records
Dashed lines are a model curve (first-order kinetics, B(t) = B₀·(1 − e−kt)); the end point comes from the publication. All curves are model curves.
Cumulative methane production over the test [m³ CH₄/t VS]. The thick line is the weighted mean of all records (55); dots mark the end values given in the publications. Point at the chart to read values; click a legend item to hide or show a record.
Records and sources
Download CSV| Source | BMP m³ CH₄/t VS | Temperature | Sample | Curve |
|---|---|---|---|---|
| Nitsos et al. (2015) · 1 DOI | 54 | 55 °C · thermophilic | vine pruning (untreated VP) | end point (model curve) |
| Nitsos et al. (2015) · 2 DOI | 57 | 55 °C · thermophilic | olive pruning (untreated OP) | end point (model curve) |
| Weighted mean | 55 | arithmetic mean 55, SD 2 | ||
Process properties
Low confidence: the description is based on general characteristics of the substrate group, not on studies of this material. Treat it as a hint to be verified.
Advantages
- Methane potential in the database: weighted mean 55 m³ CH₄/t VS (median 55; range 54–57; 2 records from 1 sources).
Drawbacks and risks
- Woody material requires pretreatment and size reduction (Hendriks 2009); in the database, results from one paper under thermophilic conditions.
- Spread of results in the database: standard deviation 2 at a mean of 55 m³ CH₄/t VS (2 records from 1 sources).
Dosing
No source-based dose limits; the results (one paper, a thermophilic test) do not allow doses to be set, treat as a lignocellulosic additive.
Practical requirements
- Shred: shredding increases the surface available for degradation and speeds it up, but does not necessarily raise the final gas yield (FNR 2010, Ch. 3 “Triturado”).
Sources of the process data
- Nitsos, C.; Matsakas, L.; Triantafyllidis, K.; Rova, U.; Christakopoulos, P. (2015) Evaluation of Mediterranean Agricultural Residues as a Potential Feedstock for the Production of Biogas via Anaerobic Fermentation. BioMed Research International 2015, 1–6
- Dahunsi, S. (2019) Mechanical pretreatment of lignocelluloses for enhanced biogas production: Methane yield prediction from biomass structural components. Bioresource Technology 280, 18–26
- Hendriks, A.T.W.M.; Zeeman, G. (2009) Pretreatments to enhance the digestibility of lignocellulosic biomass. Bioresource Technology
- Weiland, P. (2010) Biogas production: current state and perspectives. Applied Microbiology and Biotechnology
- FNR (2010). Guía sobre el Biogás – Desde la producción hasta el uso (hiszp. wydanie „Leitfaden Biogas”, GIZ 2013)
The co-digestion calculator will assess a specific mixture containing this substrate.
What it is and where it comes from
Prunings arise annually from maintenance operations in vineyards and olive groves: thin branches and shoots with one-year-old and older wood. In growing regions they are a troublesome waste, because they are often burned in the field, which entails emissions and fire risk. In Poland vineyards are present, but their scale is small, and olive trees do not occur. The entry groups two materials from one study: vine prunings and olive prunings.
Properties relevant to digestion
This is lignocellulosic biomass with a marked share of lignin and polyphenols. The woody structure hinders hydrolysis, and the low protein share gives a high C/N ratio. The material is dry, so it does not introduce a large amount of water into the system, but it requires wetting and size reduction. Another limitation is the possibility of contaminants: residues of plant protection products used in vineyards may be present on the tissues.
How to read the spread of results
The records come from one publication and one temperature (thermophilic), so the variability between laboratories is unknown. The difference between vine and olive stems from the different chemical composition of the wood. The variety, age of the shoots, share of leaves, moisture at harvest and particle size after milling also have an effect. In publications prunings are often tested in parallel after pretreatment; such results do not fit into the compilation of raw material.
In biogas plant practice
Prunings can supplement the mix as a structural material, but the rate of degradation is low, and the cost of size reduction and of the logistics of collecting a dispersed waste is sometimes high. A more sensible use is sometimes composting, processing into fuel chips or bedding. When digestion is considered, size reduction is applied, possibly steam or chemical pretreatment, and a BMP test on your own batch. Residues of plant protection products should also be checked.
Methodology in brief
BMP is the amount of methane obtained from volatile solids (VS) in a batch test, given in m³ CH₄ per tonne of VS (numerically the same as NmL CH₄/g VS in the publications) and converted to normal conditions (0 °C, 101.325 kPa). The weighted mean gives each publication a total weight of 1, split equally between its results for the substrate — a paper testing twenty varieties does not outweigh a paper with a single sample. In inter-laboratory programmes the unit is the laboratory (total weight 1), and within it the weight of a test grows with the number of bottles (replicates). Results after pretreatment (e.g. thermal, chemical, enzymatic) are shown separately and are not included in the mean.
Solid lines are curves measured in the tests. Where a publication gives only the final result, we draw a first-order kinetic model, B(t) = B₀·(1 − e−kt): only the end point comes from the publication, and the shape of the curve serves purely as visualisation — do not read the production on a particular day from it. For this substrate k = 0.039 d−1 was assumed (median of rate constants k reported in the sources and/or fitted to the mean measured curves).
The statistics describe the spread of published results — a descriptive compilation, not a meta-analysis or a guarantee of plant yield.
Bibliography
- Nitsos, C.; Matsakas, L.; Triantafyllidis, K.; Rova, U.; Christakopoulos, P. (2015). Evaluation of Mediterranean Agricultural Residues as a Potential Feedstock for the Production of Biogas via Anaerobic Fermentation. BioMed Research International 2015, 1–6. DOI: 10.1155/2015/171635 DOI
All sources of the site: bibliography.
Other substrates in the group “Wood and woody biomass”
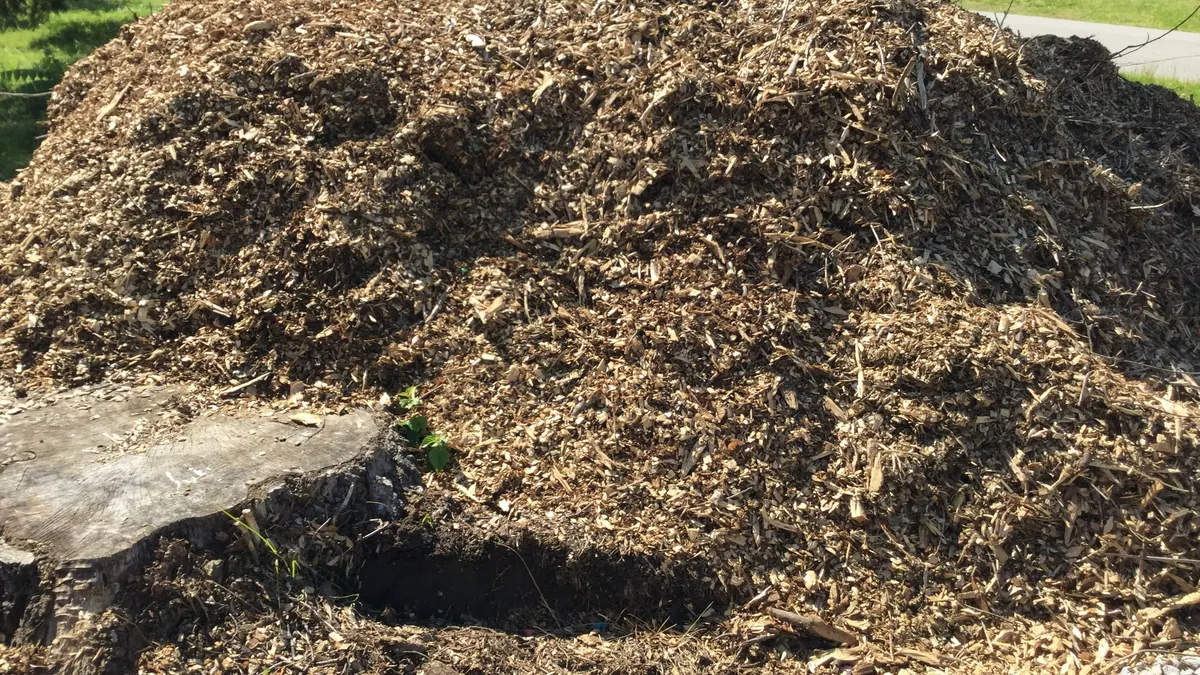
Sawdust and wood chips — BMP: 6 studies, weighted mean 130 m³ CH₄/t VS
130 m³ CH₄/t VS weighted mean from 6 studies
≈52 %
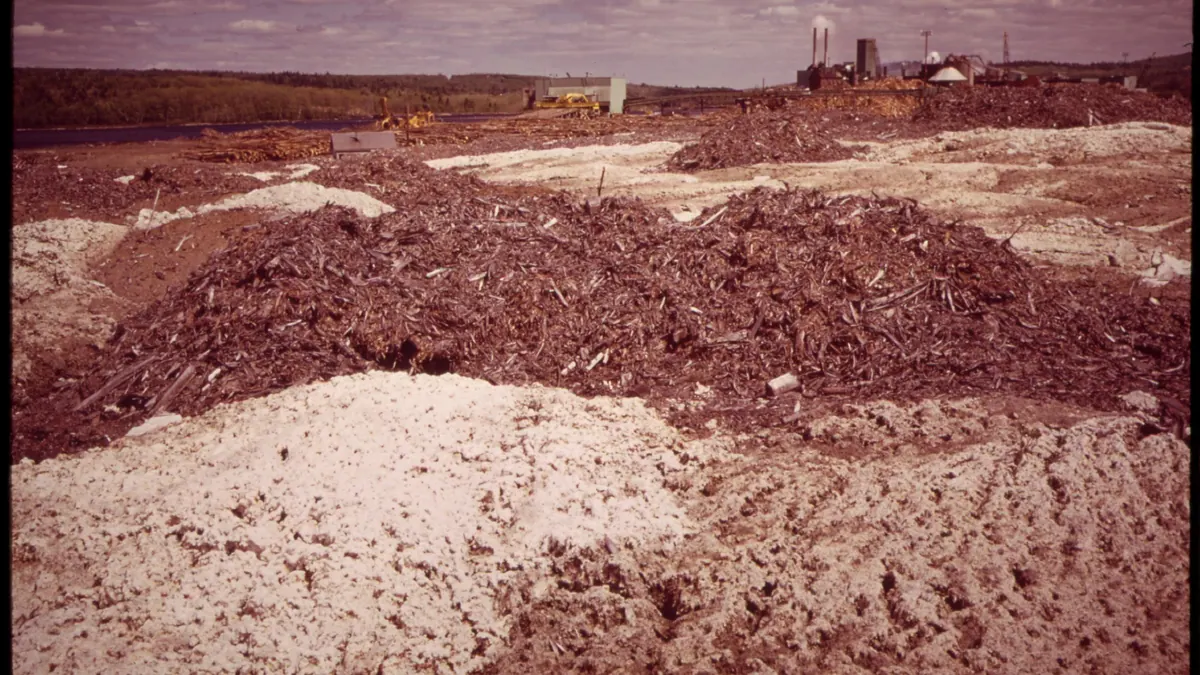
Wood residues from paper industry — BMP: 2 studies, weighted mean 144 m³ CH₄/t VS
144 m³ CH₄/t VS weighted mean from 2 studies
≈52 %
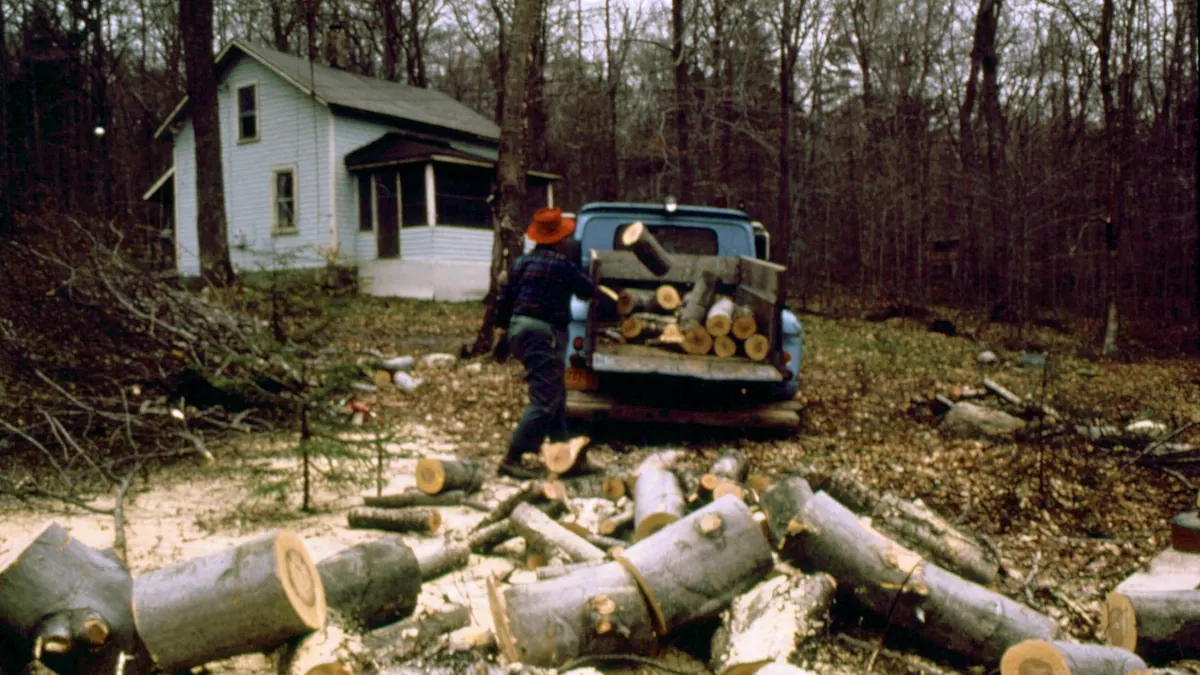
Hardwood — BMP: 8 studies, weighted mean 153 m³ CH₄/t VS
153 m³ CH₄/t VS weighted mean from 8 studies
neutral — editorial rating for biogas plants≈52 %
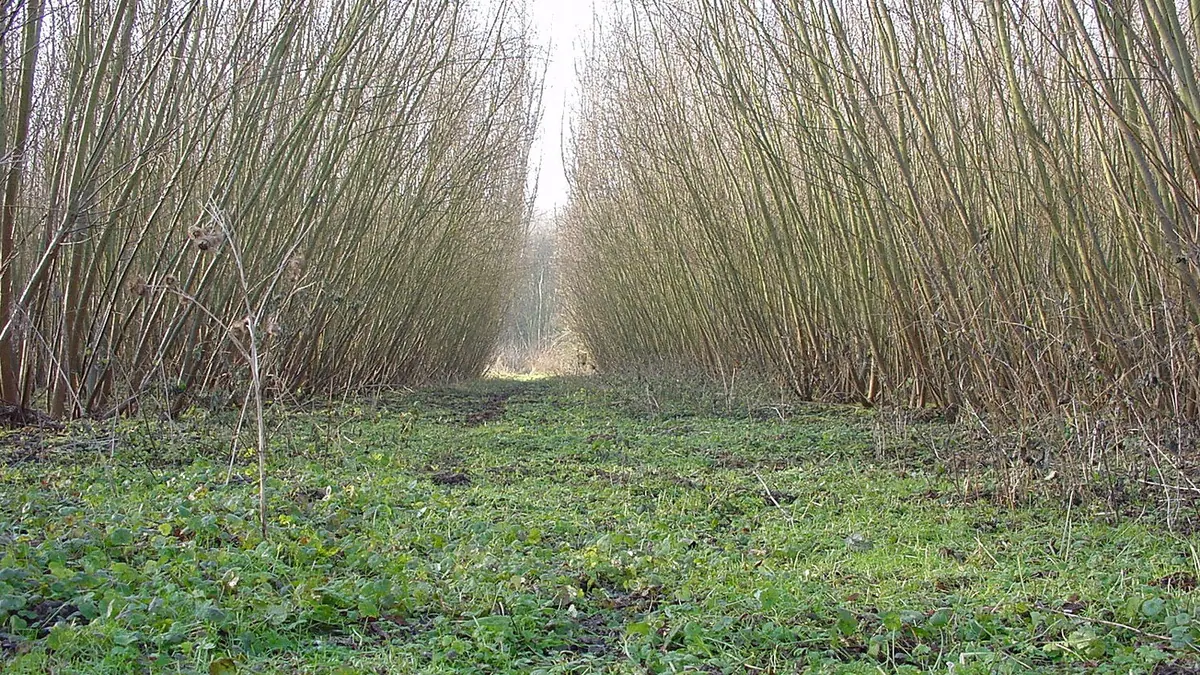
Willow (short rotation) — BMP: 14 studies, weighted mean 259 m³ CH₄/t VS
259 m³ CH₄/t VS weighted mean from 14 studies
≈52 %