

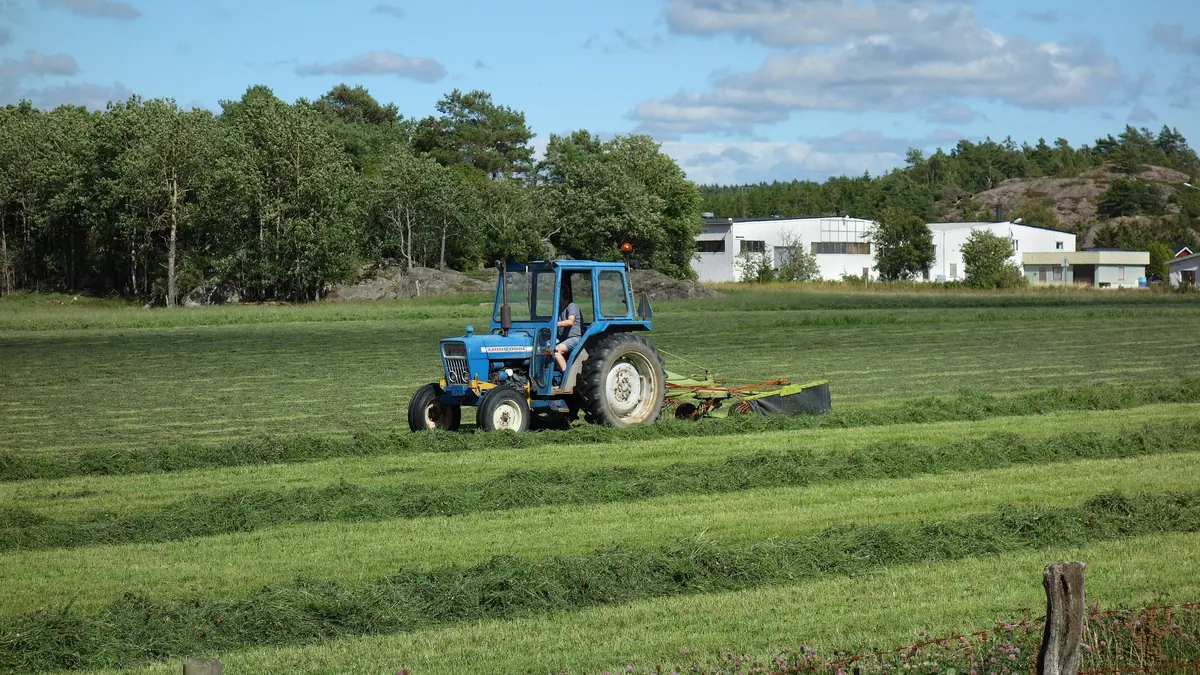
BMP testingGrasses, green forage and fodder plants
Grass (fresh and silage) — BMP: 145 studies, weighted mean 345 m³ CH₄/t VS
Grasses from grassland, fresh or ensiled, are one of the best-studied agricultural substrates. The result depends on species composition, cutting date and intensity of use.
rating: goodCH₄ ≈ 53 % (estimate)
Photo W.carter / Wikimedia Commons, licence CC BY-SA 4.0, source file; changes: cropping

- Weighted mean
- 345m³ CH₄/t VS
- Range
- 164–479m³ CH₄/t VS
- Records
- 145studies
- Publications
- 7sources
- Temperatures
- 36 °C, 37 °C, 38 °C, 39 °C, 55 °Cof the test
Methane in biogas
Medium methane content · ≈ 5.2 kWh/m³ of biogas
estimate from the substrate type The collected studies contain no measurement. The interval follows from the approximate composition (protein from total nitrogen (N 1.4 % DM × 6.25)) and the yields of compound groups according to FNR.
Rating for biogas plants
good — editorial rating for biogas plantsStable, usually accepted without a fee
Potential per tonne of fresh matter: high (68 m³ CH₄/t); no particular threats to stability. Handling costs: fibres, floating layer.
Why? Rating factors
Potential per tonne +2
- +2potential 68 m³ CH₄/t fresh matter (BMP 345 × DM 21.6 % × VS 90.7 %)
Process stability 0
- 0no factors
Handling and costs −0.5
- −0.5fibres, floating layer — shredding and intensive mixing
Total points: 1.5 · thresholds: ≥ 2.5 very good, ≥ 1 good, below — neutral; negative with cumulative process risk.
Add to the co-digestion calculator CSV data
BMP curves from 145 studies
Weighted mean Individual records
Dashed lines are a model curve (first-order kinetics, B(t) = B₀·(1 − e−kt)); the end point comes from the publication. All curves are model curves.
Cumulative methane production over the test [m³ CH₄/t VS]. The thick line is the weighted mean of all records (345); dots mark the end values given in the publications. Point at the chart to read values; click a legend item to hide or show a record.
Show the remaining records in the legend (133)
Records and sources
Download CSV| Source | BMP m³ CH₄/t VS | Temperature | Sample | Curve |
|---|---|---|---|---|
| Buffiere et al. (2006) DOI | 388 | 55 °C · thermophilic | Grass | end point (model curve) |
| Cu et al. (2014) DOI | 220 | 37 °C · mesophilic | grass | end point (model curve) |
| Dandikas et al. (2015) · 1 DOI | 314 | 39 °C · mesophilic | grass · pretreatment: particle size reduction/sample preparation (MY-D: physical treatment) | end point (model curve) |
| Dandikas et al. (2015) · 2 DOI | 317 | 39 °C · mesophilic | grass · pretreatment: particle size reduction/sample preparation (MY-D: physical treatment) | end point (model curve) |
| Dandikas et al. (2015) · 3 DOI | 323 | 39 °C · mesophilic | grass · pretreatment: particle size reduction/sample preparation (MY-D: physical treatment) | end point (model curve) |
| Dandikas et al. (2015) · 4 DOI | 326 | 39 °C · mesophilic | grass · pretreatment: particle size reduction/sample preparation (MY-D: physical treatment) | end point (model curve) |
| Dandikas et al. (2015) · 5 DOI | 329 | 39 °C · mesophilic | grass · pretreatment: particle size reduction/sample preparation (MY-D: physical treatment) | end point (model curve) |
| Dandikas et al. (2015) · 6 DOI | 331 | 39 °C · mesophilic | grass · pretreatment: particle size reduction/sample preparation (MY-D: physical treatment) | end point (model curve) |
| Dandikas et al. (2015) · 7 DOI | 332 | 39 °C · mesophilic | grass · pretreatment: particle size reduction/sample preparation (MY-D: physical treatment) | end point (model curve) |
| Dandikas et al. (2015) · 8 DOI | 336 | 39 °C · mesophilic | grass · pretreatment: particle size reduction/sample preparation (MY-D: physical treatment) | end point (model curve) |
| Dandikas et al. (2015) · 9 DOI | 340 | 39 °C · mesophilic | grass · pretreatment: particle size reduction/sample preparation (MY-D: physical treatment) | end point (model curve) |
| Dandikas et al. (2015) · 10 DOI | 341 | 39 °C · mesophilic | grass · pretreatment: particle size reduction/sample preparation (MY-D: physical treatment) | end point (model curve) |
| Dandikas et al. (2015) · 11 DOI | 342 | 39 °C · mesophilic | grass · pretreatment: particle size reduction/sample preparation (MY-D: physical treatment) | end point (model curve) |
| Dandikas et al. (2015) · 12 DOI | 345 | 39 °C · mesophilic | grass · pretreatment: particle size reduction/sample preparation (MY-D: physical treatment) | end point (model curve) |
| Dandikas et al. (2015) · 13 DOI | 346 | 39 °C · mesophilic | grass · pretreatment: particle size reduction/sample preparation (MY-D: physical treatment) | end point (model curve) |
| Dandikas et al. (2015) · 14 DOI | 347 | 39 °C · mesophilic | grass · pretreatment: particle size reduction/sample preparation (MY-D: physical treatment) | end point (model curve) |
| Dandikas et al. (2015) · 15 DOI | 355 | 39 °C · mesophilic | grass · pretreatment: particle size reduction/sample preparation (MY-D: physical treatment) | end point (model curve) |
| Dandikas et al. (2015) · 16 DOI | 359 | 39 °C · mesophilic | grass · pretreatment: particle size reduction/sample preparation (MY-D: physical treatment) | end point (model curve) |
| Dandikas et al. (2015) · 17 DOI | 360 | 39 °C · mesophilic | grass · pretreatment: particle size reduction/sample preparation (MY-D: physical treatment) | end point (model curve) |
| Dandikas et al. (2015) · 18 DOI | 362 | 39 °C · mesophilic | grass · pretreatment: particle size reduction/sample preparation (MY-D: physical treatment) | end point (model curve) |
| Dandikas et al. (2015) · 19 DOI | 364 | 39 °C · mesophilic | grass · pretreatment: particle size reduction/sample preparation (MY-D: physical treatment) | end point (model curve) |
| Dandikas et al. (2015) · 20 DOI | 368 | 39 °C · mesophilic | grass · pretreatment: particle size reduction/sample preparation (MY-D: physical treatment) | end point (model curve) |
| Dandikas et al. (2015) · 21 DOI | 369 | 39 °C · mesophilic | grass · pretreatment: particle size reduction/sample preparation (MY-D: physical treatment) | end point (model curve) |
| Dandikas et al. (2015) · 22 DOI | 371 | 39 °C · mesophilic | grass · pretreatment: particle size reduction/sample preparation (MY-D: physical treatment) | end point (model curve) |
| Dandikas et al. (2015) · 23 DOI | 372 | 39 °C · mesophilic | grass · pretreatment: particle size reduction/sample preparation (MY-D: physical treatment) | end point (model curve) |
| Dandikas et al. (2015) · 24 DOI | 374 | 39 °C · mesophilic | grass · pretreatment: particle size reduction/sample preparation (MY-D: physical treatment) | end point (model curve) |
| Dandikas et al. (2015) · 25 DOI | 376 | 39 °C · mesophilic | grass · pretreatment: particle size reduction/sample preparation (MY-D: physical treatment) | end point (model curve) |
| Dandikas et al. (2015) · 26 DOI | 380 | 39 °C · mesophilic | grass · pretreatment: particle size reduction/sample preparation (MY-D: physical treatment) | end point (model curve) |
| Dandikas et al. (2015) · 27 DOI | 382 | 39 °C · mesophilic | grass · pretreatment: particle size reduction/sample preparation (MY-D: physical treatment) | end point (model curve) |
| Dandikas et al. (2015) · 28 DOI | 385 | 39 °C · mesophilic | grass · pretreatment: particle size reduction/sample preparation (MY-D: physical treatment) | end point (model curve) |
| Dandikas et al. (2015) · 29 DOI | 388 | 39 °C · mesophilic | grass · pretreatment: particle size reduction/sample preparation (MY-D: physical treatment) | end point (model curve) |
| Dandikas et al. (2015) · 30 DOI | 389 | 39 °C · mesophilic | grass · pretreatment: particle size reduction/sample preparation (MY-D: physical treatment) | end point (model curve) |
| Dandikas et al. (2015) · 31 DOI | 394 | 39 °C · mesophilic | grass · pretreatment: particle size reduction/sample preparation (MY-D: physical treatment) | end point (model curve) |
| Dandikas et al. (2015) · 32 DOI | 422 | 39 °C · mesophilic | grass · pretreatment: particle size reduction/sample preparation (MY-D: physical treatment) | end point (model curve) |
| Kaiser (2007) · 1 | 164 | 37 °C · mesophilic | grass silage | end point (model curve) |
| Kaiser (2007) · 2 | 198 | 37 °C · mesophilic | fresh grass | end point (model curve) |
| Kaiser (2007) · 3 | 199 | 37 °C · mesophilic | fresh grass | end point (model curve) |
| Kaiser (2007) · 4 | 200 | 37 °C · mesophilic | fresh grass | end point (model curve) |
| Kaiser (2007) · 5 | 201 | 37 °C · mesophilic | grass silage | end point (model curve) |
| Kaiser (2007) · 6 | 203 | 37 °C · mesophilic | grass silage | end point (model curve) |
| Kaiser (2007) · 7 | 204 | 37 °C · mesophilic | grass silage | end point (model curve) |
| Kaiser (2007) · 8 | 206 | 37 °C · mesophilic | fresh grass | end point (model curve) |
| Kaiser (2007) · 9 | 209 | 37 °C · mesophilic | grass silage | end point (model curve) |
| Kaiser (2007) · 10 | 210 | 37 °C · mesophilic | grass silage | end point (model curve) |
| Kaiser (2007) · 11 | 212 | 37 °C · mesophilic | fresh grass | end point (model curve) |
| Kaiser (2007) · 12 | 215 | 37 °C · mesophilic | fresh grass | end point (model curve) |
| Kaiser (2007) · 13 | 217 | 37 °C · mesophilic | grass silage | end point (model curve) |
| Kaiser (2007) · 14 | 219 | 37 °C · mesophilic | grass silage | end point (model curve) |
| Kaiser (2007) · 15 | 221 | 37 °C · mesophilic | grass silage | end point (model curve) |
| Kaiser (2007) · 16 | 226 | 37 °C · mesophilic | grass silage | end point (model curve) |
| Kaiser (2007) · 17 | 233 | 37 °C · mesophilic | grass silage | end point (model curve) |
| Kaiser (2007) · 18 | 234 | 37 °C · mesophilic | grass silage | end point (model curve) |
| Kaiser (2007) · 19 | 237 | 37 °C · mesophilic | fresh grass | end point (model curve) |
| Kaiser (2007) · 20 | 238 | 37 °C · mesophilic | grass silage | end point (model curve) |
| Kaiser (2007) · 21 | 242 | 37 °C · mesophilic | grass silage | end point (model curve) |
| Kaiser (2007) · 22 | 243 | 37 °C · mesophilic | grass silage | end point (model curve) |
| Kaiser (2007) · 23 | 244 | 37 °C · mesophilic | fresh grass | end point (model curve) |
| Kaiser (2007) · 24 | 245 | 37 °C · mesophilic | fresh grass | end point (model curve) |
| Kaiser (2007) · 25 | 249 | 37 °C · mesophilic | grass silage | end point (model curve) |
| Kaiser (2007) · 26 | 252 | 37 °C · mesophilic | grass silage | end point (model curve) |
| Kaiser (2007) · 27 | 255 | 37 °C · mesophilic | grass silage | end point (model curve) |
| Kaiser (2007) · 28 | 256 | 37 °C · mesophilic | grass silage | end point (model curve) |
| Kaiser (2007) · 29 | 257 | 37 °C · mesophilic | fresh grass | end point (model curve) |
| Kaiser (2007) · 30 | 258 | 37 °C · mesophilic | fresh grass | end point (model curve) |
| Kaiser (2007) · 31 | 259 | 37 °C · mesophilic | grass silage | end point (model curve) |
| Kaiser (2007) · 32 | 261 | 37 °C · mesophilic | fresh grass | end point (model curve) |
| Kaiser (2007) · 33 | 264 | 37 °C · mesophilic | fresh grass | end point (model curve) |
| Kaiser (2007) · 34 | 266 | 37 °C · mesophilic | fresh grass | end point (model curve) |
| Kaiser (2007) · 35 | 267 | 37 °C · mesophilic | fresh grass | end point (model curve) |
| Kaiser (2007) · 36 | 268 | 37 °C · mesophilic | fresh grass | end point (model curve) |
| Kaiser (2007) · 37 | 269 | 37 °C · mesophilic | grass silage | end point (model curve) |
| Kaiser (2007) · 38 | 270 | 37 °C · mesophilic | grass silage | end point (model curve) |
| Kaiser (2007) · 39 | 276 | 37 °C · mesophilic | grass silage | end point (model curve) |
| Kaiser (2007) · 40 | 277 | 37 °C · mesophilic | fresh grass | end point (model curve) |
| Kaiser (2007) · 41 | 278 | 37 °C · mesophilic | fresh grass | end point (model curve) |
| Kaiser (2007) · 42 | 279 | 37 °C · mesophilic | grass silage | end point (model curve) |
| Kaiser (2007) · 43 | 282 | 37 °C · mesophilic | fresh grass | end point (model curve) |
| Kaiser (2007) · 44 | 283 | 37 °C · mesophilic | fresh grass | end point (model curve) |
| Kaiser (2007) · 45 | 286 | 37 °C · mesophilic | fresh grass | end point (model curve) |
| Kaiser (2007) · 46 | 288 | 37 °C · mesophilic | fresh grass | end point (model curve) |
| Kaiser (2007) · 47 | 291 | 37 °C · mesophilic | grass silage | end point (model curve) |
| Kaiser (2007) · 48 | 294 | 37 °C · mesophilic | fresh grass | end point (model curve) |
| Kaiser (2007) · 49 | 294 | 37 °C · mesophilic | grass silage | end point (model curve) |
| Kaiser (2007) · 50 | 297 | 37 °C · mesophilic | grass silage | end point (model curve) |
| Kaiser (2007) · 51 | 298 | 37 °C · mesophilic | fresh grass | end point (model curve) |
| Kaiser (2007) · 52 | 300 | 37 °C · mesophilic | grass silage | end point (model curve) |
| Kaiser (2007) · 53 | 302 | 37 °C · mesophilic | fresh grass | end point (model curve) |
| Kaiser (2007) · 54 | 303 | 37 °C · mesophilic | grass silage | end point (model curve) |
| Kaiser (2007) · 55 | 304 | 37 °C · mesophilic | fresh grass | end point (model curve) |
| Kaiser (2007) · 56 | 308 | 37 °C · mesophilic | grass silage | end point (model curve) |
| Kaiser (2007) · 57 | 310 | 37 °C · mesophilic | grass silage | end point (model curve) |
| Kaiser (2007) · 58 | 312 | 37 °C · mesophilic | grass silage | end point (model curve) |
| Kaiser (2007) · 59 | 313 | 37 °C · mesophilic | fresh grass | end point (model curve) |
| Kaiser (2007) · 60 | 314 | 37 °C · mesophilic | fresh grass | end point (model curve) |
| Kaiser (2007) · 61 | 315 | 37 °C · mesophilic | grass silage | end point (model curve) |
| Kaiser (2007) · 62 | 316 | 37 °C · mesophilic | fresh grass | end point (model curve) |
| Kaiser (2007) · 63 | 317 | 37 °C · mesophilic | grass silage | end point (model curve) |
| Kaiser (2007) · 64 | 318 | 37 °C · mesophilic | grass silage | end point (model curve) |
| Kaiser (2007) · 65 | 318 | 37 °C · mesophilic | fresh grass | end point (model curve) |
| Kaiser (2007) · 66 | 320 | 37 °C · mesophilic | fresh grass | end point (model curve) |
| Kaiser (2007) · 67 | 321 | 37 °C · mesophilic | fresh grass | end point (model curve) |
| Kaiser (2007) · 68 | 326 | 37 °C · mesophilic | grass silage | end point (model curve) |
| Kaiser (2007) · 69 | 327 | 37 °C · mesophilic | grass silage | end point (model curve) |
| Kaiser (2007) · 70 | 329 | 37 °C · mesophilic | grass silage | end point (model curve) |
| Kaiser (2007) · 71 | 331 | 37 °C · mesophilic | grass silage | end point (model curve) |
| Kaiser (2007) · 72 | 332 | 37 °C · mesophilic | fresh grass | end point (model curve) |
| Kaiser (2007) · 73 | 333 | 37 °C · mesophilic | fresh grass | end point (model curve) |
| Kaiser (2007) · 74 | 335 | 37 °C · mesophilic | grass silage | end point (model curve) |
| Kaiser (2007) · 75 | 338 | 37 °C · mesophilic | fresh grass | end point (model curve) |
| Kaiser (2007) · 76 | 340 | 37 °C · mesophilic | grass silage | end point (model curve) |
| Kaiser (2007) · 77 | 342 | 37 °C · mesophilic | grass silage | end point (model curve) |
| Kaiser (2007) · 78 | 342 | 37 °C · mesophilic | grass silage | end point (model curve) |
| Kaiser (2007) · 79 | 346 | 37 °C · mesophilic | grass silage | end point (model curve) |
| Kaiser (2007) · 80 | 350 | 37 °C · mesophilic | fresh grass | end point (model curve) |
| Kaiser (2007) · 81 | 353 | 37 °C · mesophilic | grass silage | end point (model curve) |
| Kaiser (2007) · 82 | 356 | 37 °C · mesophilic | grass silage | end point (model curve) |
| Kaiser (2007) · 83 | 358 | 37 °C · mesophilic | fresh grass | end point (model curve) |
| Kaiser (2007) · 84 | 359 | 37 °C · mesophilic | fresh grass | end point (model curve) |
| Kaiser (2007) · 85 | 362 | 37 °C · mesophilic | grass silage | end point (model curve) |
| Kaiser (2007) · 86 | 363 | 37 °C · mesophilic | fresh grass | end point (model curve) |
| Kaiser (2007) · 87 | 366 | 37 °C · mesophilic | fresh grass | end point (model curve) |
| Kaiser (2007) · 88 | 367 | 37 °C · mesophilic | grass silage | end point (model curve) |
| Kaiser (2007) · 89 | 370 | 37 °C · mesophilic | fresh grass | end point (model curve) |
| Kaiser (2007) · 90 | 371 | 37 °C · mesophilic | grass silage | end point (model curve) |
| Kaiser (2007) · 91 | 372 | 37 °C · mesophilic | grass silage | end point (model curve) |
| Kaiser (2007) · 92 | 374 | 37 °C · mesophilic | fresh grass | end point (model curve) |
| Kaiser (2007) · 93 | 376 | 37 °C · mesophilic | fresh grass | end point (model curve) |
| Kaiser (2007) · 94 | 380 | 37 °C · mesophilic | grass silage | end point (model curve) |
| Kaiser (2007) · 95 | 382 | 37 °C · mesophilic | grass silage | end point (model curve) |
| Kaiser (2007) · 96 | 390 | 37 °C · mesophilic | grass silage | end point (model curve) |
| Kaiser (2007) · 97 | 393 | 37 °C · mesophilic | fresh grass | end point (model curve) |
| Kaiser (2007) · 98 | 398 | 37 °C · mesophilic | grass silage | end point (model curve) |
| Kaiser (2007) · 99 | 417 | 37 °C · mesophilic | fresh grass | end point (model curve) |
| Kaiser (2007) · 100 | 424 | 37 °C · mesophilic | grass silage | end point (model curve) |
| Kaiser (2007) · 101 | 443 | 37 °C · mesophilic | grass silage | end point (model curve) |
| Lallement et al. (2023) · 1 DOI | 187 | 38 °C · mesophilic | Grass | end point (model curve) |
| Lallement et al. (2023) · 2 DOI | 264 | 38 °C · mesophilic | Grass | end point (model curve) |
| Lallement et al. (2023) · 3 DOI | 393 | 38 °C · mesophilic | Grass | end point (model curve) |
| Lallement et al. (2023) · 4 DOI | 403 | 38 °C · mesophilic | Grass | end point (model curve) |
| Lallement et al. (2023) · 5 DOI | 406 | 38 °C · mesophilic | Grass | end point (model curve) |
| Lallement et al. (2023) · 6 DOI | 461 | 38 °C · mesophilic | Grass | end point (model curve) |
| Luna-delRisco et al. (2011) · 1 | 300 | 36 °C · mesophilic | grass silage · pretreatment: particle size reduction/sample preparation (MY-D: physical treatment) | end point (model curve) |
| Luna-delRisco et al. (2011) · 2 | 319 | 36 °C · mesophilic | grass silage · pretreatment: particle size reduction/sample preparation (MY-D: physical treatment) | end point (model curve) |
| Luna-delRisco et al. (2011) · 3 | 338 | 36 °C · mesophilic | grass silage · pretreatment: particle size reduction/sample preparation (MY-D: physical treatment) | end point (model curve) |
| Ravindran et al. (2022) DOI | 479 | — | Grass Silage | end point (model curve) |
| Weighted mean | 345 | arithmetic mean 314, SD 63 | ||
Typical composition
- Dry matter (DM)
- 21.6% (range 10.7–94)
- Volatile solids (VS)
- 90.7 % DM (range 78–95.2)
- Nitrogen
- 1.4 % DM
- C/N ratio
- 32.1
Median and range of the determinations reported in the publications behind this substrate's BMP records (read from: MY-D); dry matter: 130 determinations, volatile solids: 125 determinations. C/N was calculated as the ratio of C and N content (% DM) from the same source. The DM range includes fresh samples as well as samples partly dried or dried before the test – for fresh material the lower part of the range applies, ideally your own measurement.
Sources: Cu et al. (2014); Dandikas et al. (2015); Kaiser (2007); Lallement et al. (2023); Luna-delRisco et al. (2011).
The composition of the raw material varies between batches — for plant calculations use an analysis of your own sample. The calculator inserts typical values automatically.
Process properties
Advantages
- Methane potential in the database: weighted mean 345 m³ CH₄/t VS (median 320; range 164–479; 145 records from 7 sources).
- Dandikas 2015 links yield to the chemical composition of meadow species — the result can be predicted from compositional analysis.
Drawbacks and risks
- Yield depends on species, mowing date and composition (Dandikas 2015, Kaiser 2007), so the spread is large.
- Ensiling and additives affect yield (Herrmann 2011).
Co-digestion — what to combine it with, what to watch out for
- combines well
group: Animal excreta (slurry, manure, poultry litter)
Co-digestion with excreta (slurry/solid manure) is the standard arrangement for plant biomass: they supply alkalinity and microflora.[1][2]
- combines well
Combining grass forage with maize (silage) evens out structure and available carbon; the yield of the mixes depends on composition (Herrmann 2016).[3]
Dosing
No source-based dose limits; Lehtomäki 2007 studies the effect of the grass/crop to manure ratio.
Practical requirements
- Shred: shredding increases the surface available for degradation and speeds it up, but does not necessarily raise the final gas yield (FNR 2010, Ch. 3 “Triturado”).
- Ensiling makes it possible to store seasonal biomass; properly ensiled plants (in the study maize, sorghum, forage rye, triticale) can be stored for up to a year without loss of methane production (Herrmann et al. 2011).
Sources of the process data
- Dandikas, V.; Heuwinkel, H.; Lichti, F.; Drewes, J.E.; Koch, K. (2015) Correlation between Biogas Yield and Chemical Composition of Grassland Plant Species. Energy & Fuels 29(11), 7221–7229
- Weiland, P. (2010) Biogas production: current state and perspectives. Applied Microbiology and Biotechnology
- Herrmann, C. et al. (2016) Biogas crops grown in energy crop rotations: Linking chemical composition and methane production characteristics. Bioresource Technology
- Buffiere, P.; Loisel, D.; Bernet, N.; Delgenes, J.P. (2006) Towards new indicators for the prediction of solid waste anaerobic digestion properties. Water Science and Technology 53(8), 233–241
- Cu, T.T.T.; Nguyen, T.X.; Triolo, J.M.; Pedersen, L.; Le, V.D.; Le, P.D.; Sommer, S.G. (2014) Biogas Production from Vietnamese Animal Manure, Plant Residues and Organic Waste: Influence of Biomass Composition on Methane Yield. Asian-Australasian Journal of Animal Sciences 28(2), 280–289
- Herrmann, C. et al. (2011) Effects of ensiling, silage additives and storage period on methane formation of biogas crops. Bioresource Technology
- Kaiser, F.L. (2007) Einfluss der stofflichen Zusammensetzung auf die Verdaulichkeit nachwachsender Rohstoffe beim anaeroben Abbau in Biogasreaktoren. Dissertation, Technische Universität München, Wissenschaftszentrum Weihenstephan
- Lallement, A.; Peyrelasse, C.; Lagnet, C.; Barakat, A.; Schraauwers, B.; Maunas, S.; Monlau, F. (2023) A Detailed Database of the Chemical Properties and Methane Potential of Biomasses Covering a Large Range of Common Agricultural Biogas Plant Feedstocks. Waste 1(1), 195–227
- Luna-delRisco, M.; Normak, A.; Orupõld, K. (2011) Biochemical methane potential of different organic wastes and energy crops from Estonia. Agronomy Research 9(1–2), 331–342
- Ravindran, R.; Donkor, K.; Gottumukkala, L.; Menon, A.; Guneratnam, A.J.; McMahon, H.; Koopmans, S.; Sanders, J.P.M.; Gaffey, J. (2022) Biogas, Biomethane and Digestate Potential of By-Products from Green Biorefinery Systems. Clean Technologies 4(1), 35–50
- FNR (2010). Guía sobre el Biogás – Desde la producción hasta el uso (hiszp. wydanie „Leitfaden Biogas”, GIZ 2013)
The co-digestion calculator will assess a specific mixture containing this substrate.
What it is and where it comes from
Grassland grasses are the biomass of permanent meadows and pastures, mown several times a season. Green forage is sometimes ensiled as silage or haylage (wilted), and in other variants dried as hay. In Poland grassland occupies a significant part of the agricultural area, and some of it is used extensively, so surplus grass is sometimes considered for biogas plants. The compilation combines several studies (over a hundred records) and covers fresh grasses and silages, as well as studies of species and cutting dates.
Properties relevant to digestion
Grasses have a moderate protein content and a significant amount of fibre. Digestibility is highest for young green forage, and falls as heading and maturation proceed, with rising lignin content. Ensiling grasses is usually easier than ensiling legumes owing to the higher sugar content. Silage keeps well if it is tightly covered and adequately compacted. The drawbacks are contamination with soil and molehills, and, in the digester, a tendency to form a floating crust with a large share of long fibre. Shredding improves the operation of feeding and mixing systems.
How to read the spread of results
This is the most numerously represented substrate in the compilation, with records from different countries and temperatures: from mesophilic to a single thermophilic result. The spread results from the botanical composition of the sward, the cut number, the growth stage, fertilisation, the method of preservation (green forage, silage, hay) and particle size. In addition there are differences in inoculum, substrate-to-inoculum ratio, test length and gas measurement method. Some studies examine many grass species separately, which widens the range of results without indicating measurement uncertainty.
In biogas plant practice
Grass silage is sometimes an important element of the mix on farms with a large share of grassland, especially as a supplement to or replacement for part of the maize silage. The first cut is often more valuable for animals, and later or lower-quality cuts may go to the biogas plant. What matters is harvesting at the right stage, rapid ensiling, control of soil contamination and regular deliveries. The costs of harvesting and possible restrictions related to the use of protected areas must also be borne in mind. It is worth linking one's own BMP test to the cutting date.
Methodology in brief
BMP is the amount of methane obtained from volatile solids (VS) in a batch test, given in m³ CH₄ per tonne of VS (numerically the same as NmL CH₄/g VS in the publications) and converted to normal conditions (0 °C, 101.325 kPa). The weighted mean gives each publication a total weight of 1, split equally between its results for the substrate — a paper testing twenty varieties does not outweigh a paper with a single sample. In inter-laboratory programmes the unit is the laboratory (total weight 1), and within it the weight of a test grows with the number of bottles (replicates). Results after pretreatment (e.g. thermal, chemical, enzymatic) are shown separately and are not included in the mean.
Solid lines are curves measured in the tests. Where a publication gives only the final result, we draw a first-order kinetic model, B(t) = B₀·(1 − e−kt): only the end point comes from the publication, and the shape of the curve serves purely as visualisation — do not read the production on a particular day from it. For this substrate k = 0.091 d−1 was assumed (no kinetic data for the group – the median of all available rate constants k (93 values) was used).
The statistics describe the spread of published results — a descriptive compilation, not a meta-analysis or a guarantee of plant yield.
Bibliography
- Buffiere, P.; Loisel, D.; Bernet, N.; Delgenes, J.P. (2006). Towards new indicators for the prediction of solid waste anaerobic digestion properties. Water Science and Technology 53(8), 233–241. DOI: 10.2166/wst.2006.254 DOI
- Cu, T.T.T.; Nguyen, T.X.; Triolo, J.M.; Pedersen, L.; Le, V.D.; Le, P.D.; Sommer, S.G. (2014). Biogas Production from Vietnamese Animal Manure, Plant Residues and Organic Waste: Influence of Biomass Composition on Methane Yield. Asian-Australasian Journal of Animal Sciences 28(2), 280–289. DOI: 10.5713/ajas.14.0312 DOI
- Dandikas, V.; Heuwinkel, H.; Lichti, F.; Drewes, J.E.; Koch, K. (2015). Correlation between Biogas Yield and Chemical Composition of Grassland Plant Species. Energy & Fuels 29(11), 7221–7229. DOI: 10.1021/acs.energyfuels.5b01257 DOI
- Kaiser, F.L. (2007). Einfluss der stofflichen Zusammensetzung auf die Verdaulichkeit nachwachsender Rohstoffe beim anaeroben Abbau in Biogasreaktoren. Dissertation, Technische Universität München, Wissenschaftszentrum Weihenstephan. https://mediatum.ub.tum.de/631394 source
- Lallement, A.; Peyrelasse, C.; Lagnet, C.; Barakat, A.; Schraauwers, B.; Maunas, S.; Monlau, F. (2023). A Detailed Database of the Chemical Properties and Methane Potential of Biomasses Covering a Large Range of Common Agricultural Biogas Plant Feedstocks. Waste 1(1), 195–227. DOI: 10.3390/waste1010014 DOI
- Luna-delRisco, M.; Normak, A.; Orupõld, K. (2011). Biochemical methane potential of different organic wastes and energy crops from Estonia. Agronomy Research 9(1–2), 331–342. https://www.semanticscholar.org/paper/25cf2d7bba4758136830a9a02caf3ecd997173bb source
- Ravindran, R.; Donkor, K.; Gottumukkala, L.; Menon, A.; Guneratnam, A.J.; McMahon, H.; Koopmans, S.; Sanders, J.P.M.; Gaffey, J. (2022). Biogas, Biomethane and Digestate Potential of By-Products from Green Biorefinery Systems. Clean Technologies 4(1), 35–50. DOI: 10.3390/cleantechnol4010003 DOI
All sources of the site: bibliography.
Other substrates in the group “Grasses, green forage and fodder plants”
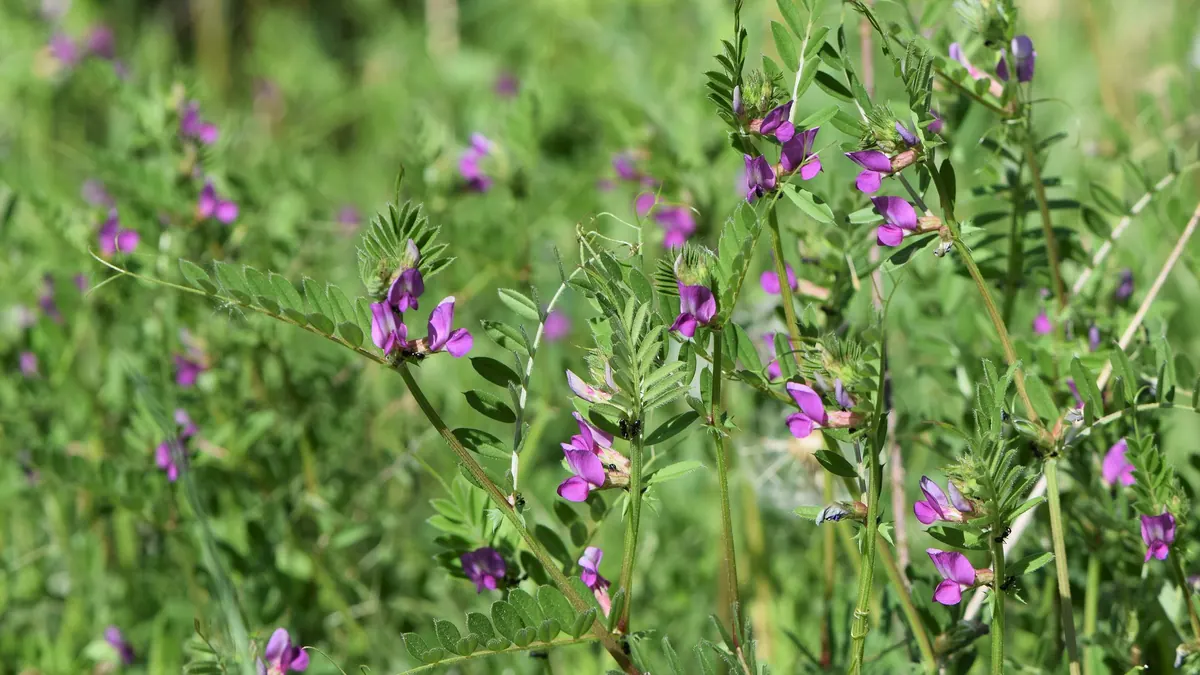
Vetch-oat mixture — BMP: 2 studies, weighted mean 405 m³ CH₄/t VS
405 m³ CH₄/t VS weighted mean from 2 studies
≈52 %
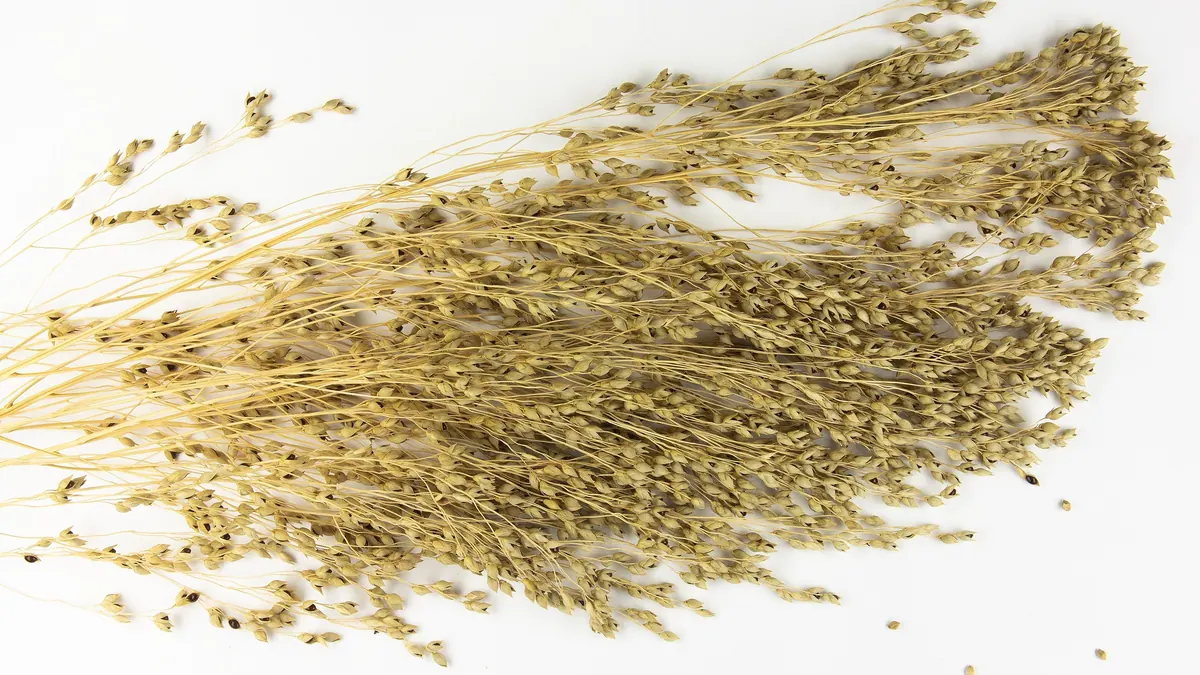
Proso millet, whole crop — BMP: 2 studies, weighted mean 260 m³ CH₄/t VS
260 m³ CH₄/t VS weighted mean from 2 studies
good — editorial rating for biogas plants≈52 %
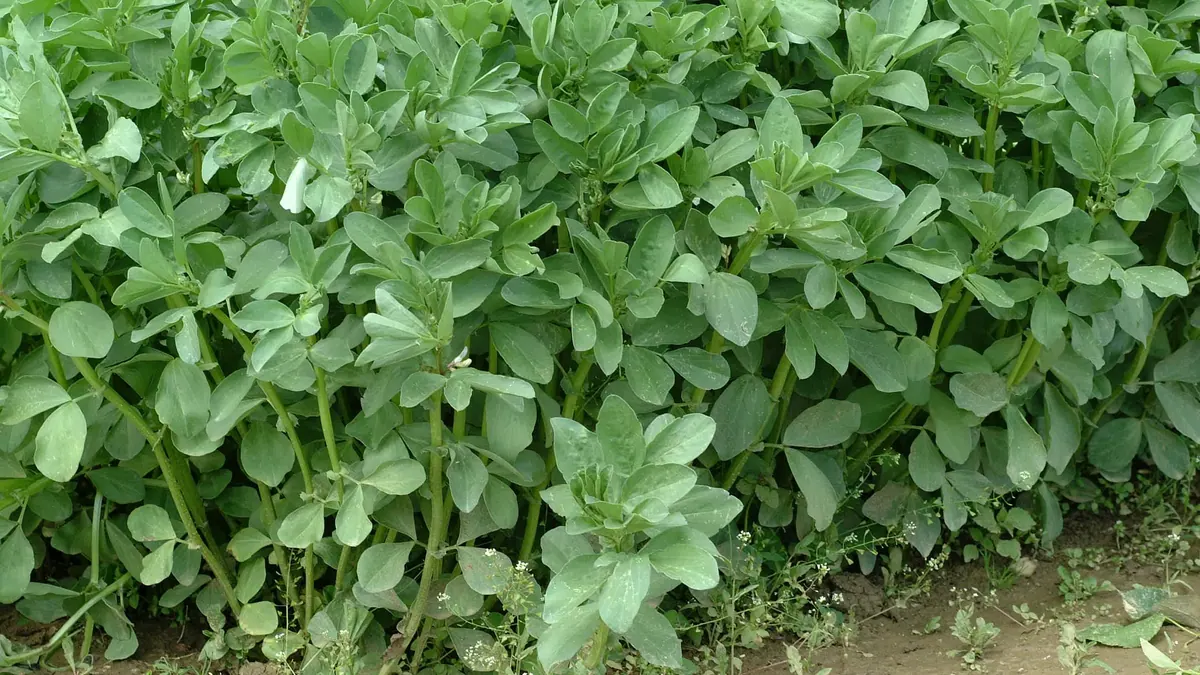
Faba bean, whole crop — BMP: 2 studies, weighted mean 296 m³ CH₄/t VS
296 m³ CH₄/t VS weighted mean from 2 studies
≈52 %
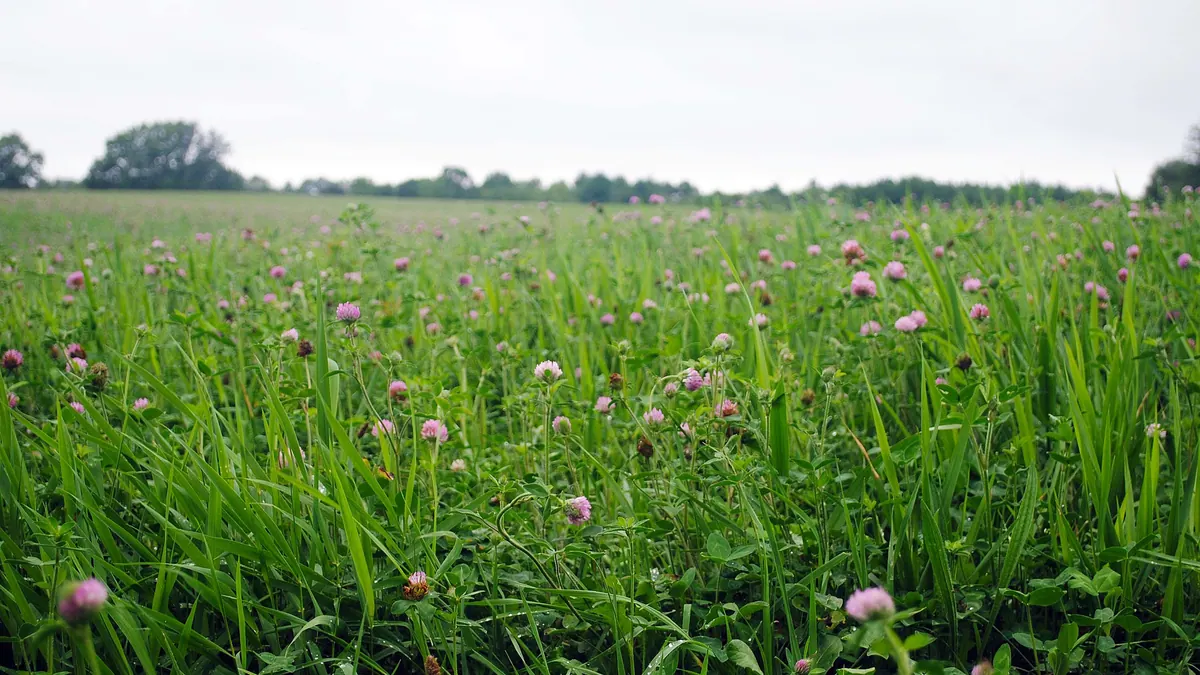
Clover — BMP: 5 studies, weighted mean 394 m³ CH₄/t VS
394 m³ CH₄/t VS weighted mean from 5 studies
neutral — editorial rating for biogas plants59 %