

BMP testingGrasses, green forage and fodder plants
Clover — BMP: 5 studies, weighted mean 394 m³ CH₄/t VS
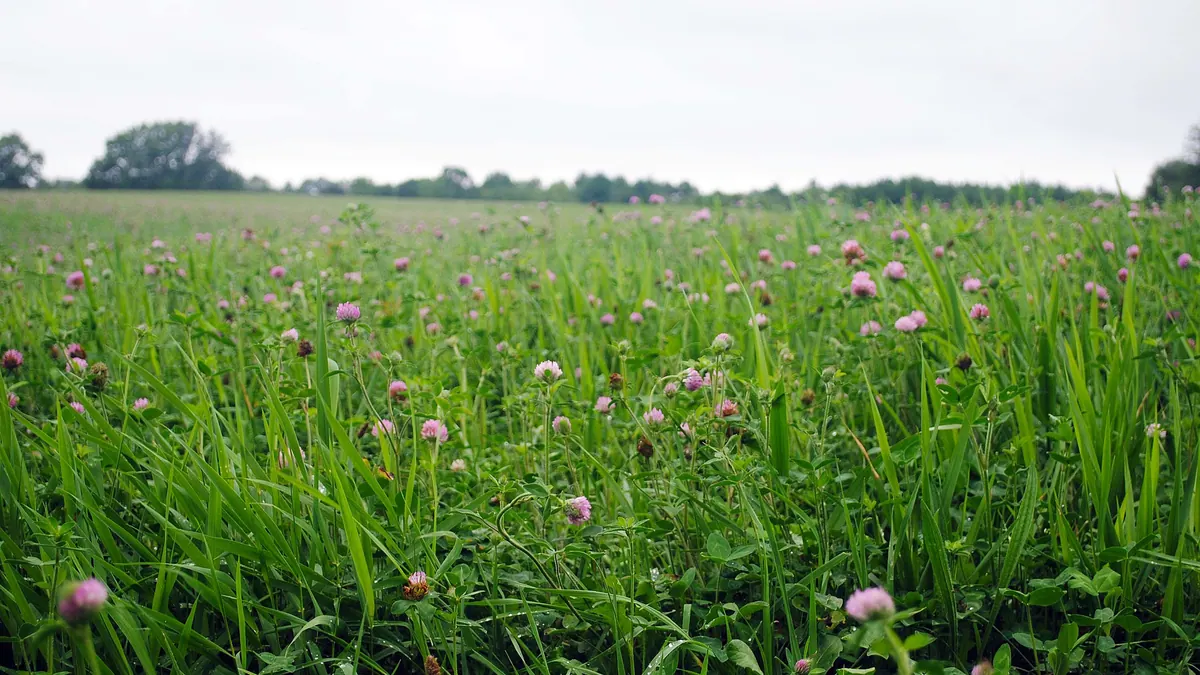
Clover is a leguminous plant of high protein content, grown for feed and as a preceding crop. As a biogas substrate it gives readily digestible biomass, but carries a risk of ammonia.
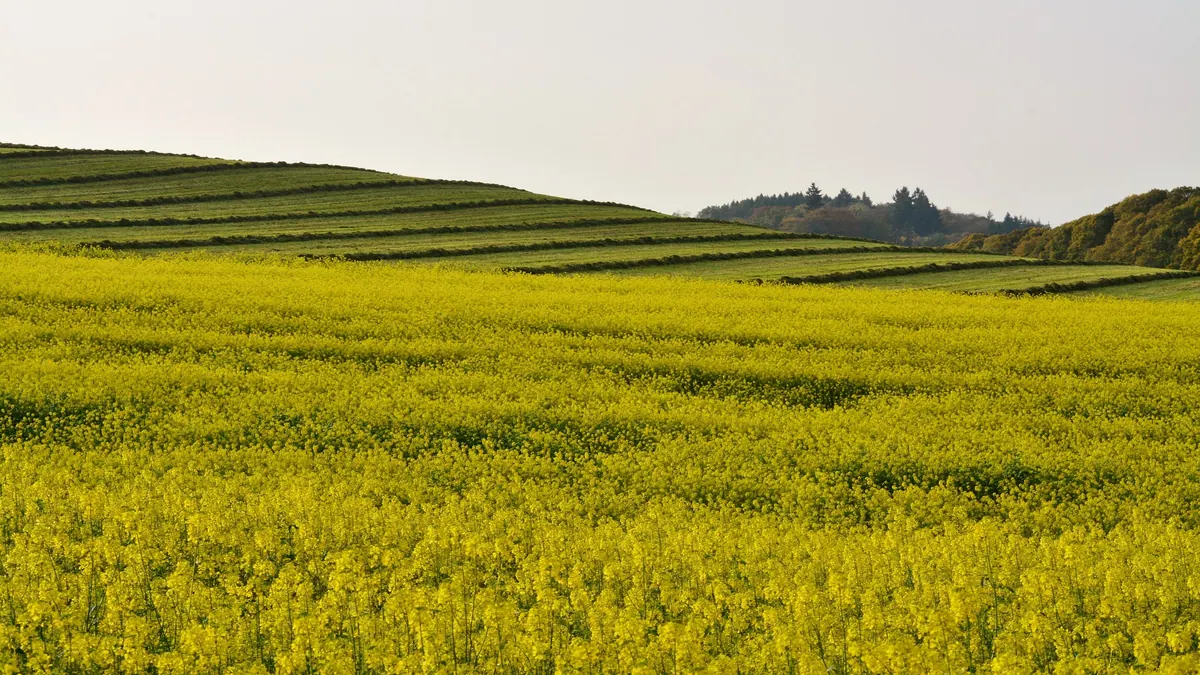
Photo U. S. Fish and Wildlife Service - Northeast Region / Wikimedia Commons, public domain, source file; changes: cropping

- Weighted mean
- 394m³ CH₄/t VS
- Range
- 280–558m³ CH₄/t VS
- Records
- 5studies
- Publications
- 2sources
- Temperatures
- 35 °C, 40 °Cof the test
Methane in biogas
Medium methane content · ≈ 5.9 kWh/m³ of biogas
measured mean of 3 studies BMP, range 57.7–62 %; in a batch test the CH₄ share tends to be higher than in a plant.
Rating for biogas plants
neutral — editorial rating for biogas plantsNo clear advantages — worth charging a fee for accepting it
Potential per tonne of fresh matter: high (70 m³ CH₄/t); process risk: protein / nitrogen. Handling costs: fibres, floating layer.
Why? Rating factors
Potential per tonne +2
- +2potential 70 m³ CH₄/t fresh matter (BMP 394 × DM 19.4 % × VS 91.5 %)
Process stability −1
- −1protein / nitrogen: risk of ammonia inhibition at higher shares
Handling and costs −0.5
- −0.5fibres, floating layer — shredding and intensive mixing
Total points: 0.5 · thresholds: ≥ 2.5 very good, ≥ 1 good, below — neutral; negative with cumulative process risk.
Add to the co-digestion calculator CSV data
BMP curves from 5 studies
Weighted mean Individual records
Dashed lines are a model curve (first-order kinetics, B(t) = B₀·(1 − e−kt)); the end point comes from the publication. All curves are model curves.
Cumulative methane production over the test [m³ CH₄/t VS]. The thick line is the weighted mean of all records (394); dots mark the end values given in the publications. Point at the chart to read values; click a legend item to hide or show a record.
Records and sources
Download CSV| Source | BMP m³ CH₄/t VS | CH₄ in biogas % vol., measured | Temperature | Sample | Curve |
|---|---|---|---|---|---|
| Lehtomaki (2006) · 1 | 280 | — | 35 °C · mesophilic | Red clover | end point (model curve) |
| Lehtomaki (2006) · 2 | 300 | — | 35 °C · mesophilic | Red clover | end point (model curve) |
| Pouech (b.r.) · 1 | 384 | 62.0 % | 40 °C · mesophilic | Clover | end point (model curve) |
| Pouech (b.r.) · 2 | 549 | 58.3 % | 40 °C · mesophilic | Clover | end point (model curve) |
| Pouech (b.r.) · 3 | 558 | 57.7 % | 40 °C · mesophilic | Clover | end point (model curve) |
| Weighted mean | 394 | 59.3 % | arithmetic mean 414, SD 133 | ||
Typical composition
- Dry matter (DM)
- 19.4% (range 15.3–26.2)
- Volatile solids (VS)
- 91.5 % DM (range 91.5–91.5)
- Nitrogen
- 3.5 % DM
- C/N ratio
- 12
Median and range of the determinations reported in the publications behind this substrate's BMP records (read from: CROPGEN D4); dry matter: 3 determinations, volatile solids: 1 determination.
Sources: Lehtomaki (2006); Pouech, P. Fruteau, H. Bewa, H.. Agricultural crops for….
The composition of the raw material varies between batches — for plant calculations use an analysis of your own sample. The calculator inserts typical values automatically.
Process properties
Advantages
- Methane potential in the database: weighted mean 394 m³ CH₄/t VS (median 384; range 280-558; 5 records from 2 sources).
Drawbacks and risks
- Large spread between records resulting from the cutting date and fraction: a BMP test is essential.
- In a BMP test with lucerne and red clover (mono- and co-digestion with grass), at a high load (40 g VS/l) VFA and ammonia accumulated in the digestate, and the VS removal in mono-digestion of legumes was lower than 60% (Li et al. 2023).
Co-digestion — what to combine it with, what to watch out for
- combines well
group: Animal excreta (slurry, manure, poultry litter)
The effect of the energy crop to manure ratio on the yield in semi-continuous digestion was studied by Lehtomäki 2007.[1]
- combines well
substrates: carbon-rich — e.g. Wheat straw, Maize silage (whole crop), Cereal straw (unspecified), Willow (short rotation), Cardboard and paperboard
Co-digestion of grass with lucerne and clover gave a higher methane yield (338 m³/t VS, 9.1% more than mono-digestion) and a significantly higher VS removal than the legumes alone (Li et al. 2023).[2]
Dosing
No source dose limits; in studies on co-digestion of energy crops with cattle manure (Lehtomäki 2007), the effect of the crop:manure ratio was examined.
Practical requirements
- Ensiling (Herrmann 2011: storage period and additives change the yield)
Sources of the process data
- Lehtomaki, A.; Huttunen, S.; Rintala, J.A. (2007) Laboratory investigations on co-digestion of energy crops and crop residues with cow manure for methane production: effect of crop to manure ratio. Resources, Conservation and Recycling
- Li et al. (2023). Anaerobic co-digestion of grass, alfalfa, and red clover for methane production and the kinetic analysis. BioResources 18(1)
- Lehtomaki, A. Viinikainen, T.A. Rintala, J.A (2006) Screening boreal energy crops and crop residues for methane biofuel production. Submitted to Biomass and Bioenergy
- Pouech, P. Fruteau, H. Bewa, H. (None) Agricultural crops for biogas production on anaerobic digestion plants. Biomass for energy and industry 163-165
- Hendriks, A.T.W.M.; Zeeman, G. (2009) Pretreatments to enhance the digestibility of lignocellulosic biomass. Bioresource Technology
- Herrmann, C. et al. (2011) Effects of ensiling, silage additives and storage period on methane formation of biogas crops. Bioresource Technology
The co-digestion calculator will assess a specific mixture containing this substrate.
What it is and where it comes from
Clover (genus Trifolium), above all red clover (meadow clover), is grown in Poland for feed, as a component of mixtures with grasses and as a preceding crop enriching the soil in nitrogen. The compilation contains records for red clover and for clover with no precise species identification, at different development stages: vegetative, budding and flowering. They come from several studies, under mesophilic conditions.
Properties relevant to digestion
Clover has a higher protein content than grasses and a lower ratio of C to N, and at the same time contains enough fibre. For this reason it is a good supplement to rations dominated by nitrogen-poor substrates, such as straw. Digestibility declines as the plant matures: at flowering the share of woody tissues is greater than at the vegetative stage. Ensiling clover is more difficult than ensiling grasses because of the high buffering capacity and lower sugar content, so wilting or the use of additives is often recommended. With a large protein share, the ammonia concentration must be controlled.
How to read the spread of results
The records compiled cover different development stages (vegetative, budding and flowering), which in itself explains part of the spread. In addition, varieties, the cutting date, the form of the material (fresh, ensiled, dried), the method of size reduction and the growing conditions differ. One of the studies has no publication year given in the source database, which is noted in the description. The tests were carried out at different substrate-to-inoculum ratios, so the results are not directly comparable.
In biogas plant practice
Clover is usually an auxiliary substrate, used on farms that have it in their crop rotation. It is best harvested at the stage before full flowering and ensiled in the standard way. It gives a good effect in a mixture with straw or maize silage, because it contributes nitrogen and makes it easier to maintain the C/N balance. Limitations are the variability of yield between years and competition from feed use. The dose is chosen on the basis of analysis and a BMP test. It is worth noting that clover is used in crop rotation mainly for agronomic benefits, so its value to the farm is not confined to biogas. In the profitability balance, savings on nitrogen fertilisation should also be included.
Methodology in brief
BMP is the amount of methane obtained from volatile solids (VS) in a batch test, given in m³ CH₄ per tonne of VS (numerically the same as NmL CH₄/g VS in the publications) and converted to normal conditions (0 °C, 101.325 kPa). The weighted mean gives each publication a total weight of 1, split equally between its results for the substrate — a paper testing twenty varieties does not outweigh a paper with a single sample. In inter-laboratory programmes the unit is the laboratory (total weight 1), and within it the weight of a test grows with the number of bottles (replicates). Results after pretreatment (e.g. thermal, chemical, enzymatic) are shown separately and are not included in the mean.
Solid lines are curves measured in the tests. Where a publication gives only the final result, we draw a first-order kinetic model, B(t) = B₀·(1 − e−kt): only the end point comes from the publication, and the shape of the curve serves purely as visualisation — do not read the production on a particular day from it. For this substrate k = 0.091 d−1 was assumed (no kinetic data for the group – the median of all available rate constants k (93 values) was used).
The statistics describe the spread of published results — a descriptive compilation, not a meta-analysis or a guarantee of plant yield.
Bibliography
- Lehtomaki, A. Viinikainen, T.A. Rintala, J.A (2006). Screening boreal energy crops and crop residues for methane biofuel production. Submitted to Biomass and Bioenergy.
- Pouech, P. Fruteau, H. Bewa, H.. Agricultural crops for biogas production on anaerobic digestion plants. Biomass for energy and industry 163-165.
All sources of the site: bibliography.
Other substrates in the group “Grasses, green forage and fodder plants”
Lucerne (alfalfa) — BMP: 7 studies, weighted mean 366 m³ CH₄/t VS
366 m³ CH₄/t VS weighted mean from 7 studies
neutral — editorial rating for biogas plants66 %
Ryegrass — BMP: 4 studies, weighted mean 520 m³ CH₄/t VS
520 m³ CH₄/t VS weighted mean from 4 studies
good — editorial rating for biogas plants61 %
Marrow kale — BMP: 2 studies, weighted mean 315 m³ CH₄/t VS
315 m³ CH₄/t VS weighted mean from 2 studies
≈52 %
White mustard (tops) — BMP: 2 studies, weighted mean 313 m³ CH₄/t VS
313 m³ CH₄/t VS weighted mean from 2 studies
good — editorial rating for biogas plants68 %