

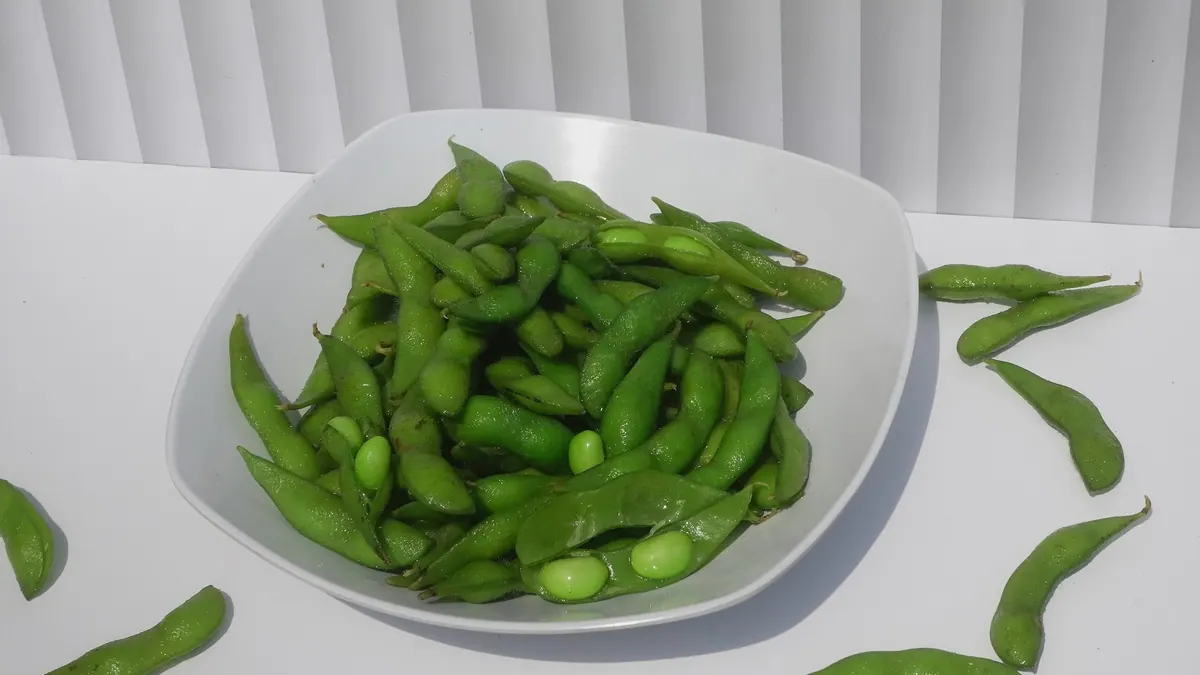
BMP testingFruit, vegetables and their residuessingle study (4 samples)
Whole legume vegetables (green soybean, mung bean, adzuki bean, lablab) — BMP: 4 studies, mean 261 m³ CH₄/t VS
Whole legume vegetables (edamame, mung bean, adzuki, lablab) are four materials from one study; the results reflect differences in protein, starch and fibre.
Photo Herreads / Wikimedia Commons, licence CC BY 4.0, source file; changes: cropping

- Weighted mean
- 261m³ CH₄/t VS
- Range
- 205–297m³ CH₄/t VS
- Records
- 4single study (4 samples)
- Publications
- 1source
- Temperatures
- —of the test
Methane in biogas
Medium methane content · ≈ 5.5 kWh/m³ of biogas
estimate from the substrate type The collected studies contain no measurement. The interval follows from the approximate composition (protein from total nitrogen (N 3.6 % DM × 6.25)) and the yields of compound groups according to FNR.
Rating for biogas plants
not rated — editorial rating for biogas plants
Not rated: no dry matter or volatile solids in the data. We calculate the rating when the dry matter and volatile solids of the material are known.
Add to the co-digestion calculator CSV data
BMP curves from 4 studies
Weighted mean Individual records
Dashed lines are a model curve (first-order kinetics, B(t) = B₀·(1 − e−kt)); the end point comes from the publication. All curves are model curves.
Cumulative methane production over the test [m³ CH₄/t VS]. The thick line is the weighted mean of all records (261); dots mark the end values given in the publications. Point at the chart to read values; click a legend item to hide or show a record.
Records and sources
Download CSV| Source | BMP m³ CH₄/t VS | Temperature | Sample | Curve |
|---|---|---|---|---|
| Yan et al. (2021) · 1 DOI | 205 | — | Mung bean (Vigna radiata) – Whole | end point (model curve) |
| Yan et al. (2021) · 2 DOI | 264 | — | Red bean (Vigna angularis) – Whole | end point (model curve) |
| Yan et al. (2021) · 3 DOI | 279 | — | Lentil (Lablab purpureus) – Whole | end point (model curve) |
| Yan et al. (2021) · 4 DOI | 297 | — | Green soybean (Glycine max) – Whole | end point (model curve) |
| Weighted mean | 261 | arithmetic mean 261, SD 40 | ||
Typical composition
- Volatile solids (VS)
- 95.1 % DM (range 93.3–96.2)
- Nitrogen
- 3.6 % DM
- C/N ratio
- 12.4
Median and range of the determinations reported in the publications behind this substrate's BMP records (read from: BCBPD); dry matter: 0 determinations, volatile solids: 4 determinations. C/N was calculated as the ratio of C and N content (% DM) from the same source. No DM in the sources – the calculator has to ask for a value.
Sources: Yan et al. (2021).
The composition of the raw material varies between batches — for plant calculations use an analysis of your own sample. The calculator inserts typical values automatically.
Process properties
Low confidence: the description is based on general characteristics of the substrate group, not on studies of this material. Treat it as a hint to be verified.
No published process studies
The literature we use does not describe the advantages or drawbacks of digesting this substrate beyond the BMP test results. Below are process characteristics assigned on the basis of the type of material — an editorial classification, not a study result.
- seasonal
- seasonal availability — requires storage
- poor in trace elements
- poor in trace elements — mono-digestion requires supplementation
- variable composition
- high variability of composition between batches
- protein-rich
- a lot of protein → ammonia (NH₃/NH₄⁺), rising pH, H₂S
- nitrogen-rich
- low C/N → risk of ammonia inhibition
Co-digestion — what to combine it with, what to watch out for
- combines well
substrates: nitrogen-rich — e.g. Pig slurry, Poultry manure, Waste activated sludge (secondary sludge), Chlorella vulgaris, Nannochloropsis salina
A nitrogen-rich co-substrate balances the low C/N of fruit and vegetable waste (Bouallagui et al. 2009).[1]
Dosing
No source limits on the dose for this substrate.
Sources of the process data
- Improvement of fruit and vegetable waste anaerobic digestion performance and stability with co-substrates addition
- Compositional components and methane production potential of typical vegetable wastes
- Effects of size and thermophilic pre-hydrolysis of banana peel during anaerobic digestion, and biomethanation potential of key tropical fruit wastes
- Effect of particle size on biogas generation from biomass residues
The co-digestion calculator will assess a specific mixture containing this substrate.
What it is and where it comes from
The set covers whole legume plants used as vegetables: green soybean (edamame), mung bean (Vigna radiata), adzuki bean (Vigna angularis) and lablab (Lablab purpureus). All records come from a single study, which examined whole plants or pods with seeds, not dry commercial seeds. Waste of this type arises on farms growing legumes and in processing. In Poland edamame and mung bean are niche crops.
Properties relevant to digestion
Leguminous plants contain a lot of protein, so their digestion yields ammonia, which in excess inhibits methanogens; in mixtures with carbon-rich material, however, this is an advantage, as it improves the C/N balance. They also contain starch and fibre, and in older tissues lignin in the stems. Some species contain anti-nutritional compounds, such as protease inhibitors and tannins, but their effect on methane fermentation is usually small. Green pods degrade faster than dry stems.
How to read the spread of results
The records from a single study differ in species, and thus in the proportions of seeds, pods and stems in the whole plant. There are no data from other laboratories, and the temperature is not given in the compilation. The result is affected by variety, maturity stage at harvest, degree of shredding, the method of drying the sample and the inoculum used. Because the records in this section relate to whole plants, they cannot be directly compared with results for seeds alone.
In biogas plant practice
Legume vegetables are not a typical substrate in Polish biogas plants, and leguminous plants are more often grown for fodder, for ploughing in or as a catch crop. In a mix with nitrogen-poor substrates (straws, grasses) they can improve the C/N ratio. Monitoring the ammonia concentration and shredding the stems are recommended. For a steady stream, a BMP test on one's own material is necessary.
Methodology in brief
BMP is the amount of methane obtained from volatile solids (VS) in a batch test, given in m³ CH₄ per tonne of VS (numerically the same as NmL CH₄/g VS in the publications) and converted to normal conditions (0 °C, 101.325 kPa). The weighted mean gives each publication a total weight of 1, split equally between its results for the substrate — a paper testing twenty varieties does not outweigh a paper with a single sample. In inter-laboratory programmes the unit is the laboratory (total weight 1), and within it the weight of a test grows with the number of bottles (replicates). Results after pretreatment (e.g. thermal, chemical, enzymatic) are shown separately and are not included in the mean.
Solid lines are curves measured in the tests. Where a publication gives only the final result, we draw a first-order kinetic model, B(t) = B₀·(1 − e−kt): only the end point comes from the publication, and the shape of the curve serves purely as visualisation — do not read the production on a particular day from it. For this substrate k = 0.245 d−1 was assumed (median of rate constants k reported in the sources and/or fitted to the mean measured curves).
The statistics describe the spread of published results — a descriptive compilation, not a meta-analysis or a guarantee of plant yield.
Bibliography
- Yan, H.; Cai, F.; Wang, L.; Chen, C.; Liu, G. (2021). Compositional components and methane production potential of typical vegetable wastes. Environmental Science and Pollution Research 28(38), 54177–54186. DOI: 10.1007/s11356-021-15798-y DOI
All sources of the site: bibliography.
Other substrates in the group “Fruit, vegetables and their residues”
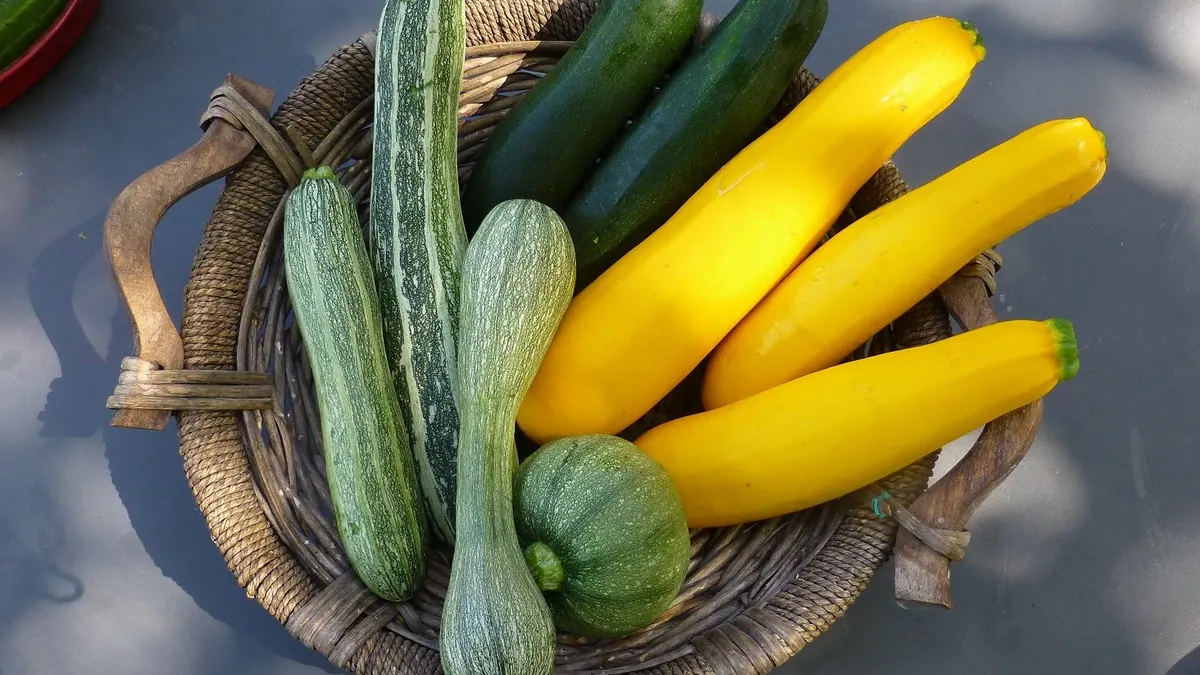
Zucchini and vegetable marrow — BMP: 4 studies, weighted mean 309 m³ CH₄/t VS
309 m³ CH₄/t VS weighted mean from 4 studies
≈52 %
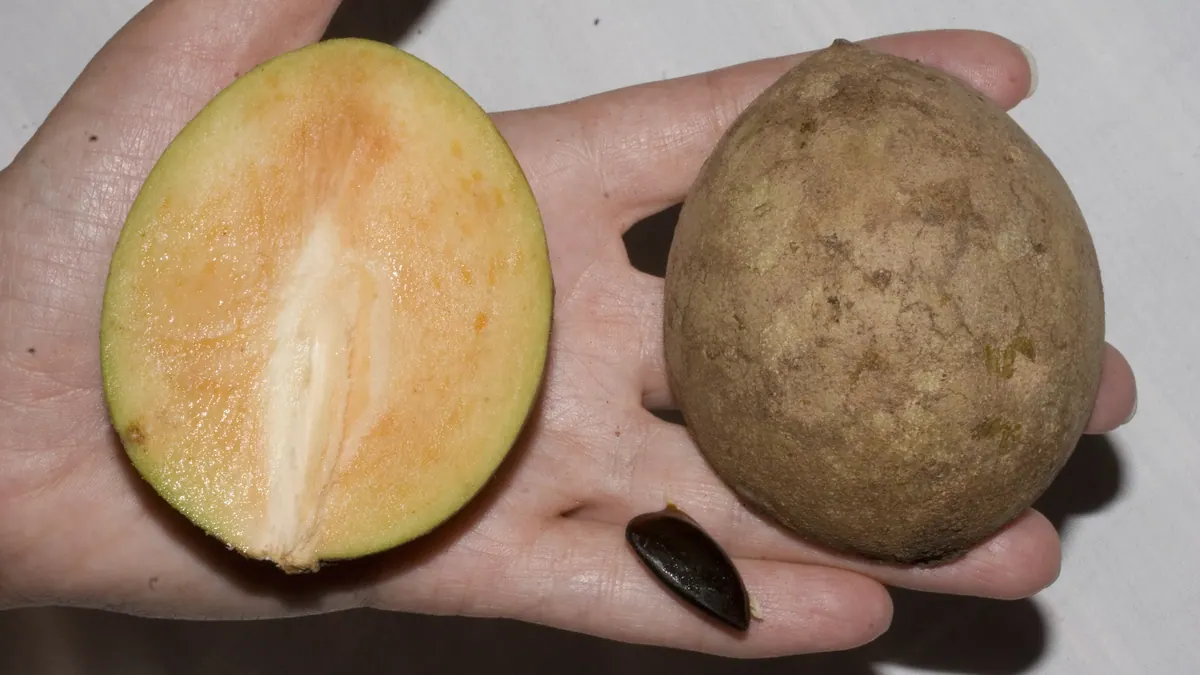
Sapodilla fruit and peels — BMP: 2 studies, weighted mean 286 m³ CH₄/t VS
286 m³ CH₄/t VS weighted mean from 2 studies
≈52 %
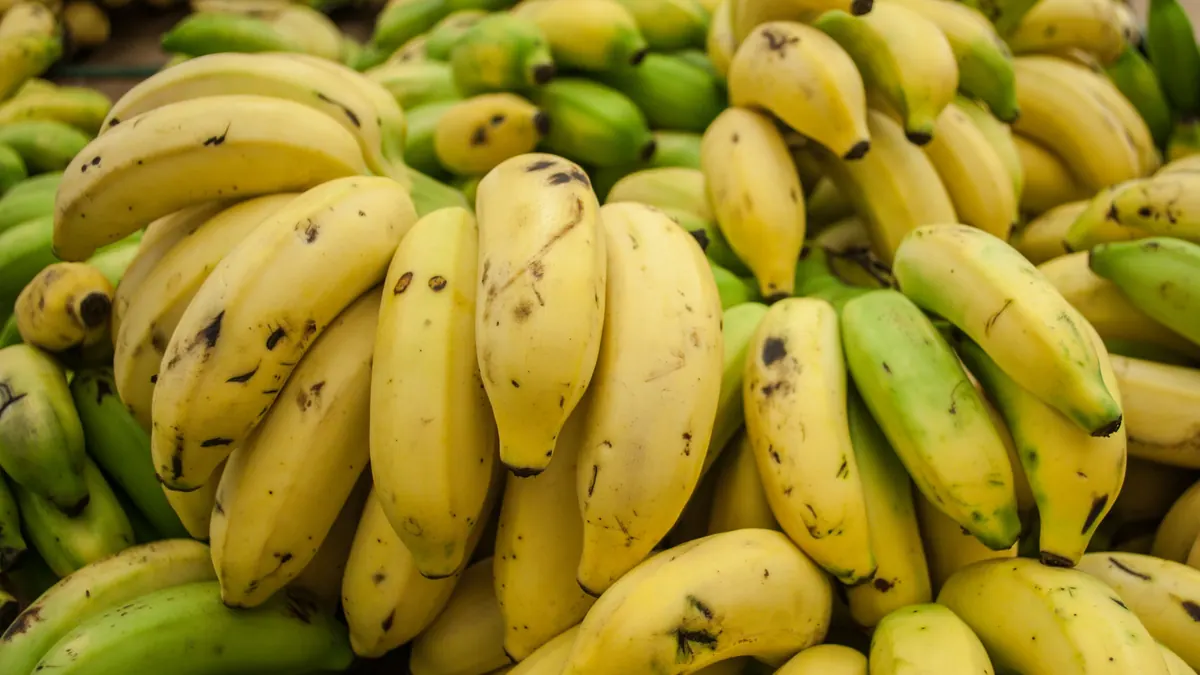
Bananas (fruit, pulp) — BMP: 6 studies, weighted mean 336 m³ CH₄/t VS
336 m³ CH₄/t VS weighted mean from 6 studies
≈52 %
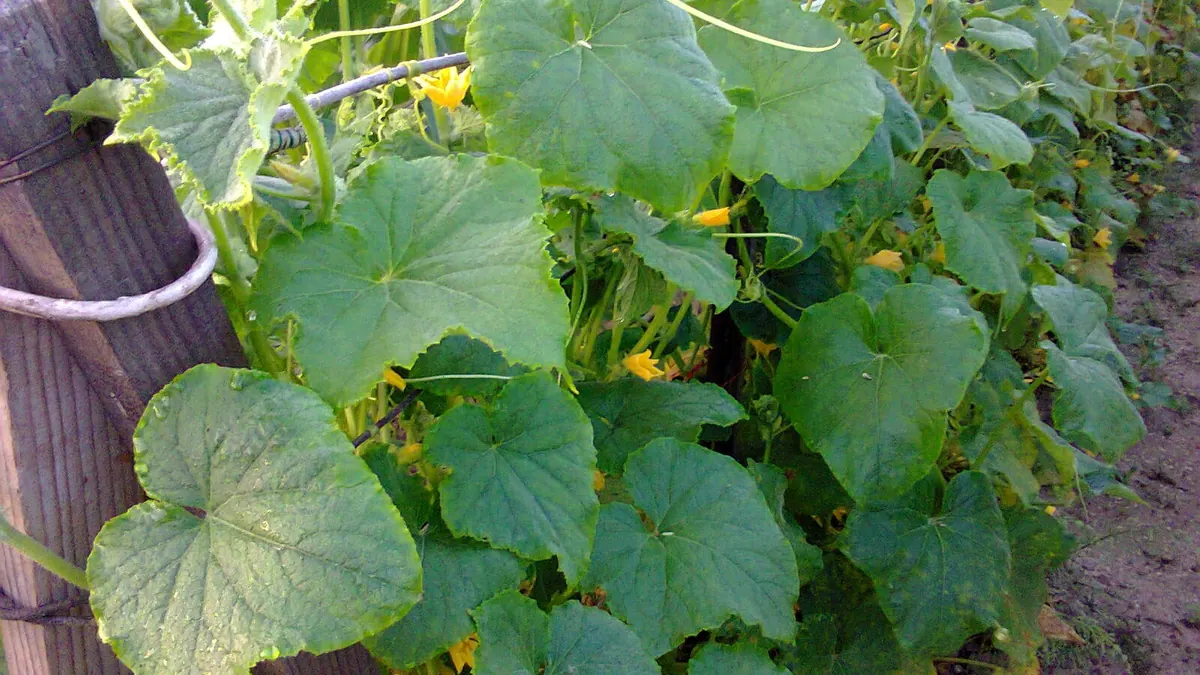
Cucumbers — BMP: 3 studies, weighted mean 313 m³ CH₄/t VS
313 m³ CH₄/t VS weighted mean from 3 studies
≈55 %