FOS/TAC in a biogas plant: how to measure, how to interpret, what not to do
FOS/TAC is the ratio of volatile organic acids to alkalinity. We explain the titration method, typical ranges, interpretation pitfalls and the role of the trend.
Other language versions: polski.

FOS/TAC is an indicator of the ratio of volatile organic acids (FOS) to buffering capacity (TAC) in a slurry sample from the digester; in many plants values of approx. 0.2–0.4 are regarded as typical for a stable process, and a rise above approx. 0.4–0.5 is a warning signal. It is a quick, cheap test, but only an estimate — its strength lies in tracking the trend within a single plant, not in comparing with "textbook" values.
What the method involves
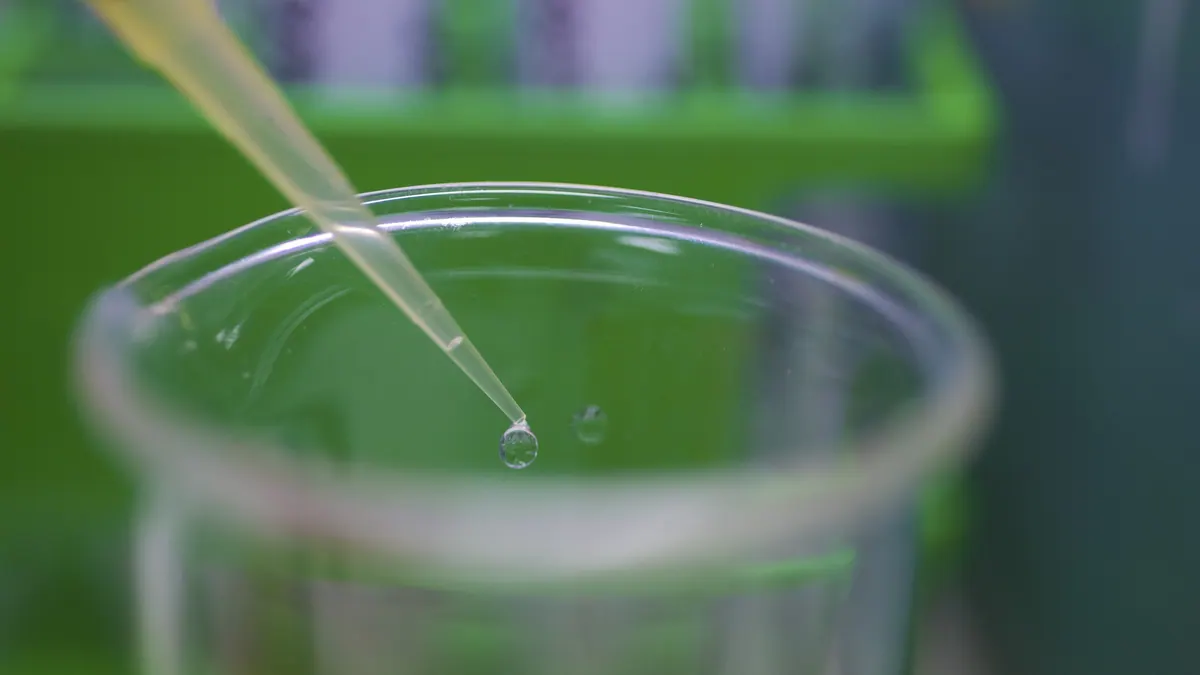
The sample is centrifuged (or filtered) and titrated with sulphuric acid of known concentration. The method (the Nordmann modification, used, among others, in automatic titrators) records the volume of acid consumed to reach pH 5.0, and then pH 4.4. From the first reading TAC (alkalinity, expressed as mg CaCO₃/l) is calculated, and from the difference of the readings — FOS (acids, expressed in mg acetic acid equivalent/l). The formulae depend on the procedure and the sample volume; use those from the instrument or laboratory instructions and do not change them during a series.
Typical values
| FOS/TAC | Interpretation (indicative) |
|---|---|
| < 0.2 | shortage of acids; possible underloading of the digester |
| 0.2–0.4 | typical range for stable operation in many plants |
| 0.4–0.6 | elevated; check VFA, feed carefully |
| > 0.6 | risk of acidification, reduce the feed and intervene |
The limits depend on the substrate and the regime. Plants on slurry with high alkalinity may operate stably at a slightly higher value than plants on silage.
Interpretation pitfalls
- Ammonium alkalinity. A high ammonium concentration raises TAC, which lowers the indicator despite the presence of acids.
- A bad sample. A sample that has not been degassed or centrifuged gives a random result; suspended solids and CO₂ disturb the titration.
- Different methods. The result depends on the pH thresholds and the calculations (e.g. the Nordmann method vs. others). Do not compare data from different laboratories without checking the methodology.
- Substrates. A new component of the mix can shift the "normal" value.
- Hidden propionate. The indicator does not distinguish between acids; the same FOS may mean harmless acetate or dangerous propionate.
Good measurement practice
- Measure regularly (every few days to once a week, more often when feed rates change or there are problems).
- Take the sample from the same place and at the same time relative to feeding.
- Keep a trend chart together with the feed rate, pH and gas composition.
- From time to time compare with VFA chromatography to calibrate your own interpretation.
- Record the version of the method and do not change it without noting it.
Reaction to the result
| Situation | Action |
|---|---|
| Slow rise in FOS/TAC at a constant feed rate | look for the cause: substrate change, temperature drop, trace element deficiency |
| Rapid rise after increasing the feed rate | return to the previous feed rate, possibly suspend feeding of easily degradable substrates |
| High value, but gas stable | confirm with VFA, do not overreact |
| Low value | consider a careful increase in load |
When in doubt, the answer is given by the set: FOS/TAC, pH, gas composition (CH₄, H₂S), gas production per day and VFA. A single number should never be the basis for major decisions on changing feed rates.
An example trend
Suppose that for a month a plant operated at FOS/TAC of 0.28–0.32 at a constant feed rate. After the share of silage is increased, the indicator rises over a week: 0.33, 0.38, 0.45, 0.52. A single value of 0.45 is not necessarily dangerous, but a one-directional rise and no return after a few days is a signal to reduce the feed rate. If at the same time pH falls by 0.2, and CH₄ in the biogas by 1–2 percentage points, the decision is obvious.
Alternatives and supplements
A fuller picture is given by the chromatographic profile of fatty acids (acetic, propionic, butyric, valeric). Simple titration is a good "smoke detector", but the diagnosis is made on the basis of VFA. NIR probes and pH/ORP sensors are also found, which can supplement measurements but require calibration for the specific plant.
The most common laboratory errors
- centrifuging for too short a time or no filtration, so that suspended solids overstate acid consumption,
- old or badly calibrated pH electrodes,
- changing the titrant concentration without correcting the calculations,
- taking a sample right after feeding fresh substrate, which distorts the result,
- comparing results from several laboratories without harmonising the methodology.
Even a simple protocol (a constant sample volume, a constant centrifuging time, recording the titrant batch number) significantly improves repeatability.
Sources
Questions and answers
What FOS/TAC value is dangerous?
There is no universal threshold. Values above approx. 0.4–0.5 in a plant that usually has 0.25 require a response; in another one, running stably at higher values, a rapid rise matters more.
Related articles