Law and regulationAnalysis
Ontario FIT: prices for biogas, landfill gas and biomass in 2016–2017 and the end of the programme
In Ontario's FIT programme, farm biogas received up to 26.3 cents per kWh in 2016, and up to 25.8 cents in the final, fifth round in 2017. We compare the price schedules and describe the end of the programme.
Other language versions: polski.
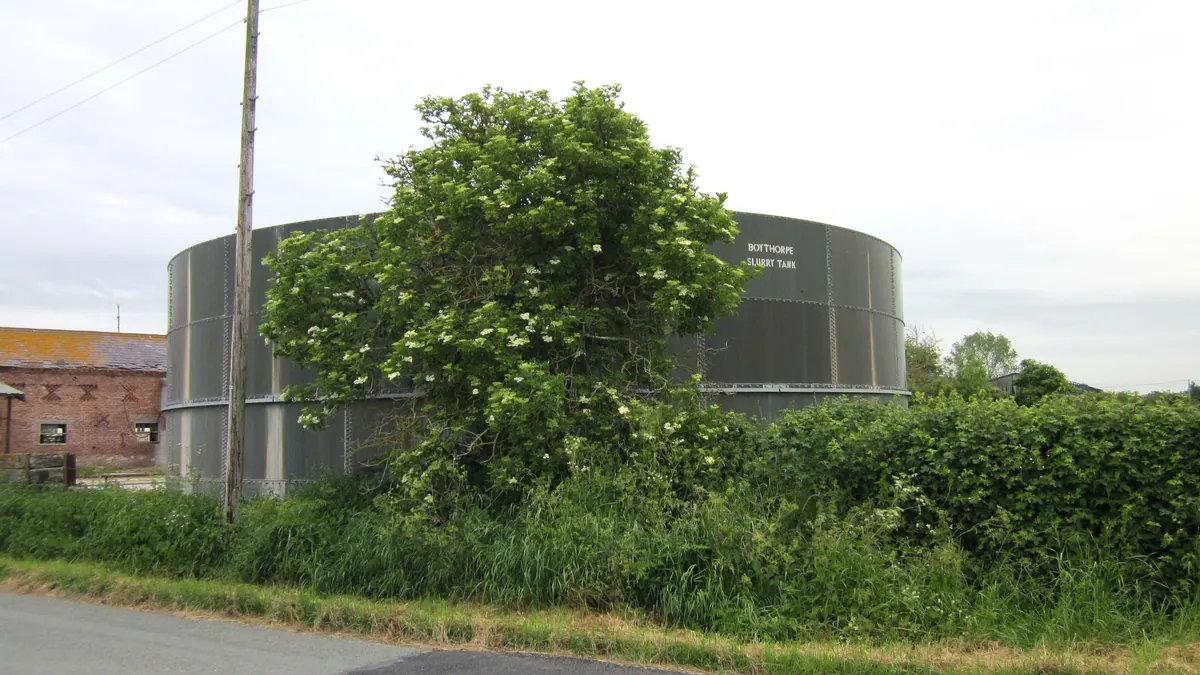

The Ontario feed-in tariff (FIT) programme was for years one of the most detailed price schedules in the world for electricity from biogas. The last two price schedules, of 1 January 2016 and 1 January 2017, show how much was paid for energy from agricultural biogas, landfill gas and biomass in installations of up to 500 kW, and how the programme ended.
How the price schedule worked
The FIT programme, run by the IESO (Independent Electricity System Operator), awarded contracts to renewable projects with a capacity of typically up to 500 kW. The contract price depended on the fuel and the size of the project. Part of the price was indexed to CPI: according to the price schedule (the "Percentage Escalated" column), 50% of the price for farm biogas, biogas and landfill gas in 2016. Adders could be added to the price for the participation of local communities, municipal entities and Indigenous communities: in the 2017 price schedule from 0.5 to 1.5 cents per kWh, depending on the type and level of participation.
Prices in 2016 and 2017
Prices in Canadian cents per kWh:
| Fuel and capacity band | 1 January 2016 | 1 January 2017 |
|---|---|---|
| Farm biogas, up to 100 kW | 26.3 | 25.8 |
| Farm biogas, 100–250 kW | 20.4 | 20.0 |
| Biogas, up to 500 kW | 16.8 | 16.5 |
| Landfill gas, up to 500 kW | 17.1 | 16.8 |
| Biomass, up to 500 kW | 17.5 | 17.2 |
- 1 January 2016
- 1 January 2017
It is clear that the programme favoured biogas from small farms: an installation of up to 100 kW received more than 9 cents more per kWh than a larger biogas plant of up to 500 kW. With each price schedule, however, prices were slightly reduced. Between 2016 and 2017 the decline was between 0.3 and 0.5 cents.
Worked example
For illustration: a biogas installation with a capacity of 100 kW, operating for 8000 hours a year, generates 800 MWh. At the price of 26.3 c/kWh from the 2016 price schedule this gives approx. CAD 210,400 a year, and at 25.8 c/kWh from the 2017 price schedule approx. CAD 206,400. A difference of 0.5 cents therefore translates into approx. CAD 4000 a year. This is an indicative calculation: real production depends on the availability of the installation, and CPI indexation and any adders come on top of the price.
Why the split into capacity bands
The price schedule rewarded small units with a higher price because the unit cost of a kWh from a small biogas plant is higher: the fixed cost of the digester, the cogeneration unit and the grid connection is spread over less energy. For an on-farm installation that uses slurry, this is a solution similar to those we know from European capacity-dependent tariffs. The 2017 price schedule kept the same division into bands as the 2016 one: up to 100 kW, 100–250 kW and up to 500 kW. Only the prices changed, by 0.3–0.5 cents.
Adders for local participation
Adders (price adders) were added to the base price for the participation of local entities in a project. In the 2017 price schedule they were as follows:
| Type of participation | Participation above 50% | Participation 15–50% |
|---|---|---|
| Indigenous communities | 1.5 c/kWh | 0.75 c/kWh |
| Local community | 1.0 c/kWh | 0.5 c/kWh |
| Municipal or public entity | 1.0 c/kWh | 0.5 c/kWh |
For a small agricultural biogas plant, this meant that a local community's stake in the project could raise the price by a few per cent, which encouraged the building of installations with community participation.
The fourth FIT round: bioenergy
In June 2016 the IESO offered contracts in FIT 4. According to Canadian Biomass Magazine, they covered 14 bioenergy projects with a combined capacity of 3.45 MW: almost all of them agricultural or other biogas plants, with a capacity of 100 to 500 kW, plus one renewable biomass installation of 250 kW. The article does not mention landfill gas projects in this group.
The last round
In September 2017 the IESO offered contracts for 150 MW in the fifth round, described in the trade press as the last in the FIT programme. Photovoltaics dominated (382 of the 390 contracts offered), and bioenergy received little: seven agricultural biogas plants and one landfill gas installation using municipal waste. In this round applicants could earn priority points by offering a price lower than that in the price schedule.
Conclusions
The Ontario FIT shows how a feed-in tariff differentiated by size and fuel type can support small agricultural biogas plants, and at the same time how narrow its scope was: a 500 kW ceiling and a handful of contracts in the last round. Today, Canadian biogas revenue is tied rather to the clean fuel credit market, described in the entry on the Clean Fuel Regulations.
Sources
Questions and answers
What does “percentage escalated” mean in the FIT tariff?
It is the part of the contract price indexed to the CPI. For farm-based biogas, biogas and landfill gas, it was 50 per cent in the 2016 tariff.
Related articles