BMP testingAnalysis
Scatter of BMP results between laboratories: where it comes from and how to read it
Why does the same silage give different BMP in different laboratories? A review of the sources of scatter, measures (SD, RSD, z-score), an example and rules for comparing results.
Other language versions: polski.
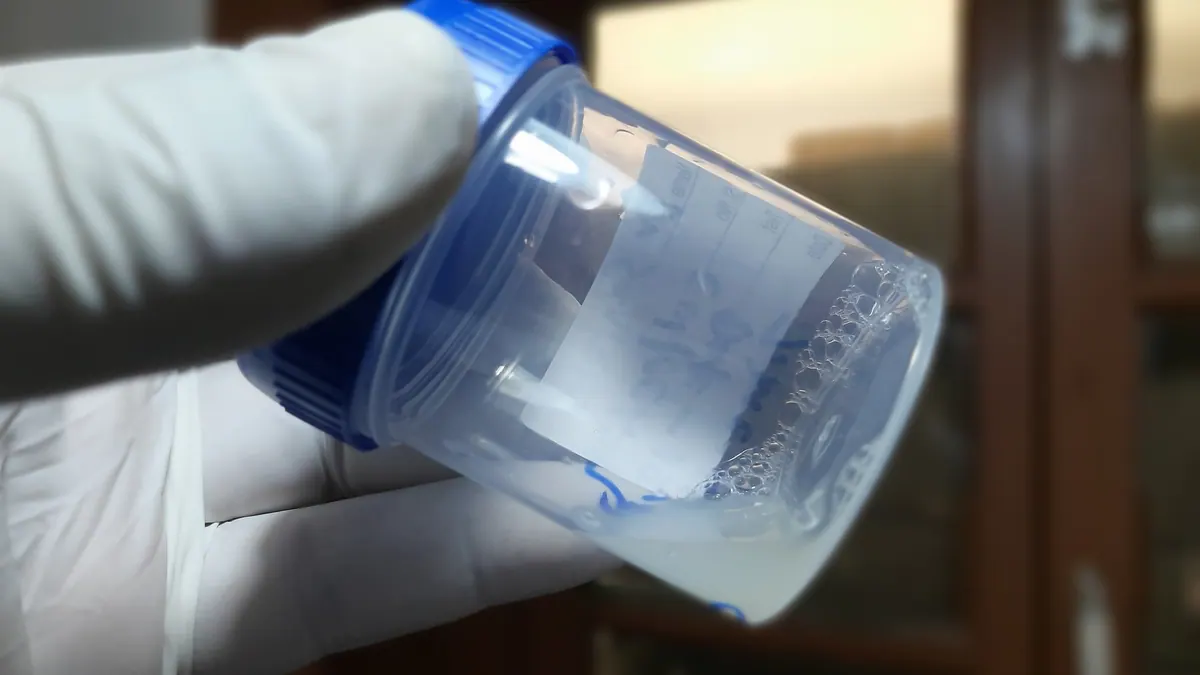

The scatter of BMP results between laboratories arises from several sources: sample heterogeneity, differences in inoculum and I/S, temperature, gas measurement method and the way of calculating. Protocol standardisation and the cellulose control reduce scatter but do not eliminate it, so a BMP result should be read as a value with an uncertainty range, not as a material constant. A good habit is to compare results from several sources and to weight them according to the quality of the methodology.
Sources of scatter
| Source | Example | Impact |
|---|---|---|
| Sample | different batch, sampling method, size reduction | often the greatest |
| Preparation | loss of volatiles during drying, VS error | systematic |
| Inoculum | source, activity, background | affects kinetics and sometimes the result |
| I/S | too low → inhibition | may understate the result |
| Temperature | 35 vs 38 °C, thermophilic | changes the rate and sometimes the yield |
| Gas measurement | manometry, volumetry, calibration | systematic |
| Calculations | water vapour, standard conditions | a few to a dozen or so per cent |
| Test duration | 28 d vs until exhaustion | understatement for slow substrates |
Measures of scatter
- SD (standard deviation) – in units of the result.
- RSD (CV) – SD/mean; allows different substrates to be compared.
- Repeatability (within one laboratory) and reproducibility (between laboratories) – two different levels; reproducibility is greater.
- z-score in proficiency studies: z = (x − x_ref)/σ; |z| ≤ 2 is usually considered satisfactory.
Example
Five laboratories tested the same silage: 285, 300, 315, 325, 340 NmL CH₄/g VS.
- mean: 313; SD ≈ 21.4; RSD ≈ 6.8%.
- When the mean is the reference value, the z-score for 285 is (285 − 313)/21.4 ≈ −1.3; for 340 ≈ +1.3. No laboratory falls outside ±2.
- Conclusion: agreement is good; the single result of 340 is not "wrong", but it can be interpreted as the upper part of the range.
How to read figures from the literature and databases
- Check the method (inoculum, I/S, temperature, duration, calculations).
- Pay attention to the basis: VS, TS, FM.
- Pay attention to the type of material (variety, harvest date, size reduction).
- Do not uncritically combine results from different methods; if necessary, introduce weights.
- Give the range and the number of sources.
What a laboratory can do
- Introduce a cellulose control chart and keep statistics.
- Take part in proficiency studies.
- Validate the calculation spreadsheet.
- Harmonise sample preparation and measurement conditions.
- Report the full method data.
What a client can do
- Require a method consistent with recognised guidelines.
- Commission the test at two laboratories for important investment decisions.
- Supply representative samples and several replicates from different places.
- Take uncertainty into account in financial models (low, medium and high scenarios).
The impact of substrate heterogeneity
Even a perfect laboratory will not remove the variability of the material itself. Silages from different fields, varieties and harvest dates differ so much that biological scatter often exceeds analytical scatter. A single BMP figure for "maize silage" is therefore always an average; in planning it is worth using ranges, and in operation — analyses of one's own batches.
Conclusions
When interpreting scatter, ask three questions: is the method well described, was the cellulose control correct, and do the differences fall within the range typical of reproducibility. If so, the results can be treated as consistent and decisions based on the range. If not, it is worth repeating the test or asking for the documentation to be supplemented.
Statistics for the practitioner: how many replicates are enough
Three replicates are the minimum that allows scatter to be estimated, but the confidence interval of a mean of three points is wide. For important decisions (e.g. a substrate supply contract) it is justified to increase the number of replicates or the number of independent samples of the material. Variability between samples (batches) is usually greater than variability between replicates of the same sample, so more samples give more information than more bottles from the same one.
How to present the result
Good practice is to report the result in the form: mean ± standard deviation (n = number of samples, k = number of replicates), with the min–max range indicated. This lets the recipient see both the central value and the variability, and build scenarios in financial models.
Example of use in planning
If three laboratories gave 300, 320 and 340 NmL CH₄/g VS for silage, the base scenario can be based on the mean of 320, the cautious scenario on 300 and the optimistic one on 340. The 13% difference between the extremes translates directly into a difference in methane production and revenue, so it deserves attention when assessing project risk.
Sources
Questions and answers
What spread is "normal"?
For agricultural substrates, differences in the order of several to a dozen or so per cent between well-run laboratories are not uncommon; for difficult or heterogeneous materials they can be larger. It is better to assess agreement than to demand identical numbers.
Related articles