

BMP testingWild, invasive and medicinal plantssingle study (2 samples)
Para grass — BMP: 2 studies, weighted mean 240 m³ CH₄/t VS
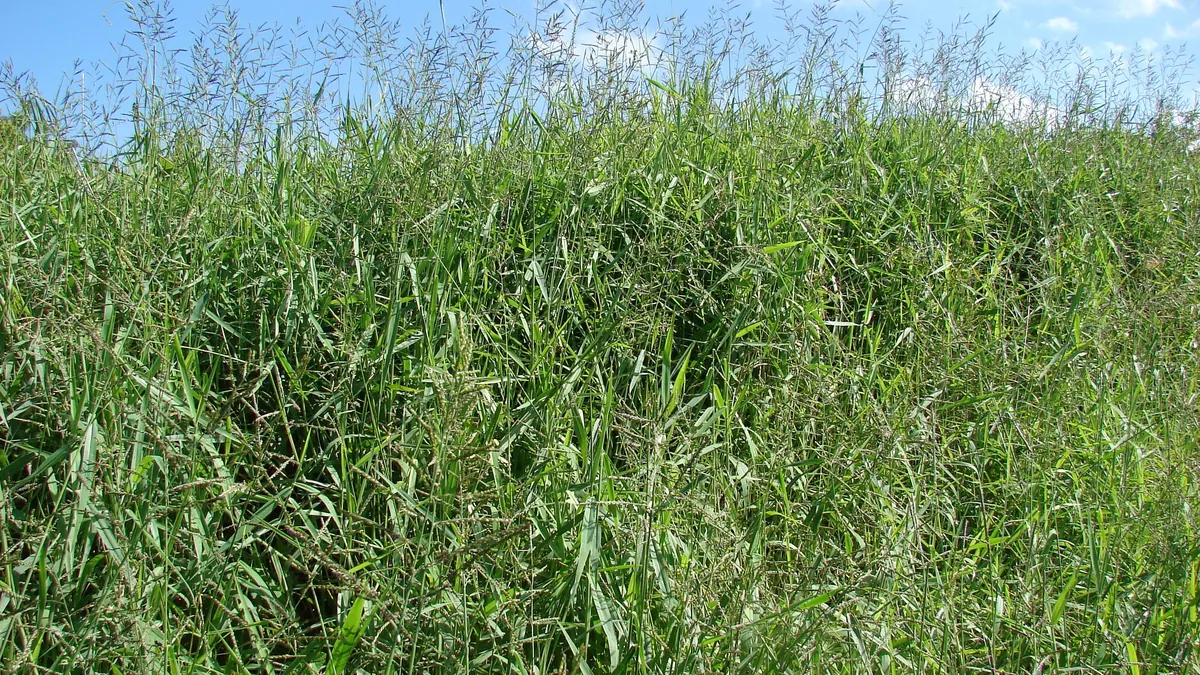
Para grass (Urochloa mutica) is a fast-growing tropical fodder grass, studied as energy biomass; the records of one study are almost identical.
Photo Forest & Kim Starr / Wikimedia Commons, licence CC BY 3.0, source file; changes: cropping

- Weighted mean
- 240m³ CH₄/t VS
- Range
- 238–242m³ CH₄/t VS
- Records
- 2single study (2 samples)
- Publications
- 1source
- Temperatures
- 35 °Cof the test
Methane in biogas
Medium methane content · ≈ 5.2 kWh/m³ of biogas
estimate from the substrate type The collected studies contain no measurement. The interval follows from the approximate composition (carbohydrate-dominated (no protein or fat characteristics)) and the yields of compound groups according to FNR.
Rating for biogas plants
not rated — editorial rating for biogas plants
Not rated: no dry matter or volatile solids in the data. We calculate the rating when the dry matter and volatile solids of the material are known.
Add to the co-digestion calculator CSV data
BMP curves from 2 studies
Weighted mean Individual records
Dashed lines are a model curve (first-order kinetics, B(t) = B₀·(1 − e−kt)); the end point comes from the publication. All curves are model curves.
Cumulative methane production over the test [m³ CH₄/t VS]. The thick line is the weighted mean of all records (240); dots mark the end values given in the publications. Point at the chart to read values; click a legend item to hide or show a record.
Records and sources
Download CSV| Source | BMP m³ CH₄/t VS | Temperature | Sample | Curve |
|---|---|---|---|---|
| Chynoweth et al. (1993) · 1 DOI | 238 | 35 °C · mesophilic | Paragrass 3P | end point (model curve) |
| Chynoweth et al. (1993) · 2 DOI | 242 | 35 °C · mesophilic | Paragrass 1P | end point (model curve) |
| Weighted mean | 240 | arithmetic mean 240, SD 3 | ||
Process properties
Low confidence: the description is based on general characteristics of the substrate group, not on studies of this material. Treat it as a hint to be verified.
Advantages
- Methane potential in the database: weighted mean 240 m³ CH₄/t VS (median 240; range 238–242; 2 records from 1 sources).
Co-digestion — what to combine it with, what to watch out for
- combines well
group: Animal excreta (slurry, manure, poultry litter)
The standard combination of grasses with manure/slurry.[1][2]
Dosing
Practical requirements
- Shred: shredding increases the surface available for degradation and speeds it up, but does not necessarily raise the final gas yield (FNR 2010, Ch. 3 “Triturado”).
Sources of the process data
- Lehtomaki, A.; Huttunen, S.; Rintala, J.A. (2007) Laboratory investigations on co-digestion of energy crops and crop residues with cow manure for methane production: effect of crop to manure ratio. Resources, Conservation and Recycling
- Weiland, P. (2010) Biogas production: current state and perspectives. Applied Microbiology and Biotechnology
- Chynoweth, D.; Turick, C.; Owens, J.; Jerger, D.; Peck, M. (1993) Biochemical methane potential of biomass and waste feedstocks. Biomass and Bioenergy 5(1), 95–111
- Hendriks, A.T.W.M.; Zeeman, G. (2009) Pretreatments to enhance the digestibility of lignocellulosic biomass. Bioresource Technology
- FNR (2010). Guía sobre el Biogás – Desde la producción hasta el uso (hiszp. wydanie „Leitfaden Biogas”, GIZ 2013)
The co-digestion calculator will assess a specific mixture containing this substrate.
What it is and where it comes from
Para grass (Urochloa mutica, formerly Brachiaria mutica) is a perennial stoloniferous grass originating from Africa, widely spread in the tropics and subtropics, where it is grown as fodder on wet and flooded land. It forms dense mats and regrows quickly after cutting. In the dataset it represents a group of tropical fodder grasses studied as an energy feedstock.
Properties relevant to digestion
Like other grasses, it consists of cellulose, hemicellulose and lignin, with the lignin share rising with age and digestibility falling. Young green forage contains more protein and soluble sugars, which speeds up hydrolysis. The high moisture of green forage favours ensiling, but also rapid spoilage. The C/N ratio changes from low in young grass to high in mature grass. Chopping is important, because long fibres can wind around agitators. Green forage from wetlands carries sand and silt.
How to read the spread of results
The dataset contains several records from one source at 35 °C, with almost identical values (labels 1P and 3P). This shows repeatability within a single study, but says nothing about the effect of harvest date, plant age, fertilisation, degree of chopping or inoculum, which under other conditions may change the result. Variability between laboratories cannot be derived from one source.
In biogas plant practice
In tropical countries Para grass can be used as an addition to a feed with manure; the key is the cutting date and prompt ensiling or use. In Polish conditions it is not grown, and the function of a similar feedstock is fulfilled by meadow grasses, grass silage and biomass from wasteland. When planning a plant in a tropical climate, competition with fodder must be taken into account.
For comparison with temperate-zone grasses, Para grass can be treated as the equivalent of meadow grasses with a relatively high biomass production, but a lower fodder and energy quality than young green forage. Mature shoots have clearly more lignin, so the cutting date is decisive here for methane yield.
Nitrogen fertilisation increases yield and protein content, but lowers the C/N ratio, so on intensively fertilised plantations the grass behaves differently from at natural sites. Such a difference is worth taking into account when transferring results.
Methodology in brief
BMP is the amount of methane obtained from volatile solids (VS) in a batch test, given in m³ CH₄ per tonne of VS (numerically the same as NmL CH₄/g VS in the publications) and converted to normal conditions (0 °C, 101.325 kPa). The weighted mean gives each publication a total weight of 1, split equally between its results for the substrate — a paper testing twenty varieties does not outweigh a paper with a single sample. In inter-laboratory programmes the unit is the laboratory (total weight 1), and within it the weight of a test grows with the number of bottles (replicates). Results after pretreatment (e.g. thermal, chemical, enzymatic) are shown separately and are not included in the mean.
Solid lines are curves measured in the tests. Where a publication gives only the final result, we draw a first-order kinetic model, B(t) = B₀·(1 − e−kt): only the end point comes from the publication, and the shape of the curve serves purely as visualisation — do not read the production on a particular day from it. For this substrate k = 0.134 d−1 was assumed (median of rate constants k reported in the sources and/or fitted to the mean measured curves).
The statistics describe the spread of published results — a descriptive compilation, not a meta-analysis or a guarantee of plant yield.
Bibliography
- Chynoweth, D.; Turick, C.; Owens, J.; Jerger, D.; Peck, M. (1993). Biochemical methane potential of biomass and waste feedstocks. Biomass and Bioenergy 5(1), 95–111. DOI: 10.1016/0961-9534(93)90010-2 DOI
All sources of the site: bibliography.
Other substrates in the group “Wild, invasive and medicinal plants”
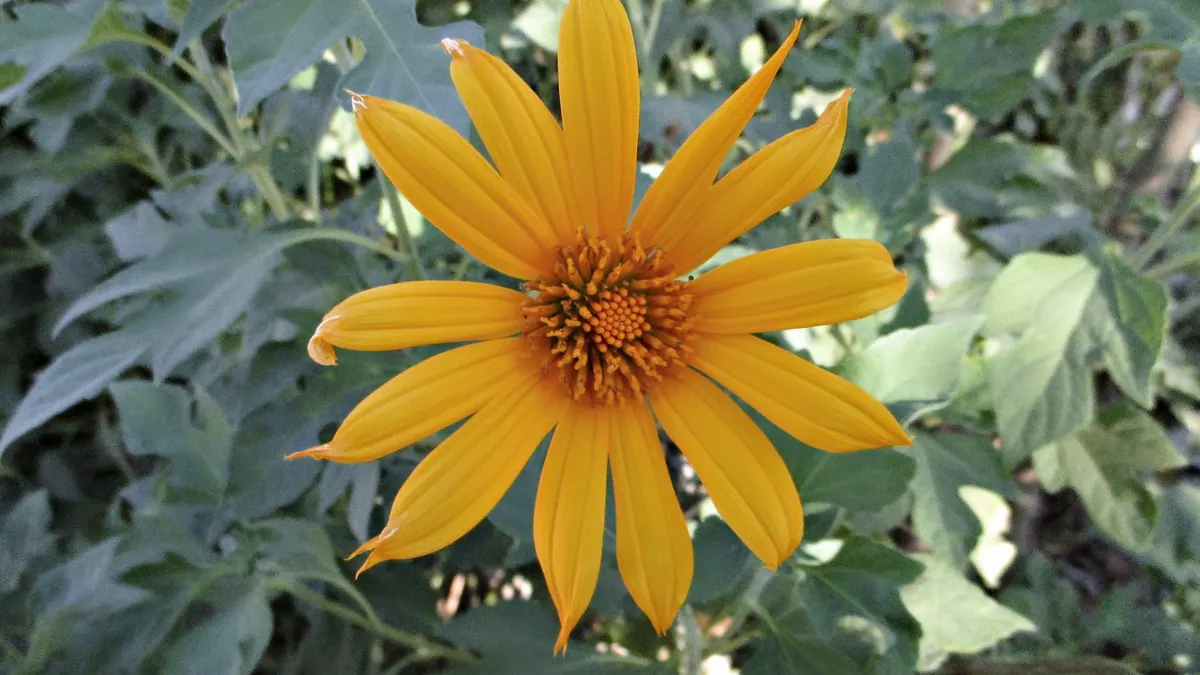
Mexican sunflower (Tithonia diversifolia) — BMP: 2 studies, weighted mean 210 m³ CH₄/t VS
210 m³ CH₄/t VS weighted mean from 2 studies
≈55 %

Common reed — BMP: 15 studies, weighted mean 170 m³ CH₄/t VS
170 m³ CH₄/t VS weighted mean from 15 studies
≈52 %
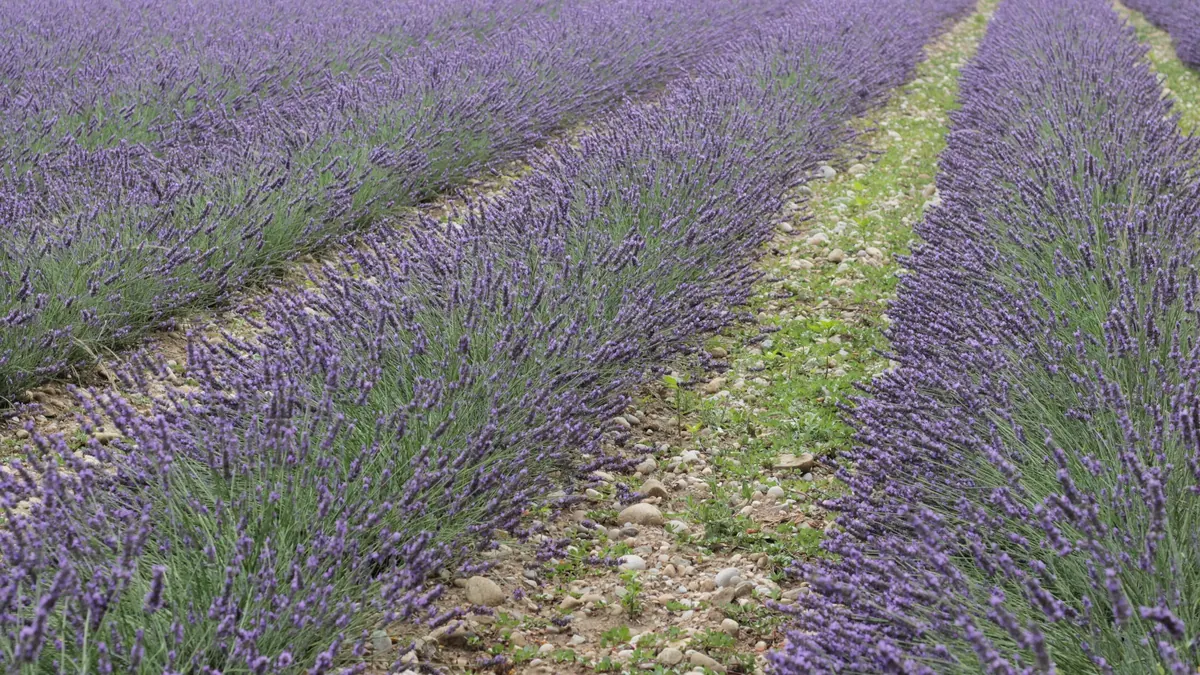
Lavender flowers and distillation residues — BMP: 2 studies, weighted mean 186 m³ CH₄/t VS
186 m³ CH₄/t VS weighted mean from 2 studies
≈52 %
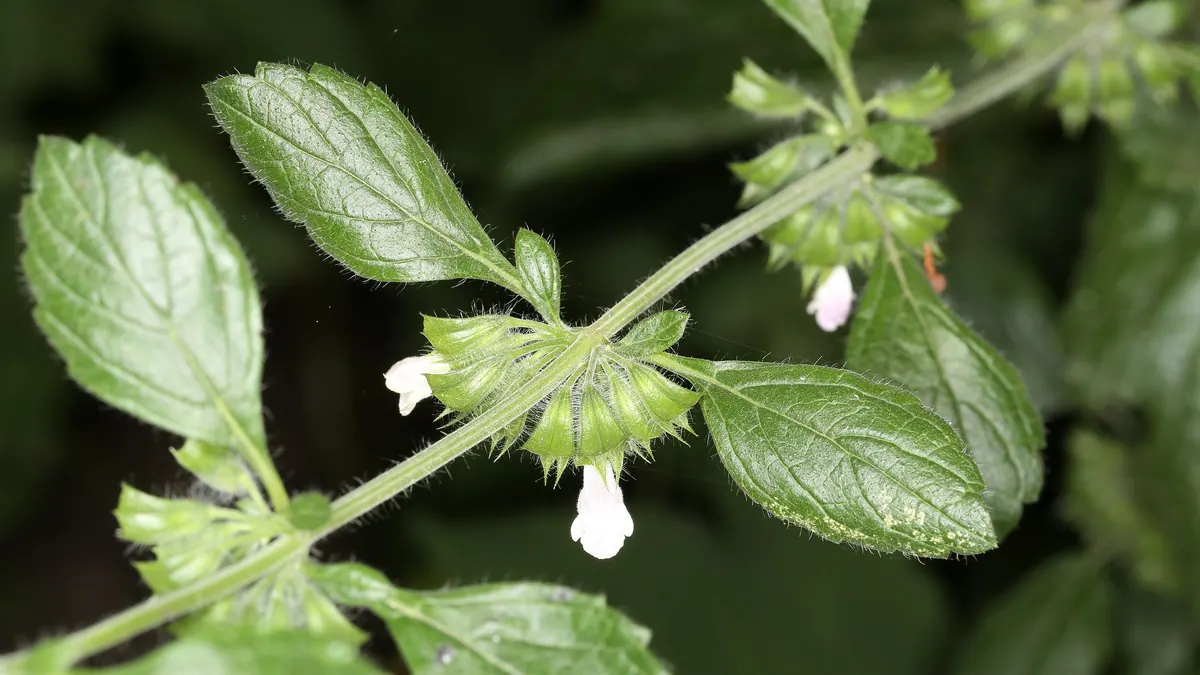
Herbs and herbal industry wastes (lemon balm, alder buckthorn, mint, andrographis, catnip, figwort) — BMP: 6 studies, mean 144 m³ CH₄/t VS
144 m³ CH₄/t VS weighted mean from 6 studies
≈59 %