

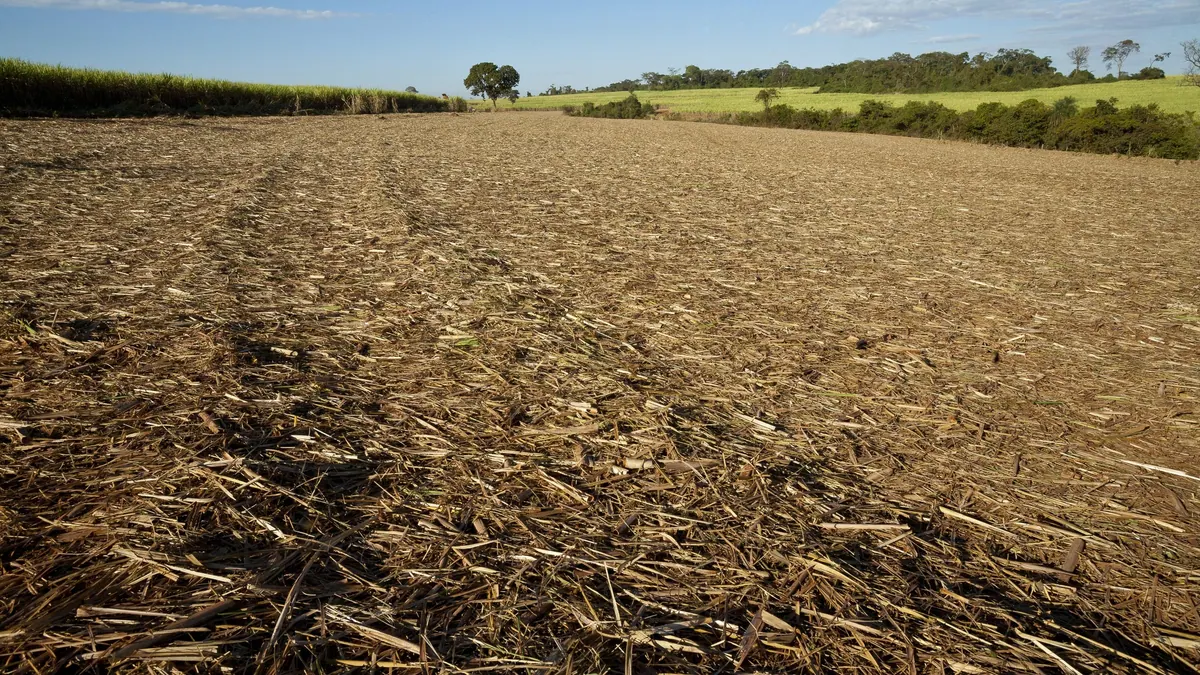
BMP testingStraws and crop residues
Sugarcane straw — BMP: 3 studies, weighted mean 300 m³ CH₄/t VS
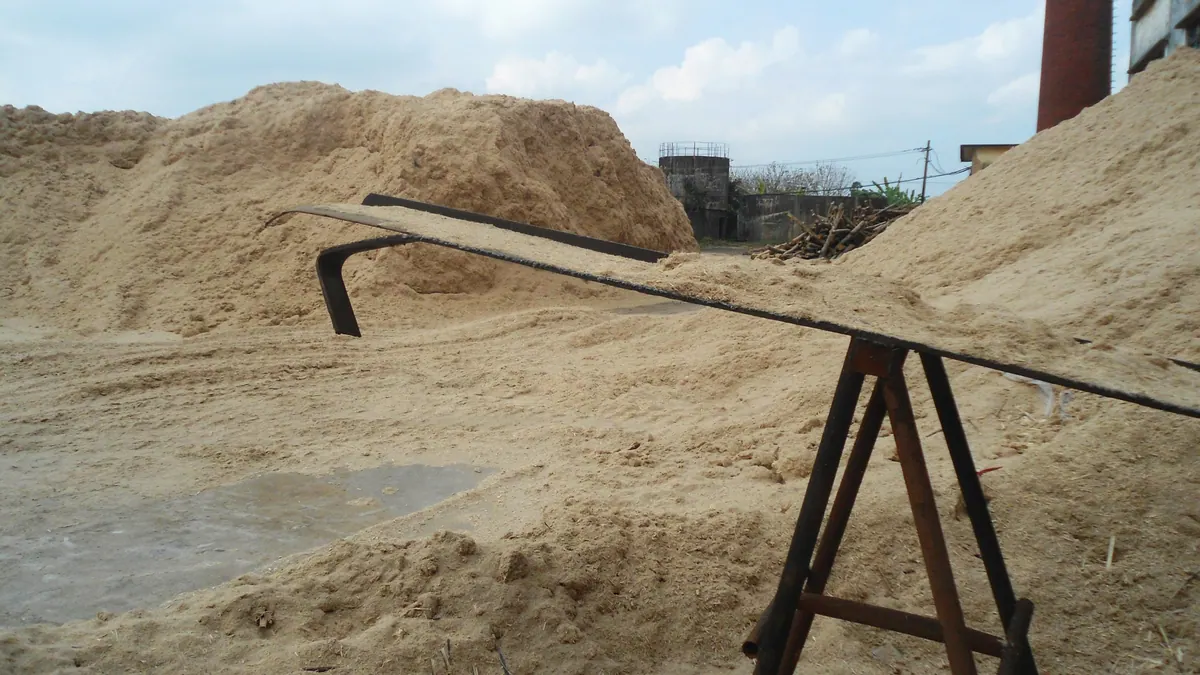
Sugarcane straw consists of leaves and tops left after the stalks are harvested. Lignocellulosic, dry and hard to degrade, it requires chopping and usually pretreatment.
Photo Jonathan Wilkins / Wikimedia Commons, licence CC BY-SA 3.0, source file; changes: cropping

- Weighted mean
- 300m³ CH₄/t VS
- Range
- 199–383m³ CH₄/t VS
- Records
- 3studies
- Publications
- 2sources
- Temperatures
- 38 °Cof the test
Methane in biogas
Medium methane content · ≈ 5.2 kWh/m³ of biogas
estimate from the substrate type The collected studies contain no measurement. The interval follows from the approximate composition (carbohydrate-dominated (no protein or fat characteristics)) and the yields of compound groups according to FNR.
Rating for biogas plants
not rated — editorial rating for biogas plants
Not rated: no dry matter or volatile solids in the data. We calculate the rating when the dry matter and volatile solids of the material are known.
Add to the co-digestion calculator CSV data
BMP curves from 3 studies
Weighted mean Individual records
Dashed lines are a model curve (first-order kinetics, B(t) = B₀·(1 − e−kt)); the end point comes from the publication. All curves are model curves.
Cumulative methane production over the test [m³ CH₄/t VS]. The thick line is the weighted mean of all records (300); dots mark the end values given in the publications. Point at the chart to read values; click a legend item to hide or show a record.
Records and sources
Download CSV| Source | BMP m³ CH₄/t VS | Temperature | Sample | Curve |
|---|---|---|---|---|
| Janke et al. (2015) · 1 DOI | 199 | 38 °C · mesophilic | sugarcane straw S-2 | end point (model curve) |
| Janke et al. (2015) · 2 DOI | 234 | 38 °C · mesophilic | sugarcane straw S-1 | end point (model curve) |
| López-Dávila et al. (2022) DOI | 383 | — | Cane straw | end point (model curve) |
| Weighted mean | 300 | arithmetic mean 272, SD 98 | ||
Process properties
Advantages
- Methane potential in the database: weighted mean 300 m³ CH₄/t VS (median 234; range 199–383; 3 records from 2 sources).
Drawbacks and risks
- Janke 2015 describes the kinetic challenges of digesting sugarcane waste — a long HRT or pretreatment is required.
Co-digestion — what to combine it with, what to watch out for
- combines well
Dosing
No source-based dose limits; an entry mainly for tropical regions.
Practical requirements
- Size reduction, pretreatment (Janke 2015)
Sources of the process data
- Janke, L.; Leite, A.; Nikolausz, M.; Schmidt, T.; Liebetrau, J.; Nelles, M.; Stinner, W. (2015) Biogas Production from Sugarcane Waste: Assessment on Kinetic Challenges for Process Designing. International Journal of Molecular Sciences 16(9), 20685–20703
- Weiland, P. (2010) Biogas production: current state and perspectives. Applied Microbiology and Biotechnology
- Dahunsi, S. (2019) Mechanical pretreatment of lignocelluloses for enhanced biogas production: Methane yield prediction from biomass structural components. Bioresource Technology 280, 18–26
- Hendriks, A.T.W.M.; Zeeman, G. (2009) Pretreatments to enhance the digestibility of lignocellulosic biomass. Bioresource Technology
- López-Dávila, E.; Jiménez Hernández, J.; López González, L.M.; Barrera Cardoso, E.L.; Bravo Amarante, E.; Contreras Velázquez, L.M.; Romero-Romero, O. (2022) Biochemical methane potential of agro-wastes as a renewable source alternative for electrical energy production in Cuba. Ciencia & Tecnología Agropecuaria 23(1)
The co-digestion calculator will assess a specific mixture containing this substrate.
What it is and where it comes from
Sugarcane straw (cane straw, trash) comprises the leaves, leaf sheaths and tops of the plants which, during harvest, are separated from the stalks destined for juice pressing. In mechanical harvesting without prior burning of the field, a large part of this biomass remains in the field or is transported together with the stalks. It is a separate stream from bagasse, i.e. the pressed residue after juice extraction. In Europe this material does not occur; it is significant for tropical and subtropical countries.
Properties relevant to digestion
Sugarcane straw is a lignocellulosic biomass with low moisture after drying out, rich in cellulose and hemicelluloses, with lignin hindering enzyme access to the polysaccharides. This translates into slow hydrolysis and the need for a long retention time. The low protein content causes a high C/N ratio, which requires combining with nitrogen substrates, for example animal excreta. The material is light and bulky, so transport logistics are often costly, and contamination with soil and sand increases the abrasiveness for equipment.
How to read the spread of results
The dataset comprises few records, including samples from one study (labelled S-1 and S-2) and a result from another publication that does not give the temperature. The differences between samples arise from cane variety, plant age, region and growing conditions, the share of tops relative to leaves and the degree of soil contamination. Chopping also has an effect: finer particles increase availability, but change the behaviour of the material in the digester. With such a narrow base the results should be treated as indicative.
In biogas plant practice
In Polish conditions this substrate has no practical significance, but it is important for comparisons with other straws. In cane-growing countries the straw is sometimes collected as fuel, which is a competing use. If it goes to digestion, it requires chopping, nitrogen supplementation and consideration of pretreatment. Like other lignocellulosic materials, it works best as a component of a mix with a liquid substrate. Because the dataset contains few records and the spread between samples is significant, these results should not be transferred directly to other regions or varieties. For realistic plans to use such biomass, a BMP test carried out on material from the target source is needed, with a description of the chopping and inoculum conditions.
Methodology in brief
BMP is the amount of methane obtained from volatile solids (VS) in a batch test, given in m³ CH₄ per tonne of VS (numerically the same as NmL CH₄/g VS in the publications) and converted to normal conditions (0 °C, 101.325 kPa). The weighted mean gives each publication a total weight of 1, split equally between its results for the substrate — a paper testing twenty varieties does not outweigh a paper with a single sample. In inter-laboratory programmes the unit is the laboratory (total weight 1), and within it the weight of a test grows with the number of bottles (replicates). Results after pretreatment (e.g. thermal, chemical, enzymatic) are shown separately and are not included in the mean.
Solid lines are curves measured in the tests. Where a publication gives only the final result, we draw a first-order kinetic model, B(t) = B₀·(1 − e−kt): only the end point comes from the publication, and the shape of the curve serves purely as visualisation — do not read the production on a particular day from it. For this substrate k = 0.136 d−1 was assumed (median of rate constants k reported in the sources and/or fitted to the mean measured curves).
The statistics describe the spread of published results — a descriptive compilation, not a meta-analysis or a guarantee of plant yield.
Bibliography
- Janke, L.; Leite, A.; Nikolausz, M.; Schmidt, T.; Liebetrau, J.; Nelles, M.; Stinner, W. (2015). Biogas Production from Sugarcane Waste: Assessment on Kinetic Challenges for Process Designing. International Journal of Molecular Sciences 16(9), 20685–20703. DOI: 10.3390/ijms160920685 DOI
- López-Dávila, E.; Jiménez Hernández, J.; López González, L.M.; Barrera Cardoso, E.L.; Bravo Amarante, E.; Contreras Velázquez, L.M.; Romero-Romero, O. (2022). Biochemical methane potential of agro-wastes as a renewable source alternative for electrical energy production in Cuba. Ciencia & Tecnología Agropecuaria 23(1). DOI: 10.21930/rcta.vol23_num1_art:1890 DOI
All sources of the site: bibliography.
Other substrates in the group “Straws and crop residues”
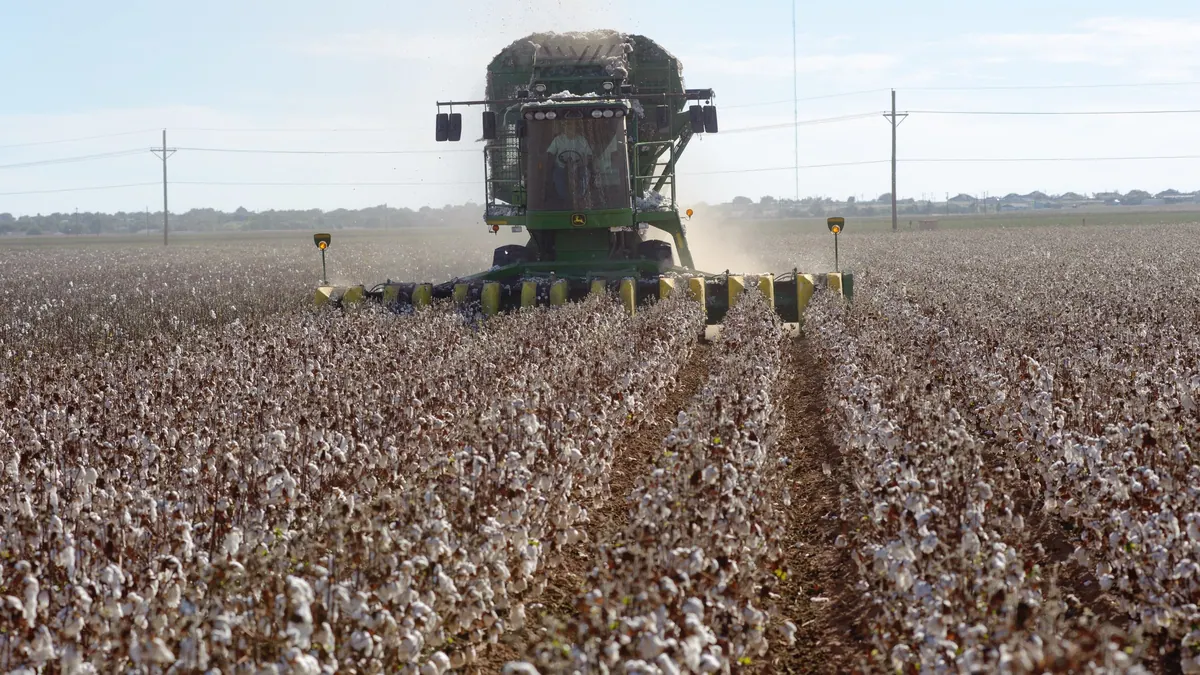
Cotton stalks — BMP: 2 studies, weighted mean 82 m³ CH₄/t VS
82 m³ CH₄/t VS weighted mean from 2 studies
≈51 %
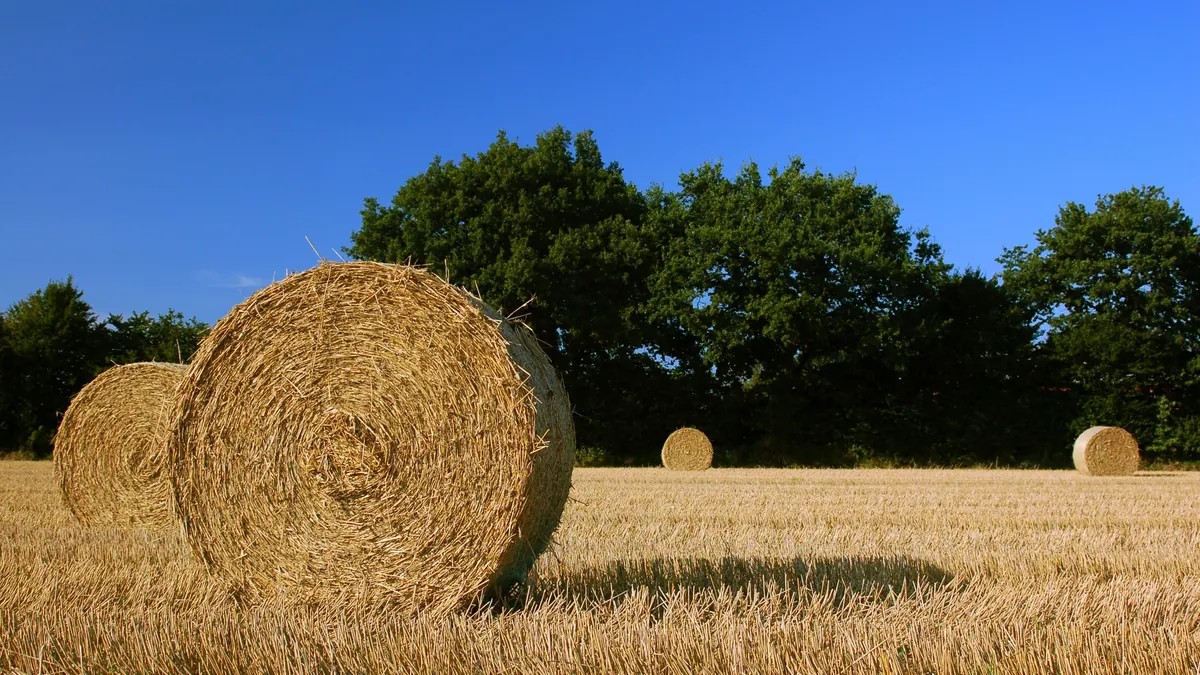
Cereal straw (unspecified) — BMP: 25 studies, weighted mean 268 m³ CH₄/t VS
268 m³ CH₄/t VS weighted mean from 25 studies
good — editorial rating for biogas plants≈51 %
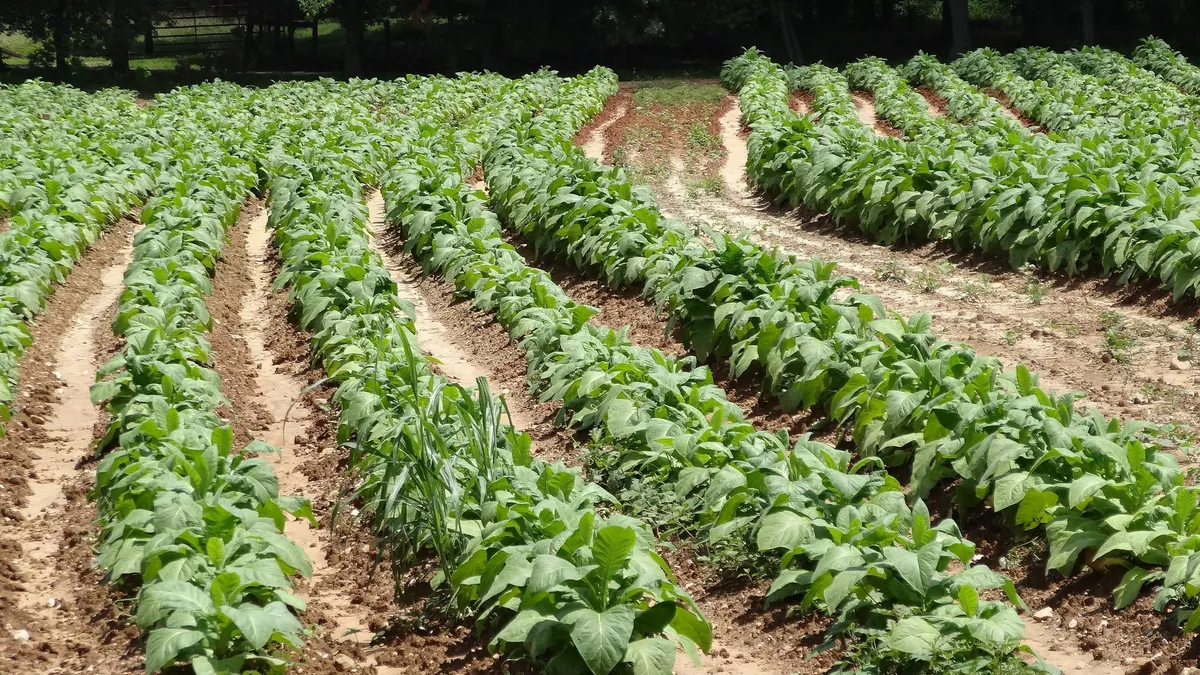
Tobacco stalks — BMP: 2 studies, weighted mean 139 m³ CH₄/t VS
139 m³ CH₄/t VS weighted mean from 2 studies
≈52 %
Sugarcane bagasse — BMP: 10 studies, weighted mean 205 m³ CH₄/t VS
205 m³ CH₄/t VS weighted mean from 10 studies
good — editorial rating for biogas plants≈51 %