

BMP testingWild, invasive and medicinal plantssingle study (5 samples)
Bermuda grass — BMP: 5 studies, weighted mean 202 m³ CH₄/t VS
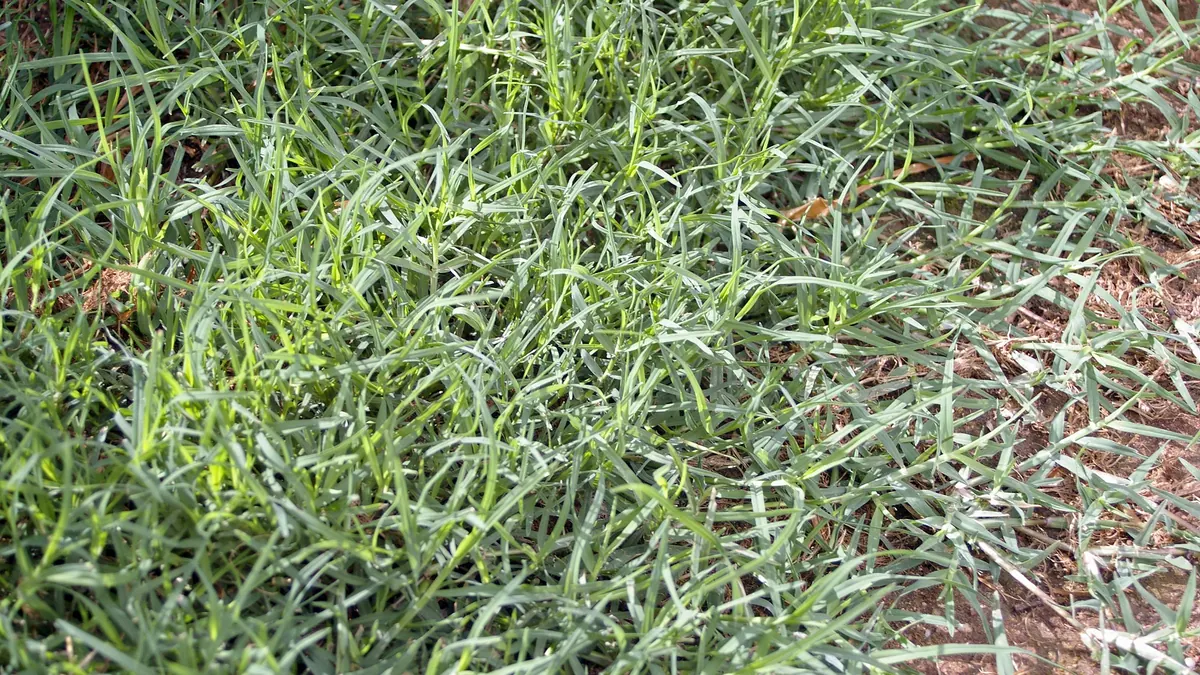
Bermuda grass (Cynodon dactylon, dhub grass) is a heat-loving stoloniferous grass, usually a weed; it was studied in different chopping fractions with a moderately variable result.
rating: goodCH₄ ≈ 52 % (estimate)
Photo Bidgee / Wikimedia Commons, licence CC BY-SA 3.0, source file; changes: cropping

- Weighted mean
- 202m³ CH₄/t VS
- Range
- 137–228m³ CH₄/t VS
- Records
- 5single study (5 samples)
- Publications
- 1source
- Temperatures
- 37 °Cof the test
Methane in biogas
Medium methane content · ≈ 5.2 kWh/m³ of biogas
estimate from the substrate type The collected studies contain no measurement. The interval follows from the approximate composition (carbohydrate-dominated (no protein or fat characteristics)) and the yields of compound groups according to FNR.
Rating for biogas plants
good — editorial rating for biogas plantsStable, usually accepted without a fee
Potential per tonne of fresh matter: high (60 m³ CH₄/t); no particular threats to stability. Handling costs: fibres, floating layer.
Why? Rating factors
Potential per tonne +2
- +2potential 60 m³ CH₄/t fresh matter (BMP 202 × DM 33.2 % × VS 89.3 %)
Process stability 0
- 0no factors
Handling and costs −0.5
- −0.5fibres, floating layer — shredding and intensive mixing
Total points: 1.5 · thresholds: ≥ 2.5 very good, ≥ 1 good, below — neutral; negative with cumulative process risk.
Add to the co-digestion calculator CSV data
BMP curves from 5 studies
Weighted mean Individual records
Dashed lines are a model curve (first-order kinetics, B(t) = B₀·(1 − e−kt)); the end point comes from the publication. All curves are model curves.
Cumulative methane production over the test [m³ CH₄/t VS]. The thick line is the weighted mean of all records (202); dots mark the end values given in the publications. Point at the chart to read values; click a legend item to hide or show a record.
Records and sources
Download CSV| Source | BMP m³ CH₄/t VS | Temperature | Sample | Curve |
|---|---|---|---|---|
| Sharma et al. (1988) · 1 DOI | 137 | 37 °C · mesophilic | Dhub grass or Bermuda grass · pretreatment: Material were first dried in the sun and then in an oven at 90oC | end point (model curve) |
| Sharma et al. (1988) · 2 DOI | 205 | 37 °C · mesophilic | Dhub grass or Bermuda grass · pretreatment: Material were first dried in the sun and then in an oven at 90oC | end point (model curve) |
| Sharma et al. (1988) · 3 DOI | 214 | 37 °C · mesophilic | Dhub grass or Bermuda grass · pretreatment: Material were first dried in the sun and then in an oven at 90oC | end point (model curve) |
| Sharma et al. (1988) · 4 DOI | 226 | 37 °C · mesophilic | Dhub grass or Bermuda grass · pretreatment: Material were first dried in the sun and then in an oven at 90oC | end point (model curve) |
| Sharma et al. (1988) · 5 DOI | 228 | 37 °C · mesophilic | Dhub grass or Bermuda grass · pretreatment: Material were first dried in the sun and then in an oven at 90oC | end point (model curve) |
| Weighted mean | 202 | arithmetic mean 202, SD 38 | ||
Typical composition
- Dry matter (DM)
- 33.2% (range 33.2–33.2)
- Volatile solids (VS)
- 89.3 % DM (range 89.3–89.3)
- C/N ratio
- 34
Median and range of the determinations reported in the publications behind this substrate's BMP records (read from: CROPGEN D4); dry matter: 1 determination, volatile solids: 1 determination. DM from a single determination – indicative value.
Sources: Sharma et al. (1988).
The composition of the raw material varies between batches — for plant calculations use an analysis of your own sample. The calculator inserts typical values automatically.
Process properties
Low confidence: the description is based on general characteristics of the substrate group, not on studies of this material. Treat it as a hint to be verified.
Advantages
- Methane potential in the database: weighted mean 202 m³ CH₄/t VS (median 214; range 137–228; 5 records from 1 sources).
Drawbacks and risks
- In the Sharma 1988 paper the result depended on particle size (an effect of size reduction, not of the plant).
- Mature grass contains a lot of fibre and lignin (review by Hendriks 2009).
Co-digestion — what to combine it with, what to watch out for
- combines well
Dosing
No dose data; treat like a typical fibrous grass in mixes with excrement.
Practical requirements
- Size reduction matters more than species (Sharma 1988)
Sources of the process data
- Weiland, P. (2010) Biogas production: current state and perspectives. Applied Microbiology and Biotechnology
- Sharma, S.K.; Mishra, I.; Sharma, M.; Saini, J. (1988) Effect of particle size on biogas generation from biomass residues. Biomass 17(4), 251–263
- Hendriks, A.T.W.M.; Zeeman, G. (2009) Pretreatments to enhance the digestibility of lignocellulosic biomass. Bioresource Technology
The co-digestion calculator will assess a specific mixture containing this substrate.
What it is and where it comes from
Bermuda grass (Cynodon dactylon), called dhub grass in India, is a heat-loving stoloniferous grass with a wide distribution in tropical and subtropical regions. It is used as turf and pasture, but is also a troublesome weed. In Poland it occurs to a limited extent, mainly in warmer regions, so it has no significance as a biogas feedstock. In the dataset it represents wild-growing grasses studied as biomass.
Properties relevant to digestion
The biomass consists mainly of cellulose and hemicellulose with a moderate share of lignin, which rises with age. The content of protein and soluble sugars is small compared with fertilised meadow grasses. The fibrous structure requires chopping, because the material is difficult to mix and can form layers. The risk of acidification is small. The C/N ratio rises during the growing season, so combining with slurry improves the balance. Green forage from verges and wasteland may contain contaminants.
How to read the spread of results
The dataset contains several records from one study in which the grass was examined in different chopping fractions (mesophilic, 37 °C). The overall spread is moderate. This shows the effect of particle size: finer fractions usually release gas faster, and the final result also depends on the duration of the test. In addition, plant age, harvest date, moisture, inoculum and the way the sample was prepared are of importance.
In biogas plant practice
Bermuda grass can supplement the feed in regions where it occurs in abundance, as biomass from mowing. Harvest at a younger stage gives better digestibility. Chopping and ensiling ease storage. Biomass from green areas may be classified as green waste, which affects the legal requirements. For Poland the data are of comparative character for other wild-growing grasses.
In practice the limiting factor is the dispersal of the biomass: the grass grows among crops and on verges, and harvesting it in industrial quantities is difficult. It is therefore much more realistic to use green wastes from the mowing of grounds than to harvest this plant deliberately.
The risk of carrying seeds and stolons along with the biomass and the digestate is also not insignificant, because the grass roots easily. This requires considered management of the digestate if the plant is a troublesome weed in the fields.
Methodology in brief
BMP is the amount of methane obtained from volatile solids (VS) in a batch test, given in m³ CH₄ per tonne of VS (numerically the same as NmL CH₄/g VS in the publications) and converted to normal conditions (0 °C, 101.325 kPa). The weighted mean gives each publication a total weight of 1, split equally between its results for the substrate — a paper testing twenty varieties does not outweigh a paper with a single sample. In inter-laboratory programmes the unit is the laboratory (total weight 1), and within it the weight of a test grows with the number of bottles (replicates). Results after pretreatment (e.g. thermal, chemical, enzymatic) are shown separately and are not included in the mean.
Solid lines are curves measured in the tests. Where a publication gives only the final result, we draw a first-order kinetic model, B(t) = B₀·(1 − e−kt): only the end point comes from the publication, and the shape of the curve serves purely as visualisation — do not read the production on a particular day from it. For this substrate k = 0.134 d−1 was assumed (median of rate constants k reported in the sources and/or fitted to the mean measured curves).
The statistics describe the spread of published results — a descriptive compilation, not a meta-analysis or a guarantee of plant yield.
Bibliography
- Sharma, S.K.; Mishra, I.; Sharma, M.; Saini, J. (1988). Effect of particle size on biogas generation from biomass residues. Biomass 17(4), 251–263. DOI: 10.1016/0144-4565(88)90107-2 DOI
All sources of the site: bibliography.
Other substrates in the group “Wild, invasive and medicinal plants”

Mexican sunflower (Tithonia diversifolia) — BMP: 2 studies, weighted mean 210 m³ CH₄/t VS
210 m³ CH₄/t VS weighted mean from 2 studies
≈55 %
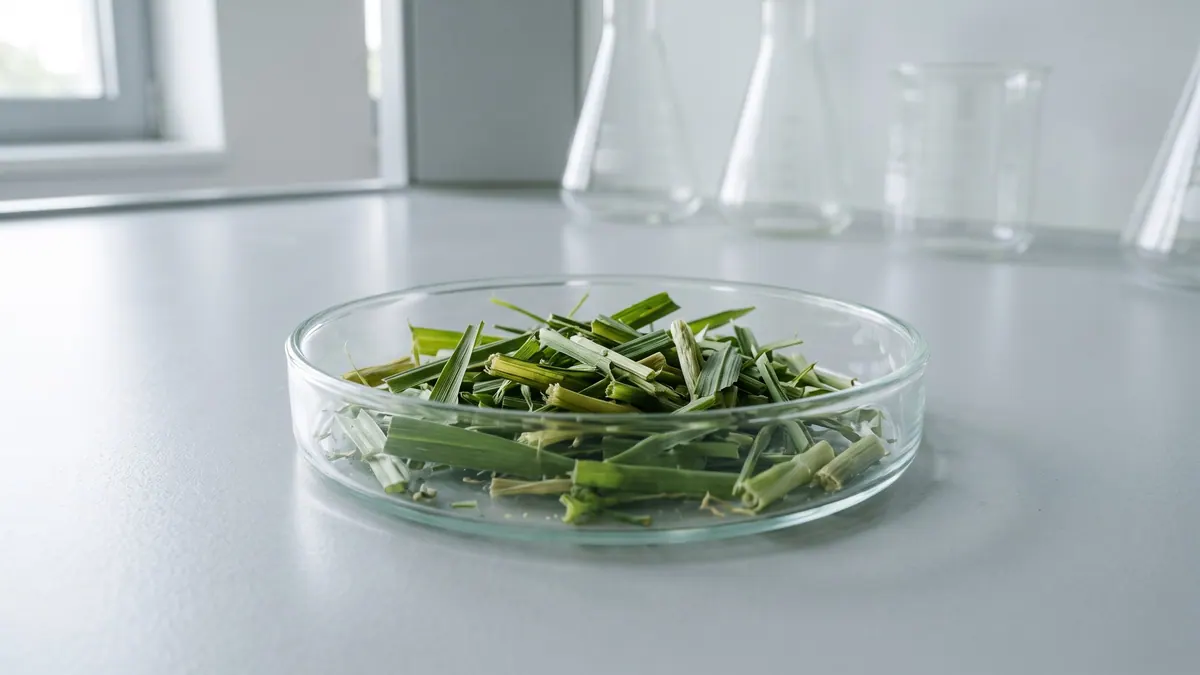
Aleman grass — BMP: 2 studies, weighted mean 296 m³ CH₄/t VS
296 m³ CH₄/t VS weighted mean from 2 studies
≈52 %
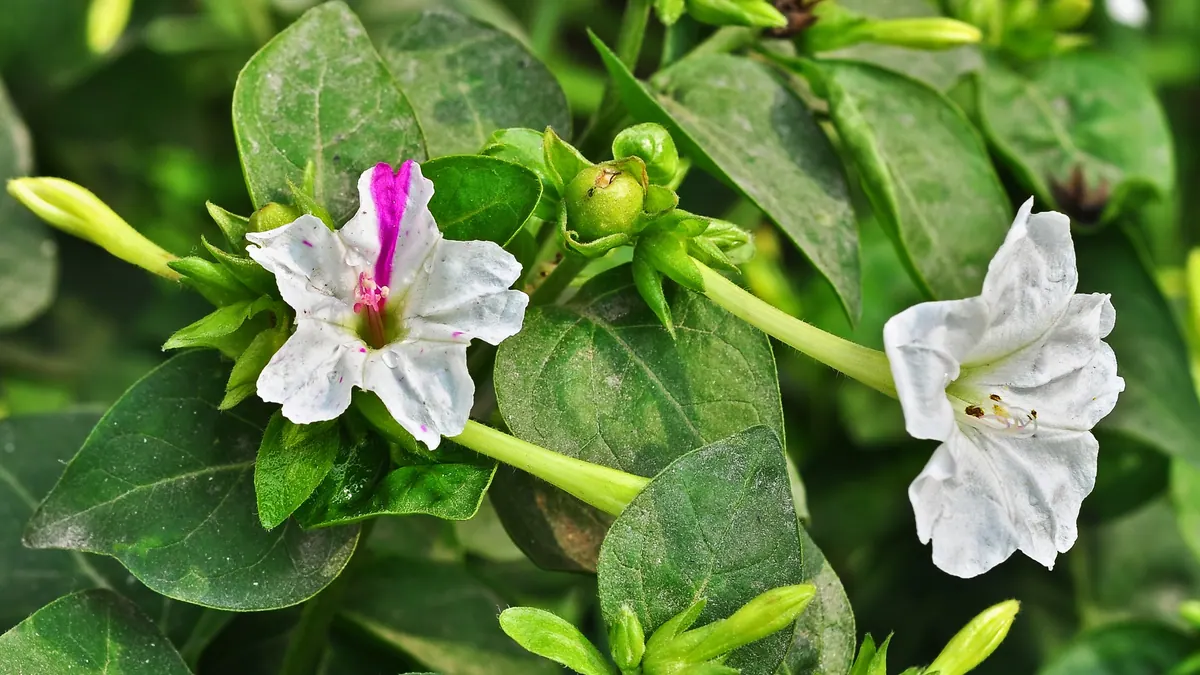
Four o'clock flower leaves — BMP: 5 studies, weighted mean 325 m³ CH₄/t VS
325 m³ CH₄/t VS weighted mean from 5 studies
good — editorial rating for biogas plants≈52 %
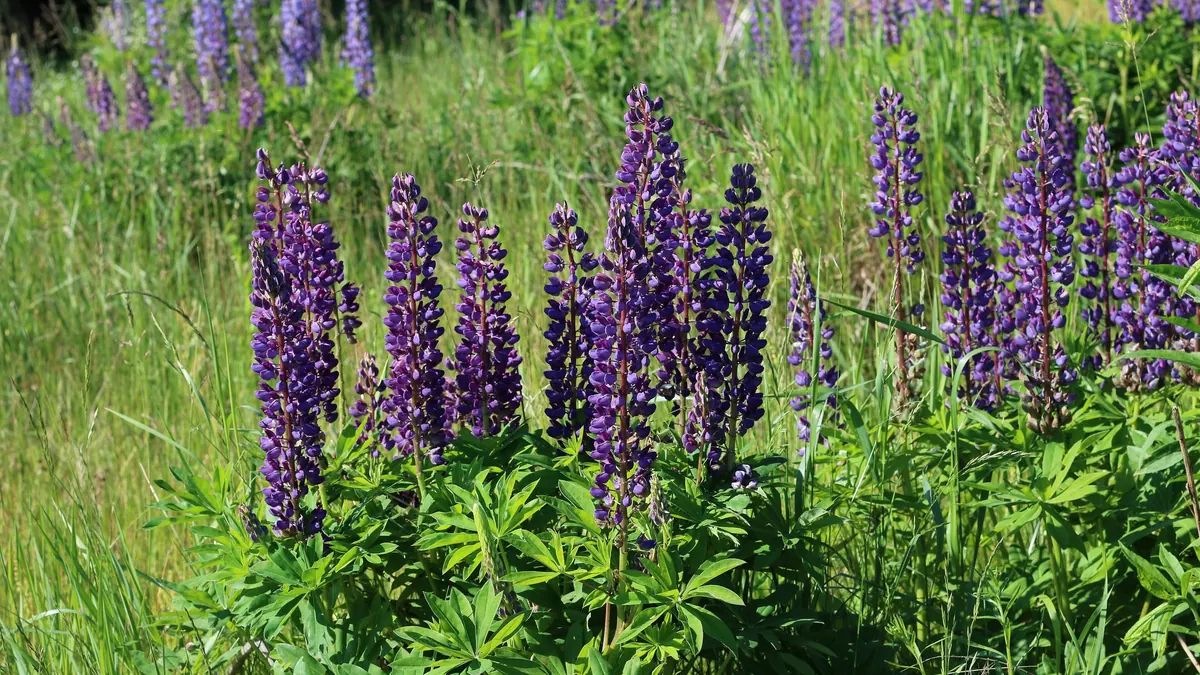
Bigleaf lupine — BMP: 2 studies, weighted mean 335 m³ CH₄/t VS
335 m³ CH₄/t VS weighted mean from 2 studies
≈52 %