

BMP testingGrain, bran, feed and foddersingle study (10 samples)
Bird feed (seed mix) — BMP: 10 studies, weighted mean 387 m³ CH₄/t VS
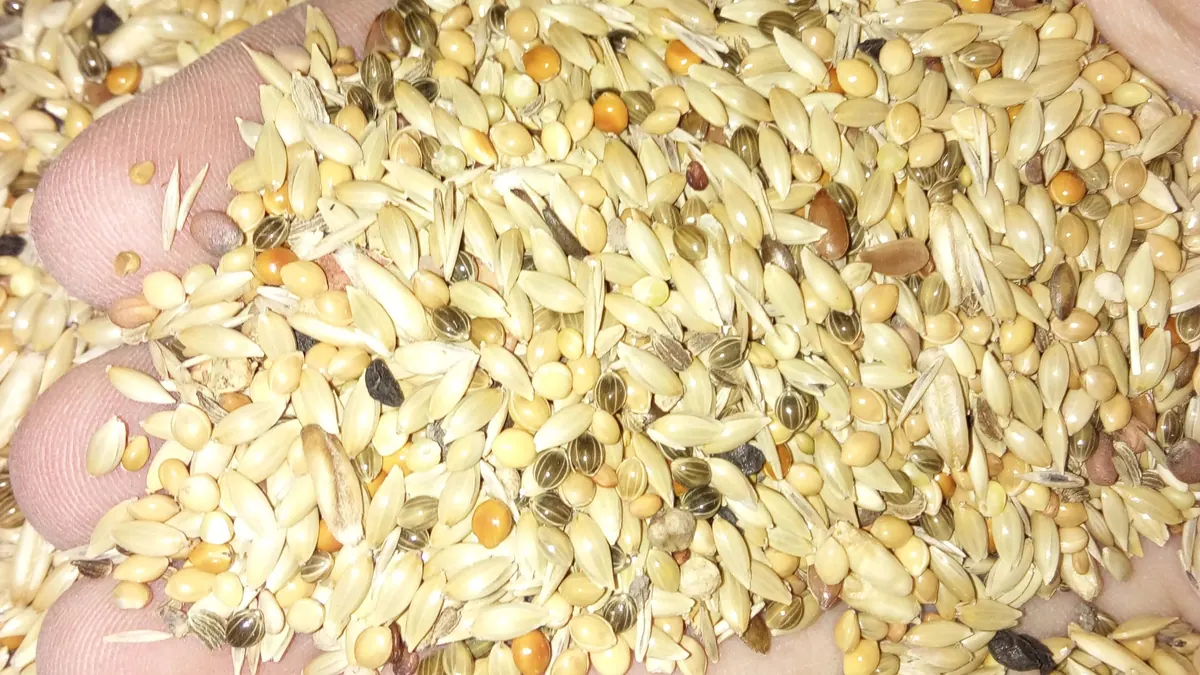
Bird feed is a mixture of grains and seeds, used in the interlaboratory BMP programme as a test material. The compilation contains several records with measured curves.
Photo Soldier of Wasteland / Wikimedia Commons, licence CC BY-SA 4.0, source file; changes: cropping

- Weighted mean
- 387m³ CH₄/t VS
- Range
- 342–427m³ CH₄/t VS
- Records
- 10single study (10 samples)
- Publications
- 1source
- Temperatures
- —of the test
Methane in biogas
Medium methane content · ≈ 5.2 kWh/m³ of biogas
estimate from the substrate type The collected studies contain no measurement. The interval follows from the approximate composition (carbohydrate-dominated (no protein or fat characteristics)) and the yields of compound groups according to FNR.
Rating for biogas plants
not rated — editorial rating for biogas plants
Not rated: no dry matter or volatile solids in the data. We calculate the rating when the dry matter and volatile solids of the material are known.
Add to the co-digestion calculator CSV data
BMP curves from 10 studies
Weighted mean Individual records
All curves are measurements from the publications.
Cumulative methane production over the test [m³ CH₄/t VS]. The thick line is the weighted mean of all records (387); dots mark the end values given in the publications. Point at the chart to read values; click a legend item to hide or show a record.
Records and sources
Download CSV| Source | BMP m³ CH₄/t VS | Temperature | Sample | Curve |
|---|---|---|---|---|
| Hafner et al. (2026) · lab. E18 · 1 DOI | 342 | — · mesophilic | Bird feed | measurement (31 pts) |
| Hafner et al. (2026) · lab. E18 · 2 DOI | 346 | — · mesophilic | Bird feed | measurement (31 pts) |
| Hafner et al. (2026) · lab. E02 DOI | 362 | — · mesophilic | Bird feed | measurement (31 pts) |
| Hafner et al. (2026) · lab. E27 DOI | 373 | — · mesophilic | Bird feed | measurement (31 pts) |
| Hafner et al. (2026) · lab. E07 DOI | 373 | — · mesophilic | Bird feed | measurement (31 pts) |
| Hafner et al. (2026) · lab. R05 DOI | 382 | — · mesophilic | Bird feed | measurement (31 pts) |
| Hafner et al. (2026) · lab. R06 DOI | 399 | — · mesophilic | Bird feed | measurement (31 pts) |
| Hafner et al. (2026) · lab. R01 DOI | 411 | — · mesophilic | Bird feed | measurement (31 pts) |
| Hafner et al. (2026) · lab. E08 DOI | 417 | — · mesophilic | Bird feed | measurement (31 pts) |
| Hafner et al. (2026) · lab. R03 DOI | 427 | — · mesophilic | Bird feed | measurement (31 pts) |
| Weighted mean | 387 | arithmetic mean 383, SD 30 | ||
Process properties
Low confidence: the description is based on general characteristics of the substrate group, not on studies of this material. Treat it as a hint to be verified.
Advantages
- Methane potential in the database: weighted mean 387 m³ CH₄/t VS (median 377; range 342–427; 10 records from 1 sources).
- Grain mixes – repeatable commercial products; described in the interlaboratory study Hafner 2026.
- The data come from an interlaboratory BMP study involving 31 laboratories (Hafner 2026).
Drawbacks and risks
- Spread of results in the database: standard deviation 30 at a mean of 383 m³ CH₄/t VS (10 records from 1 sources).
Co-digestion — what to combine it with, what to watch out for
- combines well
group: Animal excreta (slurry, manure, poultry litter)
Co-digestion with excreta (slurry/solid manure) is the standard arrangement for plant biomass: they supply alkalinity and microflora.[1][2]
Dosing
No source-based dose limits.
Practical requirements
- Shred: shredding increases the surface available for degradation and speeds it up, but does not necessarily raise the final gas yield (FNR 2010, Ch. 3 “Triturado”).
Sources of the process data
- Hafner, S.D.; Leca, E.; Sambusiti, C.; Astals, S.; Azam, O.; Koch, K.; Liu, J.; Møller, H.B.; Nistor, M.; Olaya-Rincon, M.; Peyrelasse, C.; Ward, A.J.; Zennaro, B.; Monlau, F. (2026) Reliable biochemical methane potential testing: insights and recommendations from global interlaboratory study. Bioresource Technology 446, 134136
- Weiland, P. (2010) Biogas production: current state and perspectives. Applied Microbiology and Biotechnology
- FNR (2010). Guía sobre el Biogás – Desde la producción hasta el uso (hiszp. wydanie „Leitfaden Biogas”, GIZ 2013)
The co-digestion calculator will assess a specific mixture containing this substrate.
What it is and where it comes from
Bird feed (seed mix) is a commercial mixture of cereal grains, millet, oilseeds and other components. It is not a biogas plant waste, but a material chosen for the interlaboratory programme as a sample available in shops and relatively uniform, of known general composition. The compilation contains several records from the 2026 programme, in which many laboratories tested the same sample, with measured curves.
Properties relevant to digestion
The mixture contains starch from cereals, protein and lipids from oilseeds, as well as husks with a higher lignin content. Starch and protein degrade quickly, fat gives a high energy density, and the husks slow part of the process. Undamaged grains are hard, so size reduction before the test is of great importance. At higher doses overloading of the inoculum and acidification are possible. It is not a typical biogas plant substrate, but it illustrates well the behaviour of a starch-and-fat material.
How to read the spread of results
The records concern a single sample tested by different laboratories, so the spread results mainly from differing methodology: inoculum, substrate-to-inoculum ratio, size reduction, the gas measuring device and test length. The programme adopted the result on day 30 of the test. Differences in the way the sample is size-reduced can have a large effect, because particles of different sizes degrade at different rates. Some laboratories carried out more than one test, which shows up as replicates from the same centre.
In biogas plant practice
Bird feed is not a commercial substrate. The value for practice lies in the fact that the measured curves make it possible to compare your own BMP results with data from many laboratories for a material of a similar nature. The range of results from the programme shows what variability can be expected even for the same material. When purchasing a testing service it is therefore worth asking the laboratory about its participation in comparative studies and its repeatability. For the quality of your own BMP results it is also useful to compare not only the final value but the whole course of the curve: the rate at which gas production builds up often reveals differences in sample preparation and inoculum quality better than the result after 30 days alone.
Methodology in brief
BMP is the amount of methane obtained from volatile solids (VS) in a batch test, given in m³ CH₄ per tonne of VS (numerically the same as NmL CH₄/g VS in the publications) and converted to normal conditions (0 °C, 101.325 kPa). The weighted mean gives each publication a total weight of 1, split equally between its results for the substrate — a paper testing twenty varieties does not outweigh a paper with a single sample. In inter-laboratory programmes the unit is the laboratory (total weight 1), and within it the weight of a test grows with the number of bottles (replicates). Results after pretreatment (e.g. thermal, chemical, enzymatic) are shown separately and are not included in the mean.
Solid lines are curves measured in the tests. Where a publication gives only the final result, we draw a first-order kinetic model, B(t) = B₀·(1 − e−kt): only the end point comes from the publication, and the shape of the curve serves purely as visualisation — do not read the production on a particular day from it.
The statistics describe the spread of published results — a descriptive compilation, not a meta-analysis or a guarantee of plant yield.
Bibliography
- Hafner, S.D.; Leca, E.; Sambusiti, C.; Astals, S.; Azam, O.; Koch, K.; Liu, J.; Møller, H.B.; Nistor, M.; Olaya-Rincon, M.; Peyrelasse, C.; Ward, A.J.; Zennaro, B.; Monlau, F. (2026). Reliable biochemical methane potential testing: insights and recommendations from global interlaboratory study. Bioresource Technology 446, 134136. DOI: 10.1016/j.biortech.2026.134136 DOI
All sources of the site: bibliography.
Other substrates in the group “Grain, bran, feed and fodder”
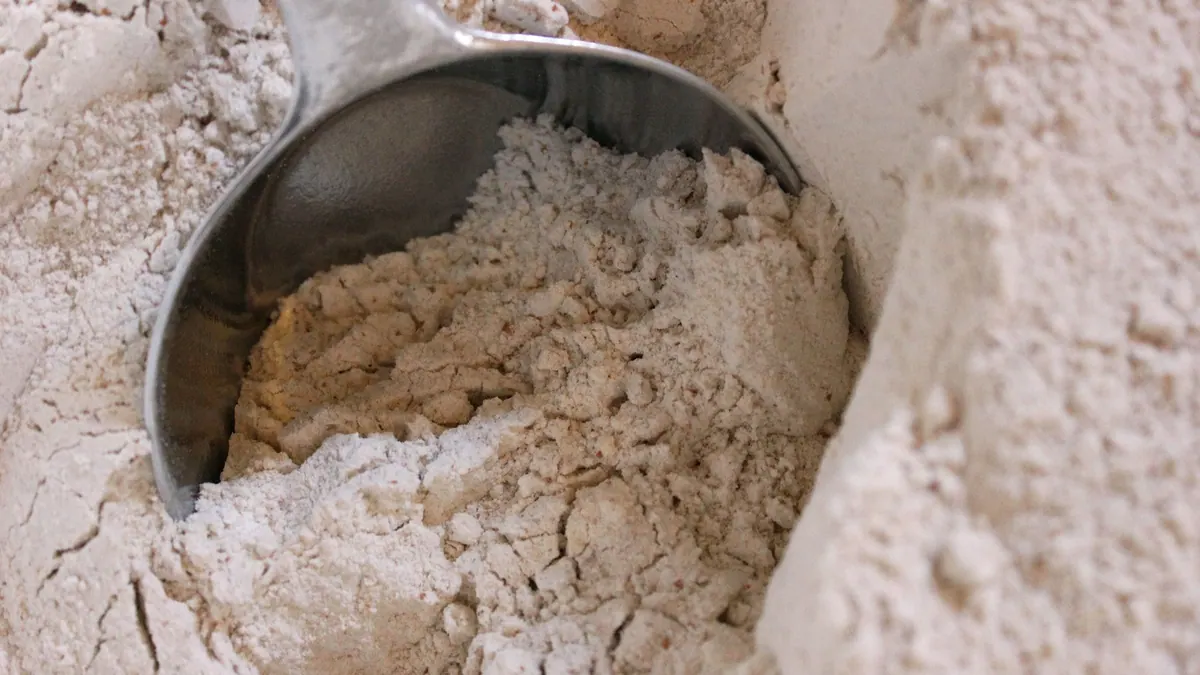
Cereal grain and flour — BMP: 4 studies, weighted mean 350 m³ CH₄/t VS
350 m³ CH₄/t VS weighted mean from 4 studies
very good — editorial rating for biogas plants≈52 %
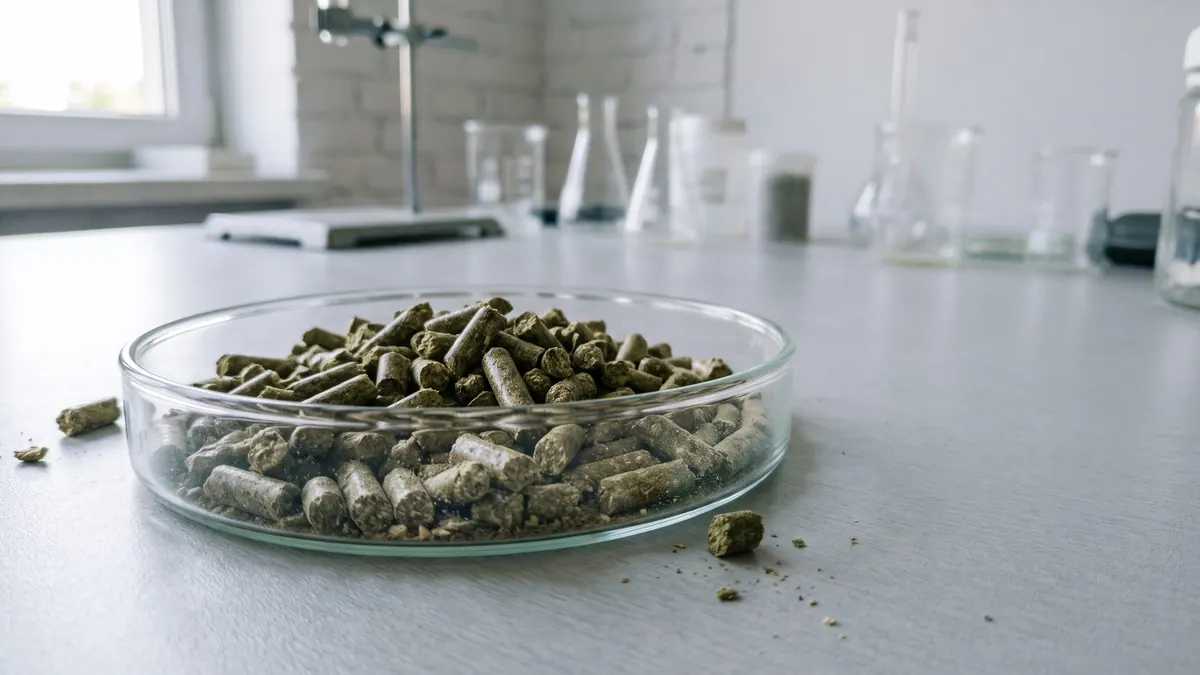
Rabbit and rodent feed pellets — BMP: 12 studies, weighted mean 330 m³ CH₄/t VS
330 m³ CH₄/t VS weighted mean from 12 studies
≈52 %
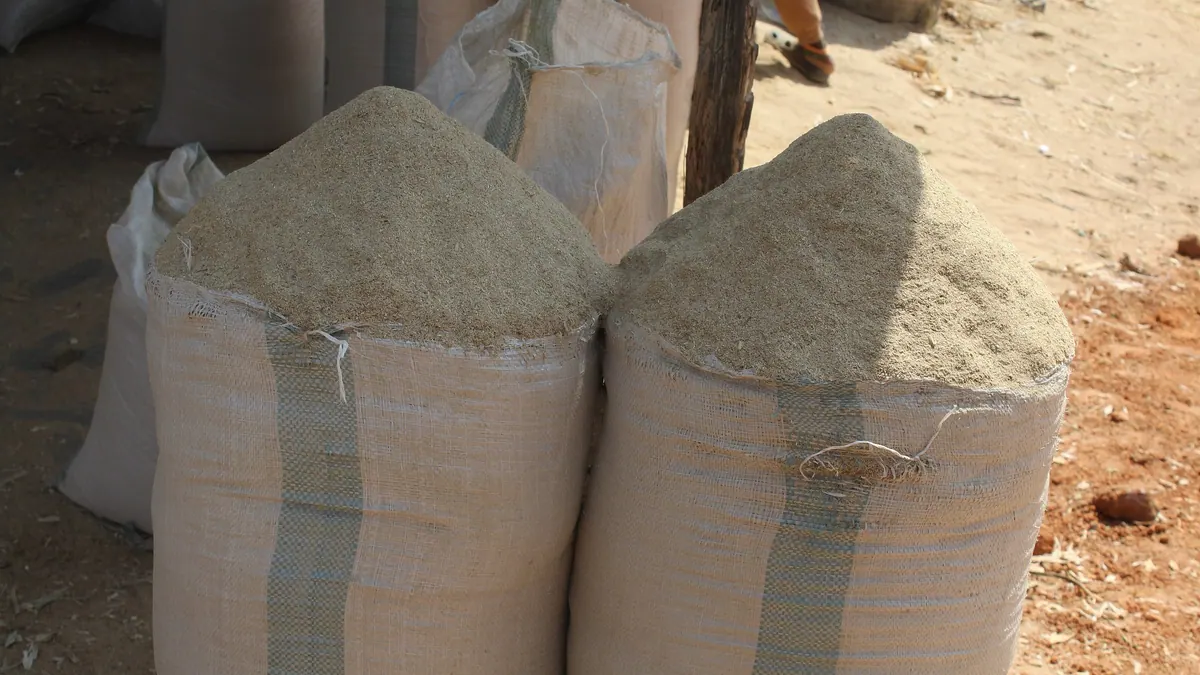
Cereal residues (screenings, dust, silo losses) — BMP: 10 studies, weighted mean 324 m³ CH₄/t VS
324 m³ CH₄/t VS weighted mean from 10 studies
good — editorial rating for biogas plants≈53 %
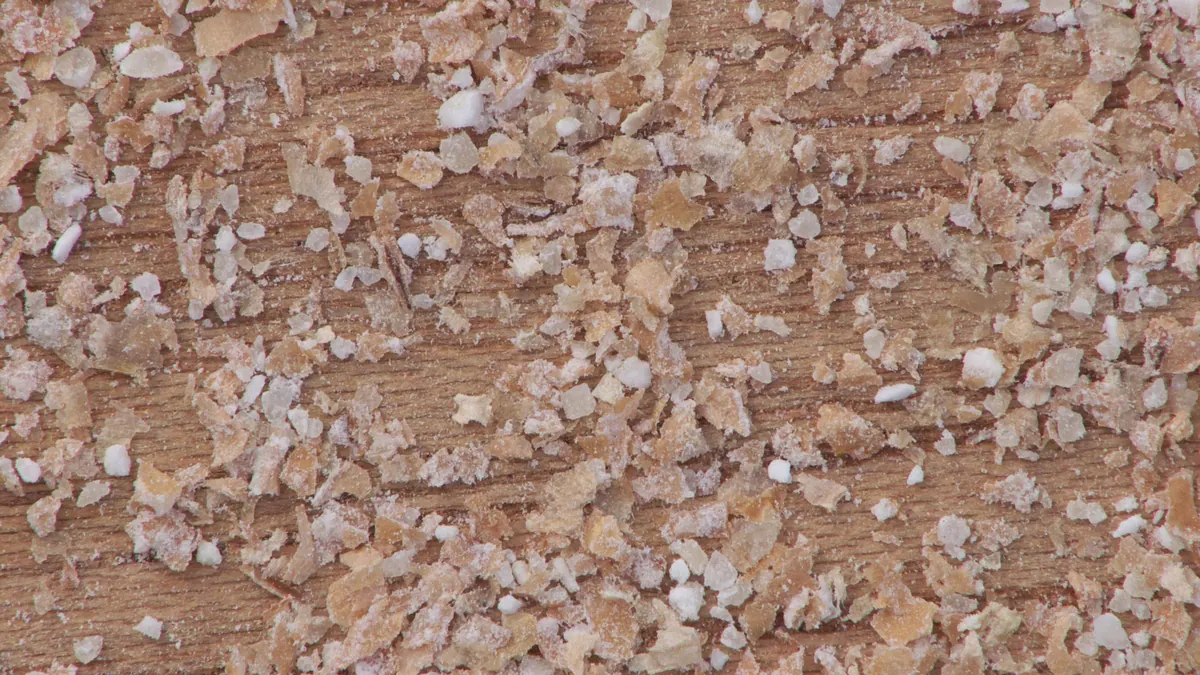
Wheat bran — BMP: 2 studies, weighted mean 330 m³ CH₄/t VS
330 m³ CH₄/t VS weighted mean from 2 studies
very good — editorial rating for biogas plants≈52 %