

BMP testingGrain, bran, feed and fodder
Cereal residues (screenings, dust, silo losses) — BMP: 10 studies, weighted mean 324 m³ CH₄/t VS
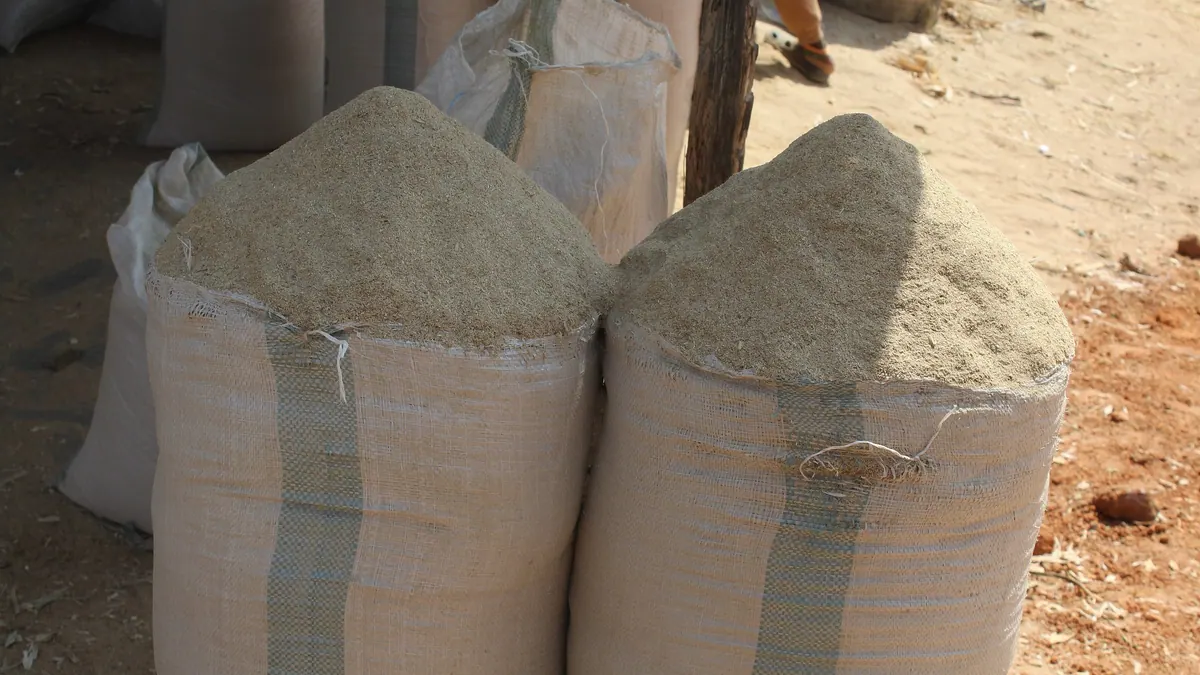
Cereal waste comprises screenings, dust, siftings and silo losses arising in grain handling. The composition is variable, and the starchy part gives a rapidly fermenting but heterogeneous substrate.
rating: goodCH₄ ≈ 53 % (estimate)
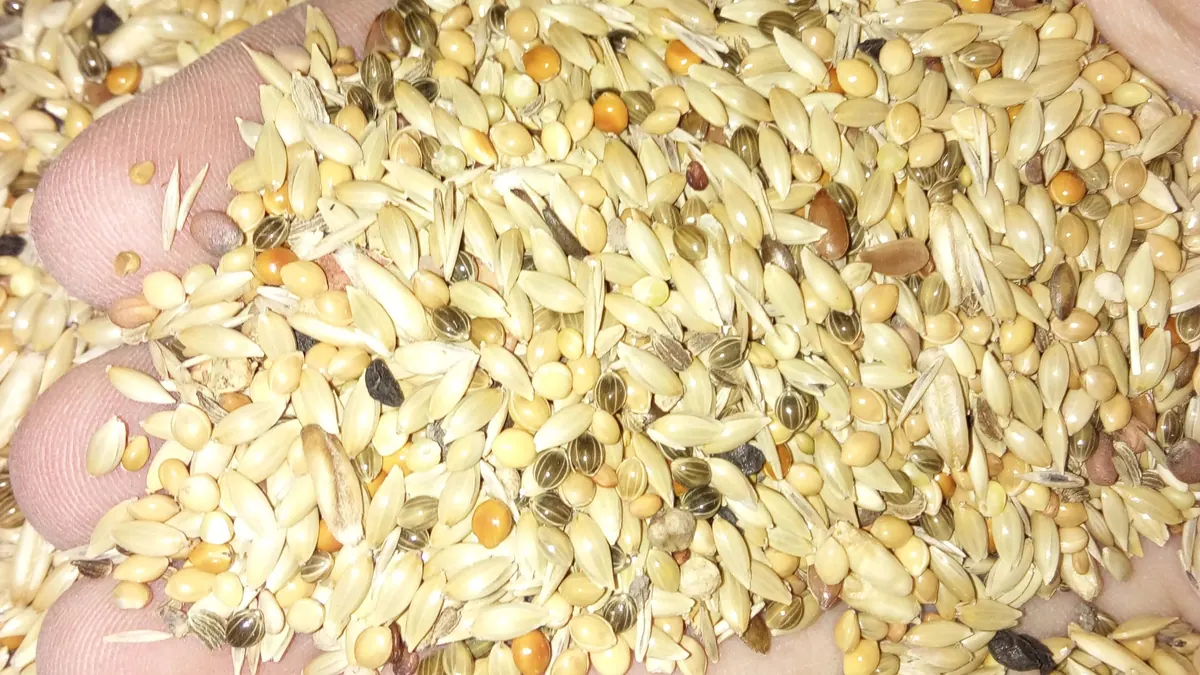
Photo Friday musa / Wikimedia Commons, licence CC BY-SA 4.0, source file; changes: cropping

- Weighted mean
- 324m³ CH₄/t VS
- Range
- 250–402m³ CH₄/t VS
- Records
- 10studies
- Publications
- 5sources
- Temperatures
- 36 °C, 38 °Cof the test
Methane in biogas
Medium methane content · ≈ 5.2 kWh/m³ of biogas
estimate from the substrate type The collected studies contain no measurement. The interval follows from the approximate composition (protein from total nitrogen (N 1.5 % DM × 6.25)) and the yields of compound groups according to FNR.
Rating for biogas plants
good — editorial rating for biogas plantsStable, usually accepted without a fee
Potential per tonne of fresh matter: very high (242 m³ CH₄/t); process risk: acidification. Handling costs: physical contaminants (packaging, plastics).
Why? Rating factors
Potential per tonne +3
- +3potential 242 m³ CH₄/t fresh matter (BMP 324 × DM 79.8 % × VS 93.5 %)
Process stability −0.5
- −0.5acidification: rapid degradation / acidic pH, risk of VFA accumulation, needs buffering
Handling and costs −1
- −1physical contaminants (packaging, plastics) — depackaging and separation
Total points: 1.5 · thresholds: ≥ 2.5 very good, ≥ 1 good, below — neutral; negative with cumulative process risk.
Add to the co-digestion calculator CSV data
BMP curves from 10 studies
Weighted mean Individual records
Dashed lines are a model curve (first-order kinetics, B(t) = B₀·(1 − e−kt)); the end point comes from the publication. All curves are model curves.
Cumulative methane production over the test [m³ CH₄/t VS]. The thick line is the weighted mean of all records (324); dots mark the end values given in the publications. Point at the chart to read values; click a legend item to hide or show a record.
Records and sources
Download CSV| Source | BMP m³ CH₄/t VS | Temperature | Sample | Curve |
|---|---|---|---|---|
| Dubrovskis et al. (2018) DOI | 376 | 38 °C · mesophilic | Grain drying residue (mono-fermentation) | end point (model curve) |
| Dubrovskis i Plume (2017) DOI | 268 | 38 °C · mesophilic | Grain processing residues (IN+GR, no additives) | end point (model curve) |
| Dubrovskis et al. (2019) DOI | 402 | 38 °C · mesophilic | Dry grain sweeps | end point (model curve) |
| Lallement et al. (2023) · 1 DOI | 250 | 38 °C · mesophilic | cereal residue | end point (model curve) |
| Lallement et al. (2023) · 2 DOI | 286 | 38 °C · mesophilic | cereals mix | end point (model curve) |
| Lallement et al. (2023) · 3 DOI | 300 | 38 °C · mesophilic | cereal dust | end point (model curve) |
| Lallement et al. (2023) · 4 DOI | 313 | 38 °C · mesophilic | cereals mix | end point (model curve) |
| Lallement et al. (2023) · 5 DOI | 320 | 38 °C · mesophilic | silo´s lose | end point (model curve) |
| Lallement et al. (2023) · 6 DOI | 328 | 38 °C · mesophilic | cereal mix | end point (model curve) |
| Luna-delRisco et al. (2011) | 274 | 36 °C · mesophilic | grain mill - aspiration dust | end point (model curve) |
| Weighted mean | 324 | arithmetic mean 312, SD 48 | ||
Typical composition
- Dry matter (DM)
- 79.8% (range 72–89.4)
- Volatile solids (VS)
- 93.5 % DM (range 90–96)
- Nitrogen
- 1.5 % DM
- C/N ratio
- 23.3
Median and range of the determinations reported in the publications behind this substrate's BMP records (read from: MY-D); dry matter: 7 determinations, volatile solids: 4 determinations. C/N was calculated as the ratio of C and N content (% DM) from the same source.
Sources: Lallement et al. (2023); Luna-delRisco et al. (2011).
The composition of the raw material varies between batches — for plant calculations use an analysis of your own sample. The calculator inserts typical values automatically.
Process properties
Advantages
- Methane potential in the database: weighted mean 324 m³ CH₄/t VS (median 307; range 250–402; 10 records from 5 sources).
Drawbacks and risks
- Readily degradable starch may acidify the system without a buffer (Chen 2008).
- Mixtures of cereal waste with molasses and birch leaves were tested only at laboratory scale (Dubrovskis 2019).
Co-digestion — what to combine it with, what to watch out for
- combines well
substrates: high alkalinity (buffer) — e.g. Cattle manure, Pig slurry, Cattle slurry, Duck slurry, Rumen and digestive tract content
Dosing
No source-based dose limits; Dubrovskis 2019 tested molasses with cereal waste and birch leaves.
Introduce gradually, starting with a small dose and monitoring the process (e.g. FOS/TAC, pH, gas composition).
Practical requirements
- Remove foreign contaminants before dosing: material from biowaste may contain interfering substances, and the co-substrate should be free of them (FNR 2010, Ch. 3).
Sources of the process data
- Chen, Y.; Cheng, J.J.; Creamer, K.S. (2008) Inhibition of anaerobic digestion process: A review. Bioresource Technology
- Weiland, P. (2010) Biogas production: current state and perspectives. Applied Microbiology and Biotechnology
- Dubrovskis, V.; Plume, I.; Straume, I. (2018) Co-fermentation of carrots, grain residues and potato chips. Engineering for Rural Development
- Dubrovskis, V.; Plume, I. (2017) Enzymatic and catalystic enchancement of methane production from corn silage and grain residues. Engineering for Rural Development
- Dubrovskis, V.; Plume, I.; Straume, I. (2019) Co-digestion of molasses with dry grain sweeps and birch leaves. Engineering for Rural Development
- Lallement, A.; Peyrelasse, C.; Lagnet, C.; Barakat, A.; Schraauwers, B.; Maunas, S.; Monlau, F. (2023) A Detailed Database of the Chemical Properties and Methane Potential of Biomasses Covering a Large Range of Common Agricultural Biogas Plant Feedstocks. Waste 1(1), 195–227
- Luna-delRisco, M.; Normak, A.; Orupõld, K. (2011) Biochemical methane potential of different organic wastes and energy crops from Estonia. Agronomy Research 9(1–2), 331–342
- FNR (2010). Guía sobre el Biogás – Desde la producción hasta el uso (hiszp. wydanie „Leitfaden Biogas”, GIZ 2013)
The co-digestion calculator will assess a specific mixture containing this substrate.
What it is and where it comes from
Cereal waste arises during the cleaning, drying, storage and transport of grain, as well as in mills and feed plants. It includes screenings (small, underdeveloped grain), siftings, grain dust, elevator dust and silo losses, that is, spoiled or damp grain. The compilation contains several records from several studies, most of them from one publication: cereal residues, cereal mixtures, dust, silo losses, waste from a grain dryer, screenings and aspiration dust from a mill, at 36 to 38 °C.
Properties relevant to digestion
The composition depends on the type of waste. Screenings and cereal mixtures are rich in starch and protein and are therefore readily digestible. Dust contains a lot of chaff and mineral impurities, and silo losses may be mouldy. Starch is hydrolysed rapidly, which at a high dose can lead to rapid acidification. Dry material has to be wetted or mixed with a liquid substrate. Spoiled batches may contain mycotoxins, which end up in the digestate, which matters for its later application to fields.
How to read the spread of results
The records cover different types of waste, such as cereal mixtures, dust, residues and silo losses, so their variability reflects differences in the material. Further influences are the cereal species, the degree of spoilage, the share of chaff and impurities, the size reduction and the test conditions. Most records come from a single publication, so they do not describe variability between suppliers or seasons. Real material from a specific elevator may differ considerably.
In biogas plant practice
Cereal waste can be a cheap supplement to the mix, especially in regions with a high concentration of elevators and mills. It should be assessed whether the material is heavily mouldy and whether it contains foreign bodies. Before feeding it is worth reducing its particle size and adding it gradually. The supplier should provide information on the origin of the batch and the storage conditions. A BMP test makes it possible to select the dose, and digestate analysis ensures quality control of the fertiliser. It is advisable to write quality requirements into the supplier contract: the maximum share of foreign impurities, moisture and the absence of signs of mould. This avoids a situation in which a low-quality batch impairs digester operation and digestate quality.
Methodology in brief
BMP is the amount of methane obtained from volatile solids (VS) in a batch test, given in m³ CH₄ per tonne of VS (numerically the same as NmL CH₄/g VS in the publications) and converted to normal conditions (0 °C, 101.325 kPa). The weighted mean gives each publication a total weight of 1, split equally between its results for the substrate — a paper testing twenty varieties does not outweigh a paper with a single sample. In inter-laboratory programmes the unit is the laboratory (total weight 1), and within it the weight of a test grows with the number of bottles (replicates). Results after pretreatment (e.g. thermal, chemical, enzymatic) are shown separately and are not included in the mean.
Solid lines are curves measured in the tests. Where a publication gives only the final result, we draw a first-order kinetic model, B(t) = B₀·(1 − e−kt): only the end point comes from the publication, and the shape of the curve serves purely as visualisation — do not read the production on a particular day from it. For this substrate k = 0.257 d−1 was assumed (median of rate constants k reported in the sources and/or fitted to the mean measured curves).
The statistics describe the spread of published results — a descriptive compilation, not a meta-analysis or a guarantee of plant yield.
Bibliography
- Dubrovskis, V.; Plume, I.; Straume, I. (2018). Co-fermentation of carrots, grain residues and potato chips. Engineering for Rural Development. DOI: 10.22616/erdev2018.17.n415 DOI
- Dubrovskis, V.; Plume, I. (2017). Enzymatic and catalystic enchancement of methane production from corn silage and grain residues. Engineering for Rural Development. DOI: 10.22616/erdev2017.16.n088 DOI
- Dubrovskis, V.; Plume, I.; Straume, I. (2019). Co-digestion of molasses with dry grain sweeps and birch leaves. Engineering for Rural Development. DOI: 10.22616/erdev2019.18.n114 DOI
- Lallement, A.; Peyrelasse, C.; Lagnet, C.; Barakat, A.; Schraauwers, B.; Maunas, S.; Monlau, F. (2023). A Detailed Database of the Chemical Properties and Methane Potential of Biomasses Covering a Large Range of Common Agricultural Biogas Plant Feedstocks. Waste 1(1), 195–227. DOI: 10.3390/waste1010014 DOI
- Luna-delRisco, M.; Normak, A.; Orupõld, K. (2011). Biochemical methane potential of different organic wastes and energy crops from Estonia. Agronomy Research 9(1–2), 331–342. https://www.semanticscholar.org/paper/25cf2d7bba4758136830a9a02caf3ecd997173bb source
All sources of the site: bibliography.
Other substrates in the group “Grain, bran, feed and fodder”
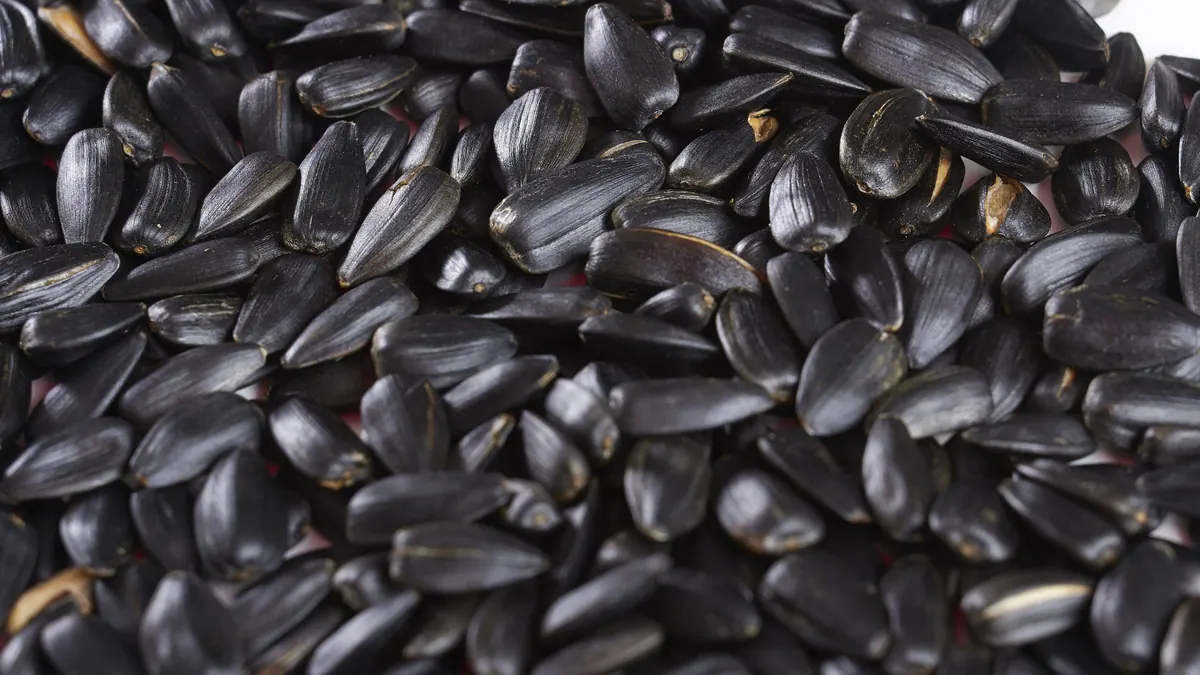
Sunflower seeds — BMP: 11 studies, weighted mean 493 m³ CH₄/t VS
493 m³ CH₄/t VS weighted mean from 11 studies
≈63 %
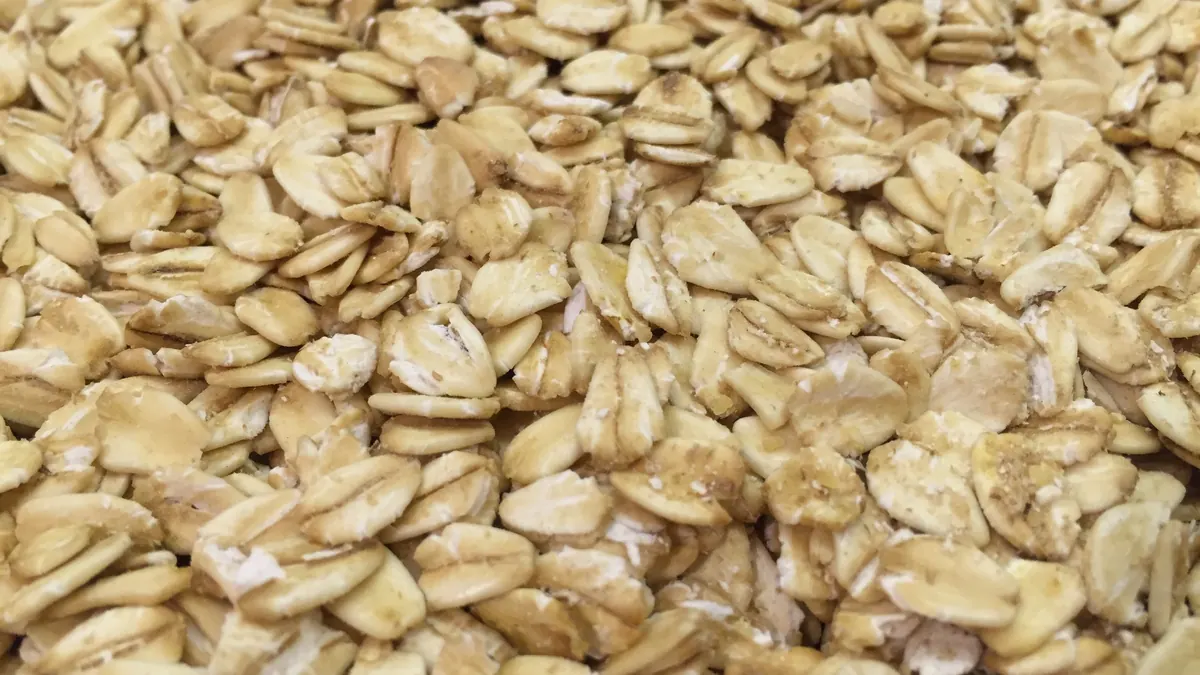
Cereal flakes (oat, corn) — BMP: 2 studies, weighted mean 376 m³ CH₄/t VS
376 m³ CH₄/t VS weighted mean from 2 studies
≈52 %
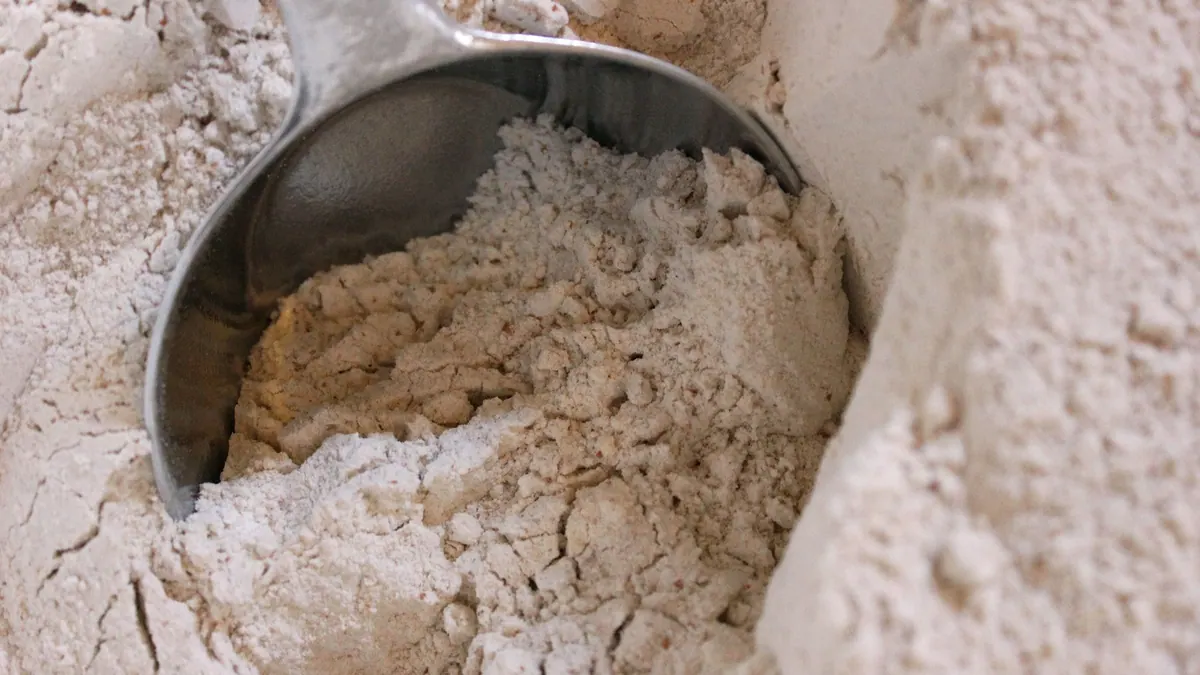
Cereal grain and flour — BMP: 4 studies, weighted mean 350 m³ CH₄/t VS
350 m³ CH₄/t VS weighted mean from 4 studies
very good — editorial rating for biogas plants≈52 %
Bird feed (seed mix) — BMP: 10 studies, weighted mean 387 m³ CH₄/t VS
387 m³ CH₄/t VS weighted mean from 10 studies
≈52 %