

BMP testingGrain, bran, feed and foddersingle study (2 samples)
Cereal flakes (oat, corn) — BMP: 2 studies, weighted mean 376 m³ CH₄/t VS
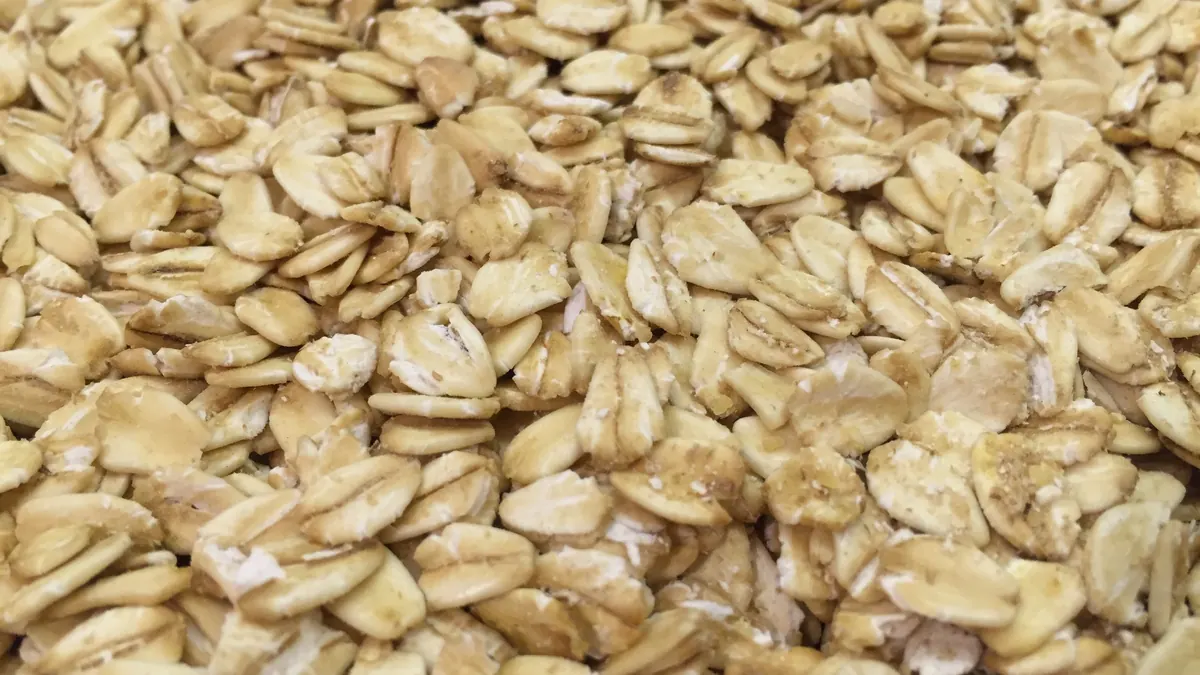
Breakfast cereals (oat, corn flakes) are processed starchy food, very readily fermentable. At a biogas plant they appear as out-of-date or rejected production batches.
Photo Yonygg / Wikimedia Commons, licence CC BY-SA 4.0, source file; changes: cropping

- Weighted mean
- 376m³ CH₄/t VS
- Range
- 363–390m³ CH₄/t VS
- Records
- 2single study (2 samples)
- Publications
- 1source
- Temperatures
- —of the test
Methane in biogas
Medium methane content · ≈ 5.2 kWh/m³ of biogas
estimate from the substrate type The collected studies contain no measurement. The interval follows from the approximate composition (carbohydrate-dominated (no protein or fat characteristics)) and the yields of compound groups according to FNR.
Rating for biogas plants
not rated — editorial rating for biogas plants
Not rated: no dry matter or volatile solids in the data. We calculate the rating when the dry matter and volatile solids of the material are known.
Add to the co-digestion calculator CSV data
BMP curves from 2 studies
Weighted mean Individual records
Dashed lines are a model curve (first-order kinetics, B(t) = B₀·(1 − e−kt)); the end point comes from the publication. All curves are model curves.
Cumulative methane production over the test [m³ CH₄/t VS]. The thick line is the weighted mean of all records (376); dots mark the end values given in the publications. Point at the chart to read values; click a legend item to hide or show a record.
Records and sources
Download CSV| Source | BMP m³ CH₄/t VS | Temperature | Sample | Curve |
|---|---|---|---|---|
| Koch et al. (2020) · 1 DOI | 363 | — | Cornflakes | end point (model curve) |
| Koch et al. (2020) · 2 DOI | 390 | — | Oat flakes | end point (model curve) |
| Weighted mean | 376 | arithmetic mean 376, SD 19 | ||
Process properties
Advantages
- Methane potential in the database: weighted mean 376 m³ CH₄/t VS (median 376; range 363–390; 2 records from 1 sources).
Drawbacks and risks
- Readily degradable starch and sugars – risk of acidification (Chen 2008).
- Spread of results in the database: standard deviation 19 at a mean of 376 m³ CH₄/t VS (2 records from 1 sources).
Co-digestion — what to combine it with, what to watch out for
- combines well
substrates: high alkalinity (buffer) — e.g. Cattle manure, Pig slurry, Cattle slurry, Duck slurry, Rumen and digestive tract content
Dosing
No source-based dose limits.
Introduce gradually, starting with a small dose and monitoring the process (e.g. FOS/TAC, pH, gas composition).
Practical requirements
- Shred: shredding increases the surface available for degradation and speeds it up, but does not necessarily raise the final gas yield (FNR 2010, Ch. 3 “Triturado”).
Sources of the process data
- Chen, Y.; Cheng, J.J.; Creamer, K.S. (2008) Inhibition of anaerobic digestion process: A review. Bioresource Technology
- Weiland, P. (2010) Biogas production: current state and perspectives. Applied Microbiology and Biotechnology
- Koch, K.; Hafner, S.; Astals, S.; Weinrich, S. (2020) Evaluation of Common Supermarket Products as Positive Controls in Biochemical Methane Potential (BMP) Tests. Water 12(5), 1223
- FNR (2010). Guía sobre el Biogás – Desde la producción hasta el uso (hiszp. wydanie „Leitfaden Biogas”, GIZ 2013)
The co-digestion calculator will assess a specific mixture containing this substrate.
What it is and where it comes from
Breakfast cereals are food industry products made from oats, maize and other cereals, often after heat treatment. They may reach a biogas plant as out-of-date goods from trade, rejects from production lines, or material that is damaged or fails quality standards. The compilation contains several records from one publication: corn flakes and oat flakes. It is therefore a narrow base, without differentiation by producer and recipe.
Properties relevant to digestion
Flakes consist mainly of starch, with some protein and a small amount of fat and fibre. Heat treatment increases the availability of starch to enzymes, which speeds up hydrolysis. In practice this means a rapid rise in organic acid production and, at too high a dose, a fall in pH and inhibition of methanogenesis. Some breakfast cereals contain sugar, honey or other additives, as well as vitamins and mineral salts, which change the composition. The material is dry and dusty, and requires wetting or mixing with a liquid substrate. A high dry matter content makes storage easier, as long as it is dry.
How to read the spread of results
The records describe different products, so their difference reflects composition (oats contain more protein, fat and fibre, while corn flakes are more starchy) and not measurement uncertainty. Among the factors affecting the result in real batches are additives (sugar, honey, coatings, flavourings), the degree of processing, moisture and packaging, if the batch has not been separated from them. The test temperature is not given, which makes comparison with other substrates difficult. The small number of records is not enough to assess variability.
In biogas plant practice
Breakfast cereals can be an energy supplement to the mix, best at a small share and dosed gradually to avoid acidification. Food waste usually arrives in packaging, which has to be separated in a depackaging unit; an admixture of plastic and paper is the main technical problem. Origin from trade or the food industry means that when accepting waste, compliance with the permit held and documentation, including the appropriate waste codes, are important. The yield should be confirmed with a BMP test of the specific batch.
Methodology in brief
BMP is the amount of methane obtained from volatile solids (VS) in a batch test, given in m³ CH₄ per tonne of VS (numerically the same as NmL CH₄/g VS in the publications) and converted to normal conditions (0 °C, 101.325 kPa). The weighted mean gives each publication a total weight of 1, split equally between its results for the substrate — a paper testing twenty varieties does not outweigh a paper with a single sample. In inter-laboratory programmes the unit is the laboratory (total weight 1), and within it the weight of a test grows with the number of bottles (replicates). Results after pretreatment (e.g. thermal, chemical, enzymatic) are shown separately and are not included in the mean.
Solid lines are curves measured in the tests. Where a publication gives only the final result, we draw a first-order kinetic model, B(t) = B₀·(1 − e−kt): only the end point comes from the publication, and the shape of the curve serves purely as visualisation — do not read the production on a particular day from it. For this substrate k = 0.257 d−1 was assumed (median of rate constants k reported in the sources and/or fitted to the mean measured curves).
The statistics describe the spread of published results — a descriptive compilation, not a meta-analysis or a guarantee of plant yield.
Bibliography
- Koch, K.; Hafner, S.; Astals, S.; Weinrich, S. (2020). Evaluation of Common Supermarket Products as Positive Controls in Biochemical Methane Potential (BMP) Tests. Water 12(5), 1223. DOI: 10.3390/w12051223 DOI
All sources of the site: bibliography.
Other substrates in the group “Grain, bran, feed and fodder”
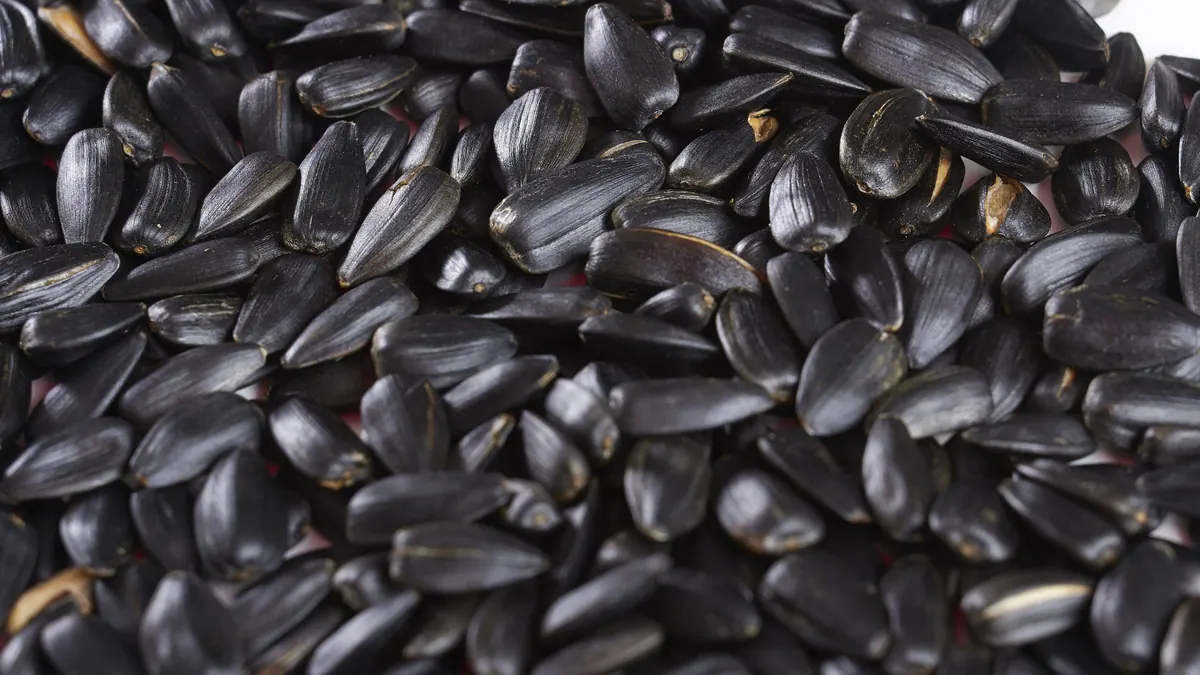
Sunflower seeds — BMP: 11 studies, weighted mean 493 m³ CH₄/t VS
493 m³ CH₄/t VS weighted mean from 11 studies
≈63 %
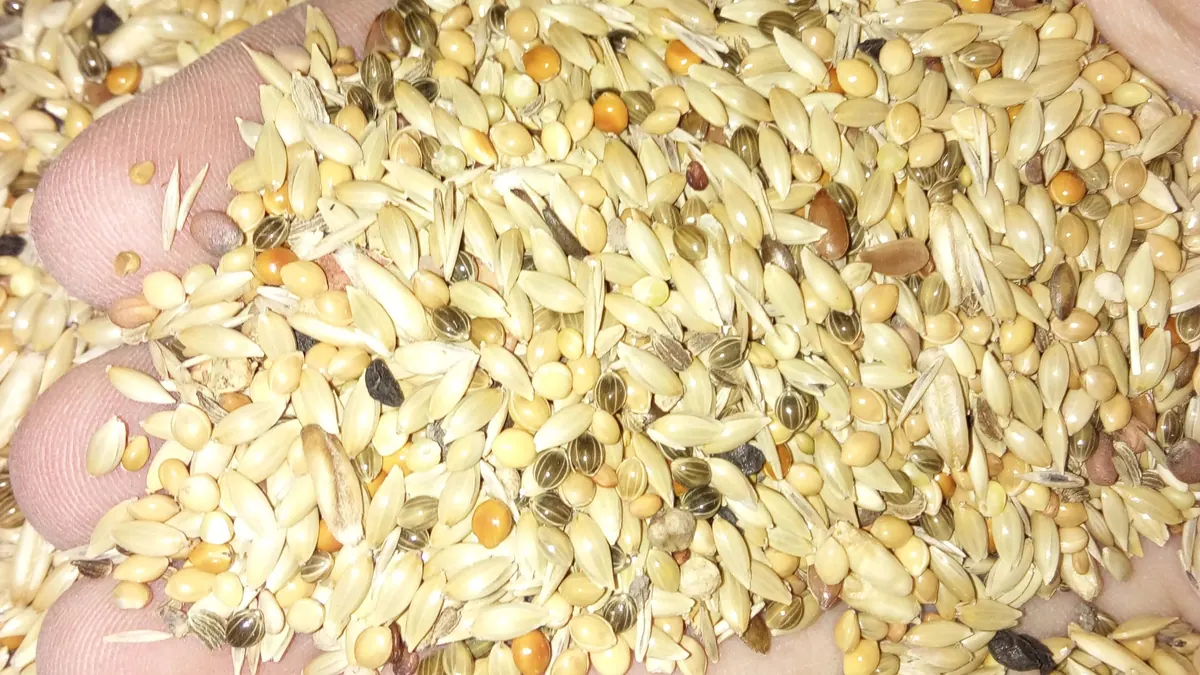
Bird feed (seed mix) — BMP: 10 studies, weighted mean 387 m³ CH₄/t VS
387 m³ CH₄/t VS weighted mean from 10 studies
≈52 %
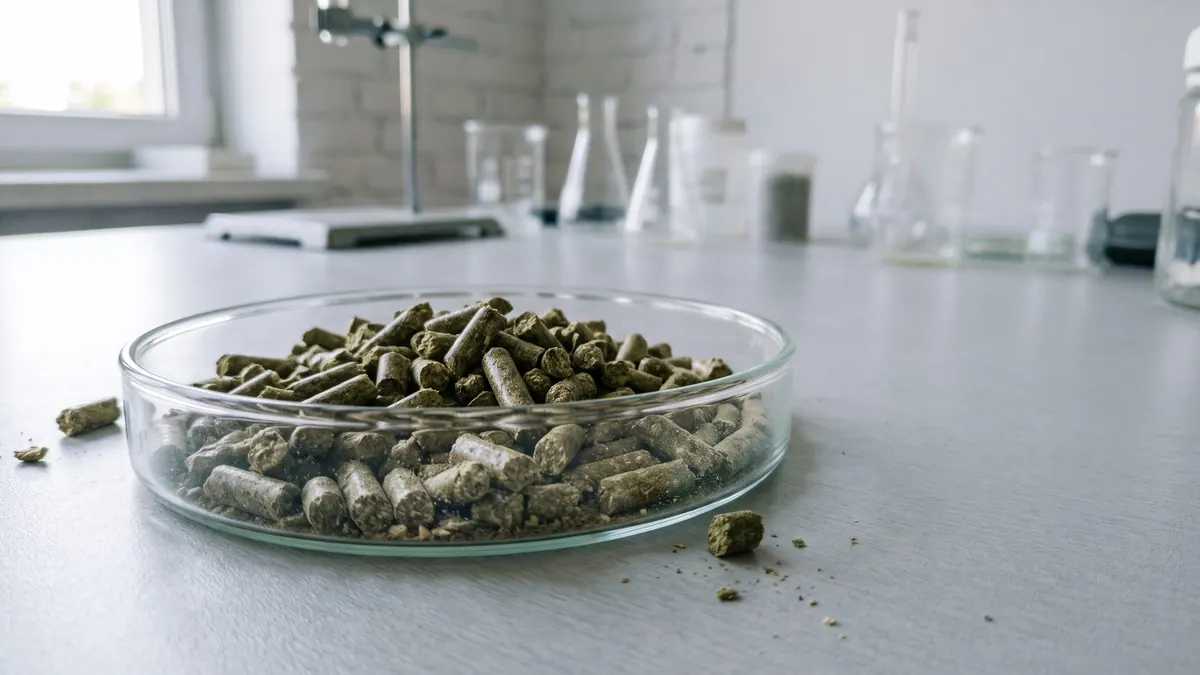
Rabbit and rodent feed pellets — BMP: 12 studies, weighted mean 330 m³ CH₄/t VS
330 m³ CH₄/t VS weighted mean from 12 studies
≈52 %
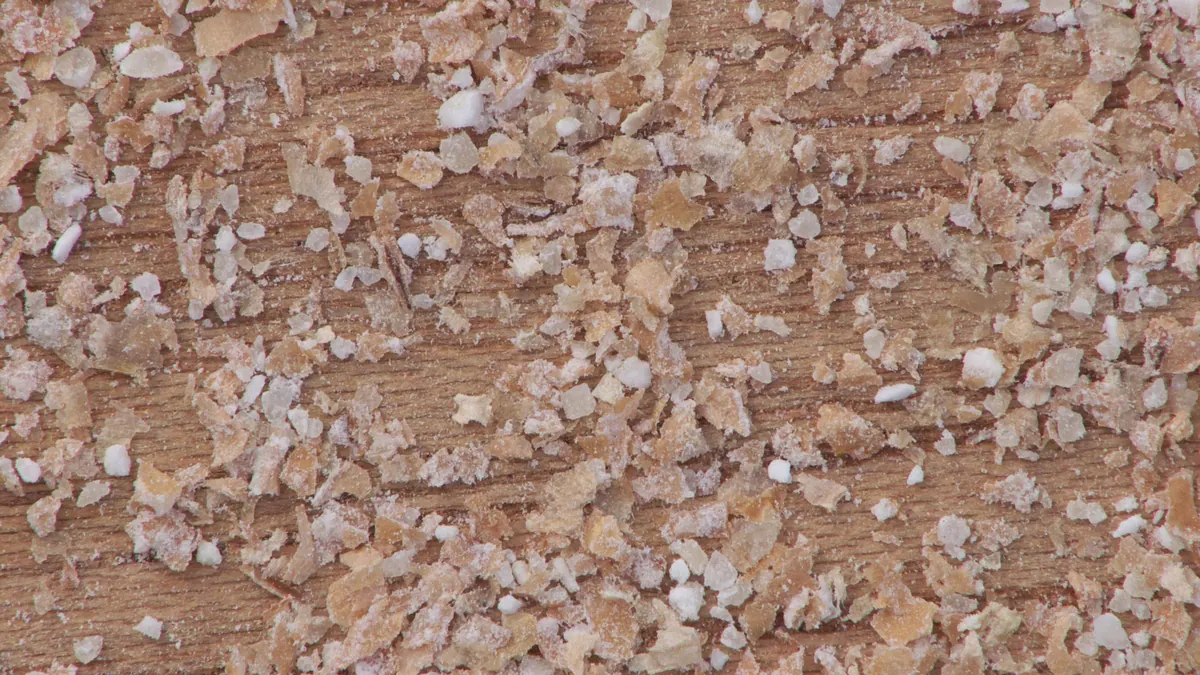
Wheat bran — BMP: 2 studies, weighted mean 330 m³ CH₄/t VS
330 m³ CH₄/t VS weighted mean from 2 studies
very good — editorial rating for biogas plants≈52 %