

BMP testingEnergy crops and whole-crop plants (WCS)
Energycane (Saccharum hybrids) — BMP: 19 studies, weighted mean 281 m³ CH₄/t VS
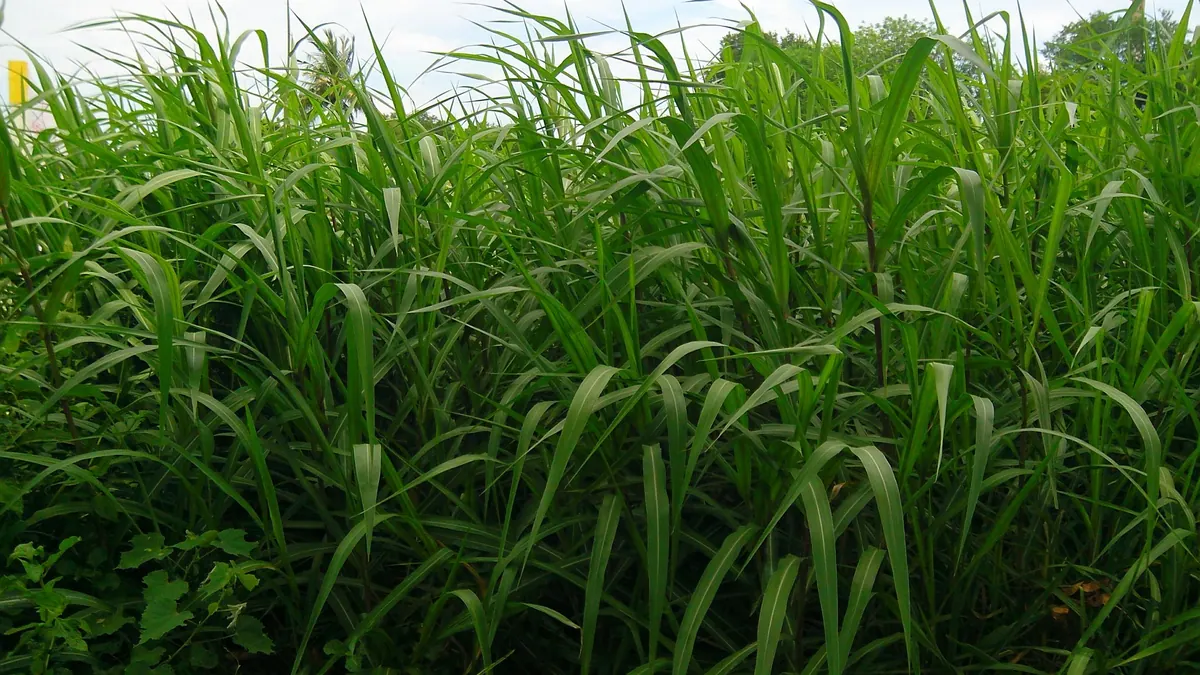
Energy cane (energycane, Saccharum hybrids) is a high-yielding tropical grass with more fibre than sugarcane. The dataset rests on several older studies.
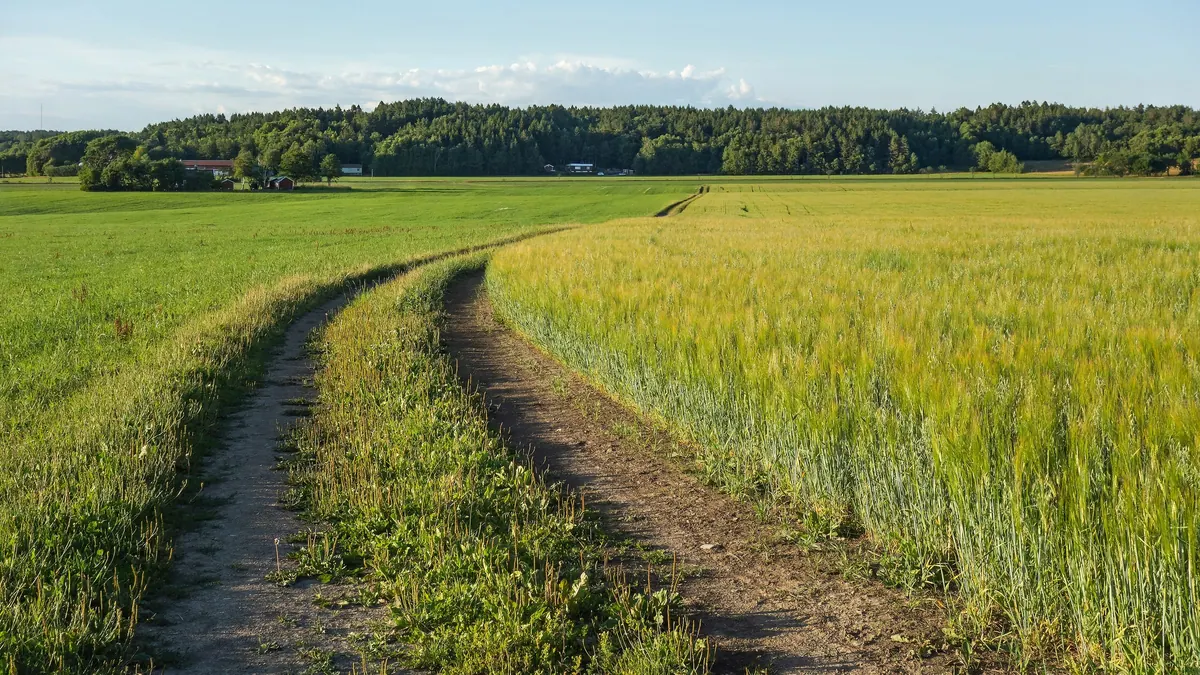
Photo Thamizhpparithi Maari / Wikimedia Commons, licence CC BY-SA 4.0, source file; changes: cropping

- Weighted mean
- 281m³ CH₄/t VS
- Range
- 228–320m³ CH₄/t VS
- Records
- 19studies
- Publications
- 2sources
- Temperatures
- 35 °Cof the test
Methane in biogas
Medium methane content · ≈ 5.2 kWh/m³ of biogas
estimate from the substrate type The collected studies contain no measurement. The interval follows from the approximate composition (carbohydrate-dominated (no protein or fat characteristics)) and the yields of compound groups according to FNR.
Rating for biogas plants
not rated — editorial rating for biogas plants
Not rated: no dry matter or volatile solids in the data. We calculate the rating when the dry matter and volatile solids of the material are known.
Add to the co-digestion calculator CSV data
BMP curves from 19 studies
Weighted mean Individual records
Dashed lines are a model curve (first-order kinetics, B(t) = B₀·(1 − e−kt)); the end point comes from the publication. All curves are model curves.
Cumulative methane production over the test [m³ CH₄/t VS]. The thick line is the weighted mean of all records (281); dots mark the end values given in the publications. Point at the chart to read values; click a legend item to hide or show a record.
Show the remaining records in the legend (7)
Records and sources
Download CSV| Source | BMP m³ CH₄/t VS | Temperature | Sample | Curve |
|---|---|---|---|---|
| Chynoweth et al. (1993) · 1 DOI | 228 | 35 °C · mesophilic | Energycane | end point (model curve) |
| Chynoweth et al. (1993) · 2 DOI | 240 | 35 °C · mesophilic | Energycane | end point (model curve) |
| Chynoweth et al. (1993) · 3 DOI | 245 | 35 °C · mesophilic | Energycane | end point (model curve) |
| Chynoweth et al. (1993) · 4 DOI | 246 | 35 °C · mesophilic | Energycane | end point (model curve) |
| Chynoweth et al. (1993) · 5 DOI | 251 | 35 °C · mesophilic | Energycane · pretreatment: Dried 40% moisture -R10 | end point (model curve) |
| Chynoweth et al. (1993) · 6 DOI | 253 | 35 °C · mesophilic | Energycane · pretreatment: Dried to 20% moisture R7 | end point (model curve) |
| Chynoweth et al. (1993) · 7 DOI | 261 | 35 °C · mesophilic | Energycane | end point (model curve) |
| Chynoweth et al. (1993) · 8 DOI | 265 | 35 °C · mesophilic | Energycane · pretreatment: Ensiled | end point (model curve) |
| Chynoweth et al. (1993) · 9 DOI | 277 | 35 °C · mesophilic | Energycane · pretreatment: none (sample designation in the source: R2) | end point (model curve) |
| Chynoweth et al. (1993) · 10 DOI | 279 | 35 °C · mesophilic | Energycane · pretreatment: none (sample designation in the source: R1) | end point (model curve) |
| Chynoweth et al. (1993) · 11 DOI | 290 | 35 °C · mesophilic | Energycane | end point (model curve) |
| Chynoweth et al. (1993) · 12 DOI | 293 | 35 °C · mesophilic | Energycane · pretreatment: Dried 40% moisture -R5 | end point (model curve) |
| Chynoweth et al. (1993) · 13 DOI | 294 | 35 °C · mesophilic | Energycane | end point (model curve) |
| Chynoweth et al. (1993) · 14 DOI | 298 | 35 °C · mesophilic | Energycane | end point (model curve) |
| Chynoweth et al. (1993) · 15 DOI | 299 | 35 °C · mesophilic | Energycane | end point (model curve) |
| Chynoweth et al. (1993) · 16 DOI | 320 | 35 °C · mesophilic | Energycane | end point (model curve) |
| Deren et al. (1991) · 1 DOI | 270 | 35 °C · mesophilic | Saccharum hybrids | end point (model curve) |
| Deren et al. (1991) · 2 DOI | 290 | 35 °C · mesophilic | Saccharum hybrids US 72-1288 | end point (model curve) |
| Deren et al. (1991) · 3 DOI | 310 | 35 °C · mesophilic | Saccharum hybrids US84-1009 | end point (model curve) |
| Weighted mean | 281 | arithmetic mean 274, SD 26 | ||
Typical composition
- Dry matter (DM)
- 41.5% (range 39–44)
Median and range of the determinations reported in the publications behind this substrate's BMP records (read from: CROPGEN D4); dry matter: 2 determinations, volatile solids: 0 determinations.
Sources: Deren et al. (1991).
The composition of the raw material varies between batches — for plant calculations use an analysis of your own sample. The calculator inserts typical values automatically.
Process properties
Low confidence: the description is based on general characteristics of the substrate group, not on studies of this material. Treat it as a hint to be verified.
Advantages
- Methane potential in the database: weighted mean 281 m³ CH₄/t VS (median 277; range 228–320; 19 records from 2 sources).
- Saccharum hybrids (energycane) studied in the papers Chynoweth 1993 and Deren 1991.
Drawbacks and risks
- Spread of results in the database: standard deviation 26 at a mean of 274 m³ CH₄/t VS (19 records from 2 sources).
Co-digestion — what to combine it with, what to watch out for
- combines well
group: Animal excreta (slurry, manure, poultry litter)
Co-digestion with excreta (slurry/solid manure) is the standard arrangement for plant biomass: they supply alkalinity and microflora.[1][2]
Dosing
No source-based dose limits.
Practical requirements
- Shred: shredding increases the surface available for degradation and speeds it up, but does not necessarily raise the final gas yield (FNR 2010, Ch. 3 “Triturado”).
Sources of the process data
- Deren, C.; Snyder, G.; Tai, P.; Turick, C.; Chynoweth, D. (1991) Biomass production and biochemical methane potential of seasonally flooded inter-generic and inter-specific Saccharum hybrids. Bioresource Technology 36(2), 179–184
- Weiland, P. (2010) Biogas production: current state and perspectives. Applied Microbiology and Biotechnology
- Chynoweth, D.; Turick, C.; Owens, J.; Jerger, D.; Peck, M. (1993) Biochemical methane potential of biomass and waste feedstocks. Biomass and Bioenergy 5(1), 95–111
- Hendriks, A.T.W.M.; Zeeman, G. (2009) Pretreatments to enhance the digestibility of lignocellulosic biomass. Bioresource Technology
- FNR (2010). Guía sobre el Biogás – Desde la producción hasta el uso (hiszp. wydanie „Leitfaden Biogas”, GIZ 2013)
The co-digestion calculator will assess a specific mixture containing this substrate.
What it is and where it comes from
Energycane is a hybrid of sugarcane (Saccharum) selected not for sucrose content, but for high biomass yield and high fibre content. It is hardier and more robust than sugarcane and can grow on poorer soils. The dataset comprises over a dozen records from several older studies from the early 1990s, including for plantations and ratoons, under conditions of 35 °C.
Properties relevant to digestion
The material is strongly lignocellulosic, with a large share of cellulose, hemicelluloses and lignin. The content of readily available sugars is lower than in sugarcane, but higher than in typical straws. The course of digestion is therefore intermediate: initially faster thanks to the sugars, then slower because of the fibre. The green biomass is moist and requires ensiling or prompt use and chopping. The low protein content means a high C/N ratio. The plant is sensitive to frost.
How to read the spread of results
The records come from several studies, and most from one series of investigations, so they are not fully independent. The differences arise from the clone or variety, plantation age, ratoons, harvest date and plant fractions. Added to this are research protocols from the 1990s, which may have differed from today's in the method of conversion and the test length. The data are therefore a historical reference point, and not a description of modern varieties.
In biogas plant practice
In Poland energycane has no practical significance. Information about it helps in understanding the development of research on tropical energy grasses and provides a reference point for lignocellulosic materials. In growing countries it is considered as a feedstock for biogas and bioethanol, with chopping, ensiling and mixing with nitrogen substrates being key. Any application should be based on a BMP test of material from the target plantation. As a comparative material it makes sense when set alongside sugarcane, bagasse and sugarcane straw, which are described separately in the compendium. The differences between these streams show how strongly the share of soluble sugars relative to fibre affects the properties of the biomass. In practice this means that the data have mainly cognitive value and serve for comparisons, and not for planning plants in Poland.
Methodology in brief
BMP is the amount of methane obtained from volatile solids (VS) in a batch test, given in m³ CH₄ per tonne of VS (numerically the same as NmL CH₄/g VS in the publications) and converted to normal conditions (0 °C, 101.325 kPa). The weighted mean gives each publication a total weight of 1, split equally between its results for the substrate — a paper testing twenty varieties does not outweigh a paper with a single sample. In inter-laboratory programmes the unit is the laboratory (total weight 1), and within it the weight of a test grows with the number of bottles (replicates). Results after pretreatment (e.g. thermal, chemical, enzymatic) are shown separately and are not included in the mean.
Solid lines are curves measured in the tests. Where a publication gives only the final result, we draw a first-order kinetic model, B(t) = B₀·(1 − e−kt): only the end point comes from the publication, and the shape of the curve serves purely as visualisation — do not read the production on a particular day from it. For this substrate k = 0.085 d−1 was assumed (median of rate constants k reported in the sources and/or fitted to the mean measured curves).
The statistics describe the spread of published results — a descriptive compilation, not a meta-analysis or a guarantee of plant yield.
Bibliography
- Chynoweth, D.; Turick, C.; Owens, J.; Jerger, D.; Peck, M. (1993). Biochemical methane potential of biomass and waste feedstocks. Biomass and Bioenergy 5(1), 95–111. DOI: 10.1016/0961-9534(93)90010-2 DOI
- Deren, C.; Snyder, G.; Tai, P.; Turick, C.; Chynoweth, D. (1991). Biomass production and biochemical methane potential of seasonally flooded inter-generic and inter-specific Saccharum hybrids. Bioresource Technology 36(2), 179–184. DOI: 10.1016/0960-8524(91)90177-l DOI
All sources of the site: bibliography.
Other substrates in the group “Energy crops and whole-crop plants (WCS)”
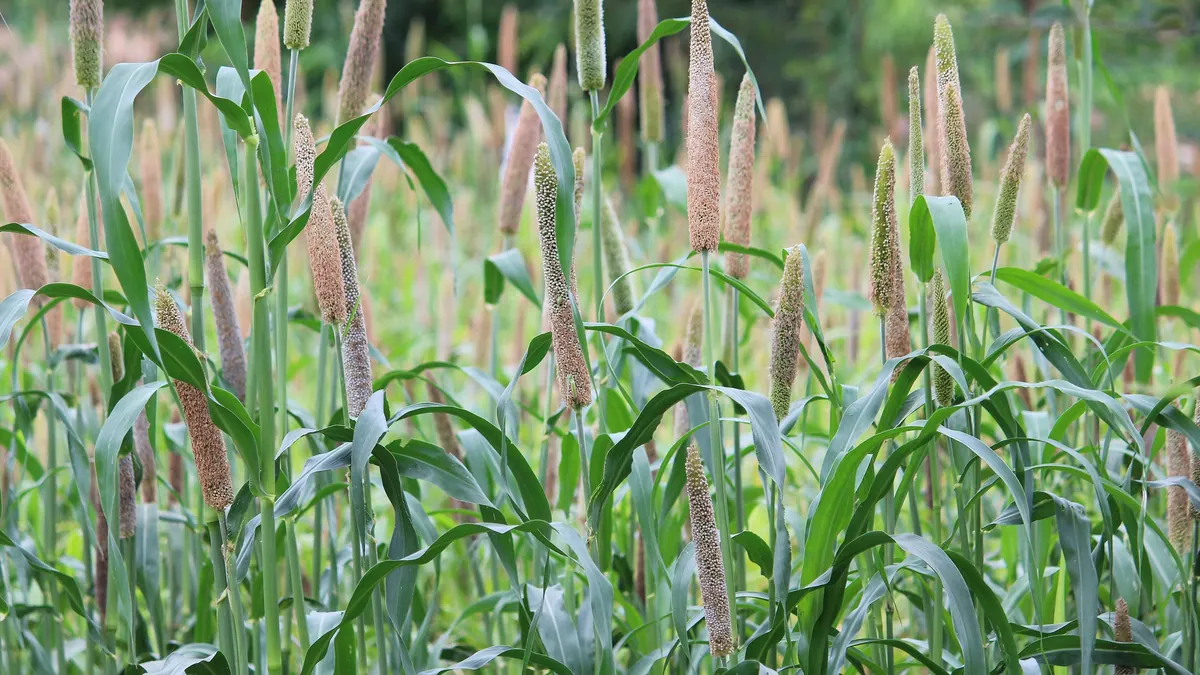
Pearl millet — BMP: 2 studies, weighted mean 280 m³ CH₄/t VS
280 m³ CH₄/t VS weighted mean from 2 studies
≈52 %
Tall wheatgrass (Szarvasi grass) — BMP: 8 studies, weighted mean 313 m³ CH₄/t VS
313 m³ CH₄/t VS weighted mean from 8 studies
good — editorial rating for biogas plants≈52 %
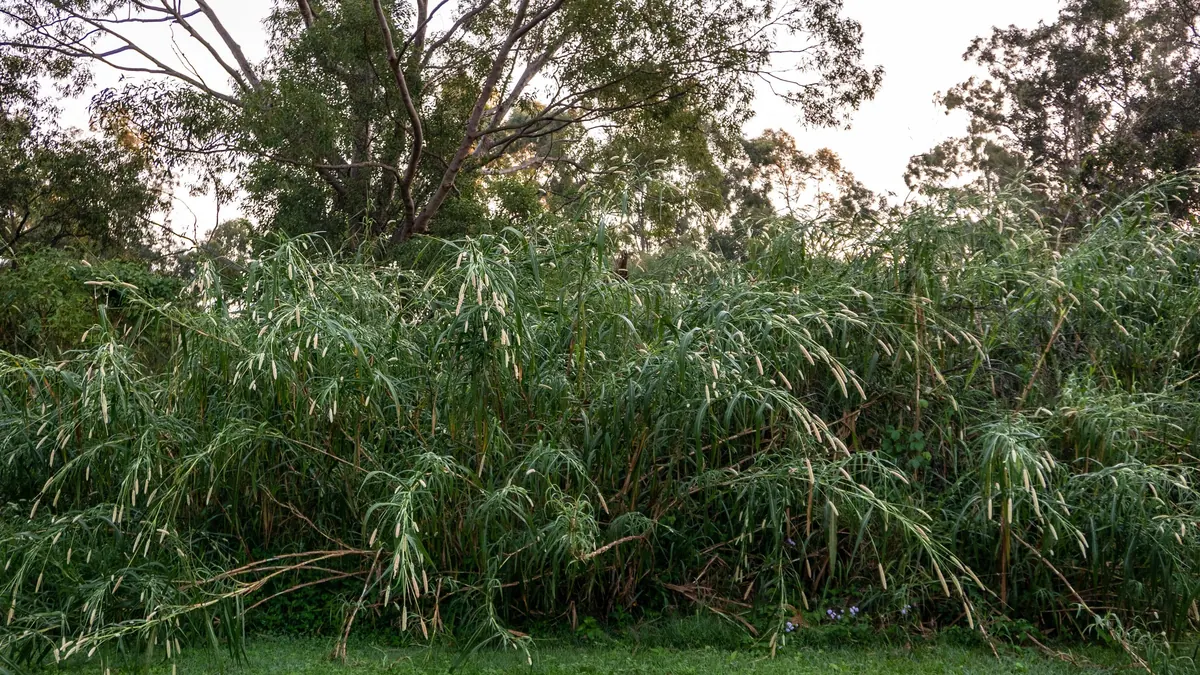
Pennisetum hybrid grass — BMP: 18 studies, weighted mean 266 m³ CH₄/t VS
266 m³ CH₄/t VS weighted mean from 18 studies
neutral — editorial rating for biogas plants≈52 %
Rye, whole crop — BMP: 8 studies, weighted mean 313 m³ CH₄/t VS
313 m³ CH₄/t VS weighted mean from 8 studies
good — editorial rating for biogas plants63 %